Data Generation Methods for Multi-Label Images of LEGO Bricks
←
→
Page content transcription
If your browser does not render page correctly, please read the page content below
Data Generation Methods for Multi-Label Images of LEGO Bricks

     1
         Berend Kam , Responsible Professor: 1 Dr. J.C. van Gemert , Supervisor: 1 Attila Lengyel
                                               1
                                                 TU Delft
                    bkam@student.tudelft.nl, {J.C.vanGemert, A.Lengyel}@tudelft.nl

                          Abstract
     Data collection and annotation have proven to be a
     bottleneck for computer vision applications. When
     faced with the task of data creation, alternative
     methods to traditional data collection should be
     considered, as time and cost may be reduced signif-
     icantly. We introduce three novel datasets for multi-
     label classification purposes on LEGO bricks: a
     traditionally collected dataset, a rendered dataset,
     and a dataset with pasted cutouts of LEGO bricks.
     We investigate the accuracy of a ResNet classi-
     fier tested on real data, but trained on the different
     datasets. This research seeks to provide both in-
     sight into future dataset creation of LEGO bricks,             (a) Real data     (b) Rendered data    (c) Cut&paste data
     as well as act as an advisor for general multi-label
     dataset creation. Our findings indicate that the tra-       Figure 1: We introduce three novel multi-label datasets of LEGO
     ditionally collected dataset is prone to overfitting        bricks. (a) was collected ’traditionally’ by manually shooting pic-
     due to speedups used during collection, with 90%            tures of LEGO bricks against various backgrounds. (b) was gener-
     accuracy during training but 19% during testing.            ated through rendering software. (c) used cut out images of LEGO
     Furthermore, synthetic data techniques are appli-           bricks and posted them against random backgrounds. While data in
                                                                 (a) is realistic, it is also most costly to produce.
     cable to multi-label LEGO classification but need
     improvement, with accuracy ranging from 34% to
     45%.
                                                                 workers need to be compensated, and latency is significant as
                                                                 human workers tend to work much slower than machines [7].
1   Introduction                                                 To limit costs, data collection can also be partially automated.
Data collection and annotation are a bottleneck for computer     One study used a car to collect data of traffic situations by
vision applications. With computer vision applications be-       driving with camera equipment on board [1]. However, this
coming more commonplace and also more complex, there             data still had to be annotated manually.
is also an increased need for annotated datasets however.           Synthetic data generation, wherein artificial images are
Hence, data collection is an active research topic [1, 2]. Re-   created, is considerably faster and cheaper than traditional
searchers are looking for ways to produce datasets that are      data collection, but can have trouble bridging the gap to real-
more diverse [3], faster [4], and cheaper [5]. According to      ity. This gap is referred to as the domain shift. There are tech-
a 2018 survey [6], in case there is not enough quality data      niques in place that can reduce the effects of this domain shift.
readily available, the only means to collect data is through     Recent works have had success by training with rendered im-
generation. The two main methods of data generation pre-         ages through domain randomization, wherein textures, light-
sented in this survey are data generation through traditional    ing, and backgrounds were randomized [4]. Other advances
methods, and synthetic data generation.                          have been made by generating semi-synthetic data, wherein
   Traditional data is collected and annotated manually, and     images of real objects were cut and paste onto random back-
although this produces realistic data, creating a dataset by     grounds to increase training diversity [5]. Both of these meth-
hand is a task of great proportion [6]. Crowdsourcing is often   ods allowed for cheap and fast collection and annotation, and
used to divide manual labour more effectively, but this pro-     produced results deemed competitive. Alternatively, real data
duces its own challenges. Uncertainty can arise from work-       can be sampled for synthetic data generation [8]. Generative
ers incorrectly following instruction, costs are often high as   Adversarial Nets were able to generate diverse synthetic im-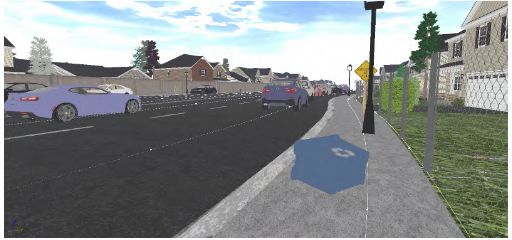
ages by learning features of small real-life datasets [9].          2     Related Works
   To our knowledge, a dataset of multi-label images of
LEGO bricks is missing; although some have trained using
                                                                    2.1    Existing LEGO datasets
synthetic images of single bricks [10], well labelled pictures      There are other works that have looked at creating a dataset
of multiple real LEGO bricks do not exist. A dataset of such        of pictures of LEGO bricks. In particular, software engineer
format is the first step in obtaining networks that can find a      Daniel West created a LEGO sorter along with a dataset of
specific LEGO brick in a large pile of bricks, or immediately       100,000 images of individual LEGO bricks [11]. During his
tell the composition of a pile of bricks. Data collection and       project, West trained an image classifier using rendered im-
annotation can be a time consuming task however. For novel          ages of LEGO bricks, randomizing textures, lighting, and
applications, such as in the case of creating a dataset of im-      noise. Afterwards the sorter was able to correctly identify
ages of LEGO bricks, it is often unclear if synthetic data gen-     single bricks as they were fed to it, including bricks the clas-
eration techniques translate well. A preliminary investigation      sifier had never seen. The sorter photographed bricks as they
into the effectiveness of synthetic datasets can thus have great    passed through the machine, creating a dataset of labelled im-
payoff when those datasets are deemed competitive with tra-         ages of single bricks. This dataset does not contain varied
ditional data. Particularly, two different approaches to syn-       backgrounds or multiple LEGO bricks per image however,
thetic data generation are investigated, and their effectiveness    making it unable to serve as a training dataset for multi-label
is compared to a traditional dataset. Since our approach aims       classification networks or object detection. So while it is suit-
to replicate or surpass traditional dataset generation, an image    able for sorting, for purposes such as finding a certain type of
classification network is trained on different types of datasets,   brick in a large pile of bricks or seeing if a brick is present in
but finally tested on a traditional dataset. Specifically, our      a pile of bricks, this dataset falls short.
main contributions can be summarized as follows:                       A 2018 study [12] also created a LEGO sorter, only this
  • We present three novel datasets of multi-label images           time available data from an online LEGO retail store was
    LEGO bricks, to be used for computer vision purposes,           used, in which users upload pictures of single bricks they
    of which example images are seen in Figure 1. These             aim to sell. While this data offers large variation in back-
    datasets consist of:                                            grounds, lighting, and picture quality, there are significant
                                                                    caveats. For one, for most bricks few images are available,
       1. a ’real’ dataset consisting of manually collected         giving low class representations for most bricks. Second, im-
          pictures of LEGO bricks in various scenes                 ages of multiple bricks are uncommon as most pictures con-
       2. a synthetic dataset of rendered images using struc-       tain 1 or 2 bricks. As a result, this sorter performed worse on
          tured domain randomization                                images containing multiple bricks, and hence this data is also
       3. a synthetic dataset of images generated through cut-      unsuitable for multi-label classification. Other online image
          and-paste strategies                                      databases containing LEGO bricks such as Shutterstock [13]
                                                                    more often contain completed sets or LEGO art, and can-
  • We evaluate the domain shift between the three datasets         not be effectively filtered to contain pictures of only piles: a
    by using a classifying network as a baseline comparator.        dataset created from such a site would have to be handpicked,
    Performance is measured in F1 scores, a metric whose            as well as annotated manually. Additionally, bricks contained
    output ranges from 0 to 1 and which combines precision          within these images may be of many distinct classes, lead-
    and recall.                                                     ing to a large classification domain and again low class rep-
  • We explore possible speedups for generating the real            resentation. To our knowledge, no labeled dataset exists of
    dataset.                                                        multiple LEGO bricks.
We find that for multi-label classification on images with 1-
13 bricks and 85 different classes, F1 scores of up to 0.955        2.2    Traditional data generation
may be achieved when a network trained on synthetic data            The most common way of traditional data generation is
is tested on synthetic data. This F1 score drops significantly      through the use of existing unlabelled databases, such as pic-
when these networks are then used to classify real images:          ture sharing sites. In such a process, ensuring quality, di-
0.406 for rendered data and 0.447 for cut-and-paste data in         versity, and accuracy in labelling of images is a costly and
the best case. The traditionally collected ’real data’ appears      time consuming endeavor [6]. If databases fail to meet these
to be too unbalanced; while each image is different, similar-       requirements, they may be diversified further through data
ities in labels and background cause the classifier to achieve      augmentation, whose common techniques include applying
high scores during training, but low scores on a selected test      filters to, cropping, mirroring, and rotating existing images
set, where an F1 accuracy of 0.192 is achieved. In the fol-         [14, 15]. If this still produces insufficient data, data must
lowing sections we showcase our findings in detail. Section 2       be created, which is a costly task. Although data collection
shows related works and provides background information to          may be automated [1], annotations are mostly created manu-
common methods to create multi-label datasets. Section 3 de-        ally. Our research presents a labelled sample dataset gener-
tails the methods used to create data. Section 4 showcases the      ated from scratch, without the use of crowdsourcing during
experimental setup, section 5 discusses the results, followed       collection.
by section 6 in which we discuss possible fallacies and ethi-           Data must meet specific requirements to accurately train
cal implications of our research. In section 7, a conclusion is     computer vision applications. First, to allow for preserva-
drawn.                                                              tion of physical properties that may be used in certain com-
puter vision applications [16], and to preserve images in high
quality as low quality images may reduce performance [17],
past research has created datasets using DSLR cameras [18].
Other Large databases, such as the VOC2007 database, have
variation in object size, orientation, pose, illumination, po-
sition and occlusion [19]. In the case that data is not avail-
able through existing databases, it is necessary to simulate
these factors. Failure to do so can result in under representa-
tive datasets, such as in the case a research where video data
of traffic scenes in Germany did not translate well to traf-
fic scenes from other countries [1]. In summary, variation
in backgrounds, camera angle, camera zoom (size), illumina-
tion, occlusion, orientation of bricks and position are factors
to look out for when collecting LEGO images. All images are
shot using a DSLR camera. Figure 2: Two similar cut-and-paste images with varying levels of
Gaussian blur. Blur removes the boundary artifact present in the first
2.3 Cut-and-paste dataset generation image, but may reduce artifact overall appearance
Cut-and-paste strategies are a state-of-the-art method for syn-
thesizing datasets [5] , greatly reducing production costs as 2.4 Rendered data generation
images are not collected or annotated manually. Compared Rendered images pose a viable solution to both the high cost
to rendered images, cut-and-paste images instinctively suf- and latency of traditional data creation [2, 4], yet other prob-
fer less from physical limitations as they are more ’real’, but lems arise for such databases. Although variation in control-
may suffer from lack of 3D orientation coverage as well as lable factors can be synthesized, the gap to reality is large.
accurate lighting and shadows. A quick summary of the cut- Besides the obvious difference in realism of a rendered image
and-paste method follows below: as compared to a real image, unforeseen factors and distrac-
tors in real data often derail networks trained on synthesized
1. Images of objects to be pasted are collected. data. Domain randomization [4] must be applied to overcome
2. Images of scenes are collected. these factors. In short, domain randomization includes ran-
domly placing distractor objects in rendered scenes, as well as
3. Objects are isolated from their backgrounds. strongly randomizing lighting, camera angles, camera zoom,
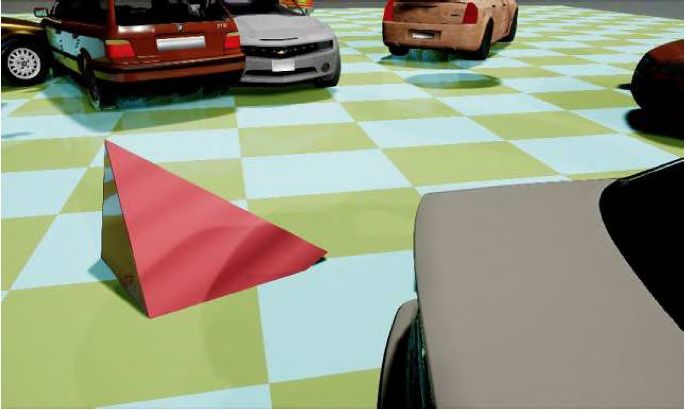
and textures. Structured domain randomization limits the ran-
4. Objects are pasted into the background, making use of
domness of these factors, by placing strong emphasis on real-
both blending and data augmentation
istic random factors. For example, instead of randomly plac-
Region-based features play a significant role in computer vi- ing distractor objects in scenes, high probability is given to
sion [20], and this is a double edged sword. For one, it allows contextually sound locations. See Figure 3. Our research im-
us to ignore physical limitations of brick placement in real plements structured domain randomization instead of domain
life, for example, a brick may be pasted on the side of a cup- randomization as LEGO bricks may be distinct only on tex-
board without significantly increasing error rates. Second, ture, hence full randomization may make some classes indis-
blending must be used to remove boundary artifacts that arise tinguishable. As no distractor objects are present in the tradi-
from pasting images, as seen in Figure 2. The two modes of tionally collected data, the rendered data will also not contain
blending proposed are Gaussian blur and Poisson blending, any distractor objects.
with best results achieved by applying to each configured im-
age both types of blending and no blending separately. This 2.5 Classification network
means for each configuration of pasted objects, 3 images are Image classification is a common application for image
created. Data augmentation is used to further make images datasets, and both single label classification and multi-label
robust. Random 2D rotations of pasted objects, as well as classification [21] are common research topics. Since LEGO
using multiple pictures of the same object from different an- bricks are often found together, the data collected is geared
gles throughout the dataset, ensuring angle coverage. Further towards multi-label classification. A popular class of image
augmentations are partially overlapping objects in a process clasifier is the residual network classifier, or ResNet in short.
called occlusion, and objects placed partially out of bounds, It is similar to a Convolutional Neural Network with up to
called truncation. Finally, non-classified ’distractor’ objects one thousand layers and may be used a standard comparator
are also pasted into the scene. While our research aims to for new networks [22]. Alternatives to ResNet may include
replicate this method of data generation, no distractor objects classification networks such as ResNext [23] and WideRes-
are added as these are not present in the traditionally collected Net [24]. We implement a ResNet-50 network and apply
data. Additionally, given the size of the dataset, brick config- thresholding to turn it into a multi-label classifier [25].
urations across images are not repeated with aim to increase On a more general note, all types of classification networks
data diversity. Lastly, to further reduce boundary artifacts an benefit greatly from balanced classes [26], as well as large
alpha channel is added instead of an object mask. amounts of class representation. ImageNet, a commonly used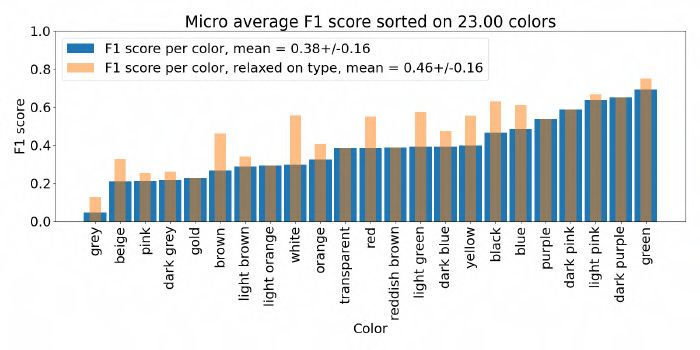
more bricks are not generated due to annotation costs [29].
                                                                     To speed up the collection process, several speedups are in-
                                                                     troduced. For one, all labels for pictures are produced ran-
                                                                     domly before collection, so that no time is wasted recording
                                                                     labels manually. Second, each combination of LEGO bricks
                                                                     is photographed three times, rearranging the bricks in a ran-
                                                                     dom manner in between pictures, and varying camera angle
                                                                     and zoom. Both occlusion and truncation occur naturally dur-
                                                                     ing this random rearrangement and are not prevented. Third,
                                                                     a random brick is taken away or added to the combination to
                                                                     create a new combination, and this is repeated every 3 pic-
                                                                     tures for up to 10 times. This depends on if a boundary for
                                                                     the amount of bricks per image is reached beforehand, so ei-
                                                                     ther 1 or 13 bricks. Lastly, to maintain class balance with
               (a) Domain Randomization. Img source: [4]
                                                                     these speedups, the lowest represented classes may be given
                                                                     priority when creating random combinations. Figure 4 show-
                                                                     cases the class balance of the real dataset. It is noted that such
                                                                     speedups may cause imbalances as classes of bricks may ap-
                                                                     pear together relatively frequently, as well as combinations of
                                                                     bricks and backgrounds. This is not a certainty however, as
                                                                     this relation decreases relative with size.

         (b) Structured Domain Randomization. Img source: [2]

Figure 3: Two differently rendered images. Note the difference in
realism of car placement, textures, and distractor objects

database for computer vision applications, has around 650
images per class, as per June, 2020 [27]. While the amount
of data is often targeted as most important metric, as a lack        Figure 4: Class balance of the traditionally collected data and of a
of data often leads to reduced accuracy and increased error          uniform randomly drawn dataset, which acts as comparator. While
rates, aspects such as class type and amount of features of ob-      the rendered and cut-and-paste data are also uniform randomly
jects should not be overlooked. For similar objects that rely        drawn, the real data is actively balanced due to speedups in data
on many features for distinction classification accuracy may         collection.
decrease drastically [28]. LEGO bricks may be prone to er-
rors of this type, as bricks may vary only on one relatively            Bricks are photographed from different camera angles, as
small detail, such as color, amount of eyes, or small changes        well as shuffled around in between pictures to ensure that
in shape. Lastly, the asymmetric shape of some bricks may            bricks can be recognized from a variety of viewpoints. Fur-
lead to a large amount of possible 2D representations, which         thermore, backgrounds and lighting are varied every around
could also lead to reduced classification rates.                     70 pictures to prevent the model from over-fitting on one type
                                                                     of background or lighting. Figure 5 shows the difference be-
3       Methodology                                                  tween various pictures. The images are saved in a HQ RAW
To compare several data generation techniques, we generate           format, which are unfiltered images that preserve physical
3 different datasets. These are: a traditional ’real’ dataset that   qualities which are important in physics-based computer vi-
acts as a baseline comparator, a cut-and-paste dataset, and a        sion systems [16].
rendered dataset. Subsection 3.1, 3.2 and 3.3 describe the
                                                                     3.2   Cut-and-paste data
generation methods for these datasets.
                                                                     Similar to the baseline dataset, the cut-and-paste dataset con-
3.1       Realdata                                                   tains a random 1-13 bricks per image. A full overview of
A dataset is created by shooting around 3000 images of               the cut-and-paste data creation process can be found in Fig-
LEGO bricks, with the main focus on class balance. There             ure 6. Original images for each class of brick were pho-
are 85 different classes of bricks1 , each picture contains a        tographed from 4 different angles, ensuring that all sides are
random selection of 1-13 LEGO bricks. Combinations of                photographed at least once. They are shot against a dis-
                                                                     tinct color background to allow for facilitated edge detection.
    1
        a selection is made out of the LEGO Classic set 110002       To create photoshopped cutouts for each brick, backgrounds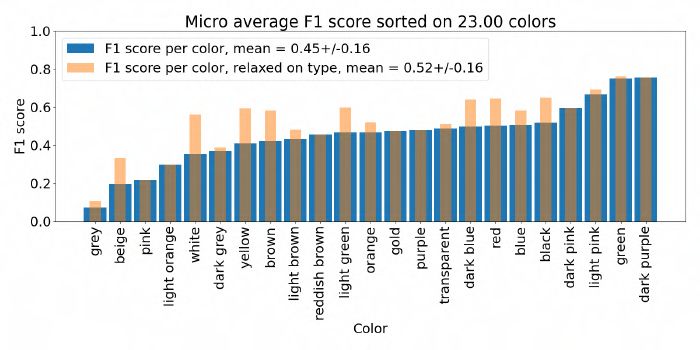
(a) Parquet floor, natural (b) Wooden desk, artificial          Figure 7: An annotated rendered image produced through struc-
       lighting                   light                                tured domain randomization. Camera angle and zoom, backgrounds,
                                                                       lighting and brick combinations are varied between pictures. A
Figure 5: Two examples of variations between traditionally collected   physics simulation ’drops’ bricks to produce random brick orien-
pictures. Lighting, background, camera angle, camera zoom, and         tation.
brick orientation may be varied between pictures.
                                                                       scene at varying brightness levels. Lastly, to accurately por-
were manually removed using photoshop, and an alpha chan-              tray varying brick orientation, a physics simulation ’drops’
nel was added to help smooth out any pasting discrepancies.            bricks onto the surface, after which the render is captured and
Images were resized to tightly fit the brick. This image size          data augmentation is applied; to ensure that downsampling
also acts as a bounding box for annotation.                            images to training size does not compromise recognizability
                                                                       of bricks in pictures that are zoomed out, pictures are cropped
                                                                       to annotation [25].

                                                                       4        Experimental Setup
                                                                       An F1 score calculation is used to compare classification rates
                                                                       across datasets [31]. As F1 scores are a combination of the
                                                                       precision and recall, they give insight into false positive and
                          (b) Randomly select                          false negative rates simultaneously. We implement two meth-
      (a) Cut out brick   background          (c) Paste into scene     ods of calculating F1 scores: micro-averaged and macro-
                                                                       averaged. Micro-averaging takes the average over all labels,
                                                                       whereas macro-averaging calculates scores per instance, and
                                                                       then takes the average over all instances. All formulas are
                                                                       given in (1-4).

                            (d) Label brick                                                                    P
                                                                                                                    c∈C   T Pc
                                                                           micro-average precision = P                    P                 (1)
      Figure 6: 4 step process for creating a cut-and-paste image                                        c∈C   T Pc +          c∈C   F Pc

   Each background from the baseline dataset is pho-
                                                                                                              X        T Pc
                                                                                  micra-average precision =                                 (2)
tographed without bricks. This gives 124 different pictures                                                         T Pc + F Pc
                                                                                                              c∈C
that can be used as background. To further diversify the back-
ground, they are randomly mirrored or flipped. Pasted bricks                                                  P
                                                                                                                        T Pc
have a 50% chance of being mirrored, and have a random ro-                                                        c∈C
                                                                            micro-average recall = P                    P                   (3)
tation of 0-359 degrees. To prevent boundary artifacts created                                        c∈C   T Pc +        c∈C    F Nc
by pasting [20], each image is blended in by using random                                                   X         T Pc
varying radii of Gaussian blur of 0-1. No further blur was ap-                     macro-average recall =                                   (4)
plied some research suggests that a blur greater than 2 might                                                     T Pc + F Nc
                                                                                                            c∈C
significantly reduce accuracy [17].
3.3     Rendered data                                                     To calculate the F1 score, the harmonic mean is taken of
                                                                       the precision and recall. See (5). This will give scores of
We synthesize 5000 images of 1-13 LEGO bricks per picture,
                                                                       between 0 up to 1. Both the micro and macro scores may be
classes remain the same. 3D models of bricks are downloaded
                                                                       used in the results depending on the applicability2 , and tables
from the Rebrickable [30]. All bricks are fitted with a tight
                                                                       and figures will indicate which metric is being used.
bounding box relative to the camera angle, as seen in Figure
7.                                                                                                 precision ∗ recall
   We apply structured domain randomization [2] on the                                  F1 = 2 ∗                                    (5)
                                                                                                   precision + recall
following factors: to increase robustness to varying back-
                                                                          In overview, each dataset is sampled for 3000 images, and
grounds, the floor of the rendered model is fitted with one
                                                                       then split up into a training, validation, and test set. Then, a
of the 124 backgrounds from the baseline dataset. To ensure
varying camera angles and to increase robustness to relative                2
                                                                            Micro-average scores are insightful to overall performance
brick size, both angle and zoom are randomized for each im-            while macro-average scores are useful for measuring performance
age. A single light source is also randomly placed within the          per instance
classification network is trained seperately for each dataset,     and accuracy during training of both real datasets can be seen
and scores are determined on their respective test set. For        in Figure 8. When fully trained on synthetic data, Resnet-50
the rendered and cut-and-paste datasets, scores are also deter-    classification networks have an F1 accuracy of around 0.4 for
mined on the test set of the real dataset. Next, 5000 images of    both renderend and cut-and-paste data. Further details of the
the synthetic datasets are taken and split again into training,    results of running the real test set on each classifier can be
validation, and test sets. Again networks are trained sepa-        found in appendix A, Figures 13-16. The most notable re-
rately and scores are calculated on their respective test sets     sults are summarized here: for one, both the cut-and-paste
and on the test set of the real dataset. Lastly, 10,000 images     and rendered trained networks were able to recognise cer-
cut-and-paste images will be used to train a final network. As     tain classes, colors, and shapes of the real data at near per-
a baseline comparator, a score for a random label predictor is     fect rates, while others were not recognised at all. Second,
also given.                                                        all classifiers seemed to be more color sensitive than shape
   To further enhance understanding of dataset fallacies, F1       sensitive, as average ’relaxed on shape’ scores were always
scores are also calculated per brick class, color, or shape. For   higher than ’relaxed on color’ scores. Lastly, Figure 16 indi-
example, while an average F1 score on all images may give          cates that for these datasets, F1 accuracy does not decrease
an overview of the overall performance, average F1 scores          when more bricks are present in an image.
for each brick shape may reveal that 2 by 4 bricks are most
often misclassified. Additionaly, we present F1 scores that
are ’relaxed’ on shape or color. A classifier that is ”relaxed
on shape” may output a brick of the right color but of the
wrong shape, but it will still be counted as a true positive.
Similarly, ”relaxed on color” means a wrong color but a right
shape will result in a true positive.
   We use PyTorch’s implementation of ResNet-50 as it is
most popular and using a BCEWithLogitsLoss [32] and a
threshold, we convert it to multi-label classification. We shuf-                              (a) Real3000
fle each dataset and subdivide them into a test (10%), val-
idation (10%) and training (80%) set. For the real dataset,
a second test (Real3000s) is run wherein both the validation
and test set were selected to contain unseen combinations or
backgrounds. Each dataset is trained for 100 epochs using
ResNet-50, with a learning rate of 0.1, batch size 16. Images
are also resized to 384*256 to speed up training. A thresh-
old of 0.5 is used for classification. Full details can be found
at [25]. The networks are tested on their respective training                                (b) Real3000s
types and additionally tested on 3000 real test images. Note
that the rendered data contains only 83 possible classes due       Figure 8: The training loss and macro-average F1 accuracy of the
to 2 3D models not being available, hence the real test set for    real dataset compared with random test and validation set and se-
these networks do not contain any instances of these classes.      lected test and validation set, which contain unseen background and
The F1 accuracy is calculated according to formulas (1-5).         combinations.
The results can be seen in Table 1.

5   Results                                                        5.1   How do speedups in traditional data collection
                                                                         affect performance?
     Dataset type   Test Real Test Rel. on shape Rel. on color     Table 1 indicates that when trained on Real3000 F1 accuracy
      Real3000      896    N/A          901           898          is around 0.9, but this accuracy is skewed: a handpicked test-
      Real3000s     192    N/A          297           275          set that contains pictures with completely new combinations
    Rendered3000    804    340          468           453          and backgrounds performs worse. Moreover, the loss and
    Rendered5000    905    406          512           484          accuracy rates during training in Figure 8 indicates that the
       CP3000       851    374          486           480          classifier is not able to learn features of a handpicked val-
       CP5000       926    447          550           558          idation set, but can learn features of a randomized valida-
       CP10k        955    440          555           551          tion set. A possible explanation for this phenomenon is as
                                                                   follows. The speedups that were used to create the dataset
         Table 1: F1 scores for all datasets, scaled by 103        causes some bricks to appear together frequently. A combi-
                                                                   nation of bricks appears together three times, and while the
   The results show that for the synthetic data trained net-       camera angle changes and the bricks are shuffled around, the
works are able to sufficiently learn their respective dataset.     background remains the same. This may cause the classifier
However, the Real3000s dataset which contains selected val-        to associate backgrounds with certain combinations of bricks,
idation and test sets does not seem to approach the same F1        and thus overfit. Furthermore, since a combination of bricks
accuracy as the other networks. Further inspection of the loss     is turned into another combination by simply removing or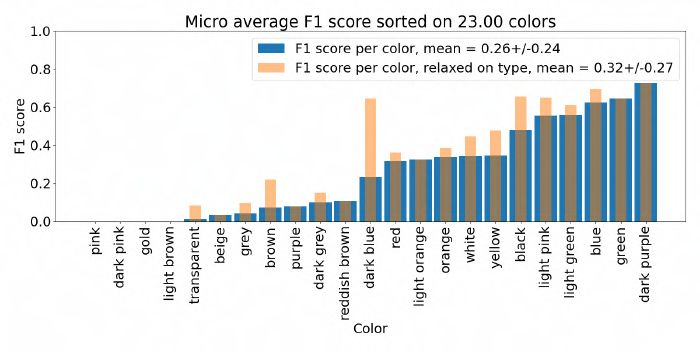
adding a brick, and this may be done up to 10 times, again
certain bricks appear together more frequently. This further
causes the model to overfit on brick combinations. These
two types of imbalances in the dataset could explain why the
model performs relatively well on a random validation and
test set; the classification problem is reduced to recognizing
the combination and background used, after which a predic-
tion of this combination will yield an F1 score comparable to
training data. See Figure 9.

                                                                                              (a) Rendered5000

Figure 9: While both images contain different arrangements of
bricks from different angles, the combination remains the same.
This could explain why a network is able to recognize a random-
ized test set, but not one containing unseen combinations.

   When tested on combinations and backgrounds it has never
                                                                                                  (b) CP5000
seen before, the model cannot identify most bricks. Figure 10
shows that in this test set, few classes receive F1 scores be-        Figure 11: Micro average F1 score per class. Note how rendered
tween 0.6 and 0.8, but many rates are much lower than that.           data is misclassifies a larger portion of classes than cut-and-paste
This could be an indication that the model only needs to iden-        data, possibly indicating a larger domain shift.
tify a few bricks in a picture to predict a combination.

                                                                         Cut-and-paste data exhibits similar behaviour to rendered
                                                                      data, in that by Figure 13, there are varying F1 rates for dif-
                                                                      ferent classes, indicating that the domain shift affects some
                                                                      bricks more than others. Furthermore, Figure 14 indicates
                                                                      that certain colors such as grey and beige are recognized at
                                                                      low rates across all cut-and-paste datasets, whereas dark pink
                                                                      and dark purple are consistently in the top 3 most recognized
                                                                      classes, possibly indicating that standout colors are recog-
                                                                      nized easier. This trend is also present in shapes as per Figure
                                                                      15. Lastly, it appears that for this problem, 10k images do
                                                                      not translate to better recognition of real data, as no improve-
                                                                      ments were made in any regard.
Figure 10: Micro average F1 score per class: Real3000s. While
some classes are recognized at training rates, most classes are not
recognized at all.                                                    6     Discussion
                                                                      Results indicate that although synthetic data can be used to
                                                                      train real data classifiers, more adjustments to the data will
5.2   How do the different methods of data                            have to be made before rates approach rates of tests on syn-
      generation compare in domain?                                   thetic data. Some classes are more sensitive to this domain
The networks trained on rendered data achieve F1 rates of be-         shift than others, and further investigation into why this is
tween 0.8 and 0.9 on test set, comparable to training rates.          might prove useful in further understanding of classification
When looking at Figure 13 it appears classes in the real              networks. Lastly, with all datasets, it appears that the number
dataset are recognized at varying F1 rates, from 0 to 0.9 or          of bricks per image does not affect F1 scores. It remains to
even 0.95. This indicates that the domain is greater for some         be investigated whether this trend upholds with significantly
bricks than others. Compared to cut-and-paste data, a larger          more bricks per image as increased truncation and occlusion
portion of classes do not get recognised at all and the over-         might increase error rates.
all macro-average F1 score is lower, namely 0.29 compared
to 0.42 for 5000 images, as shown in Figure 11. This trend            6.1    Fallacies
upholds in for colors and shapes in Figure 14 and Figure 15,          We suspect the real data collection method suffers primarily
though in the latter the difference is smaller.                       from a lack of diverse data. Although performance is known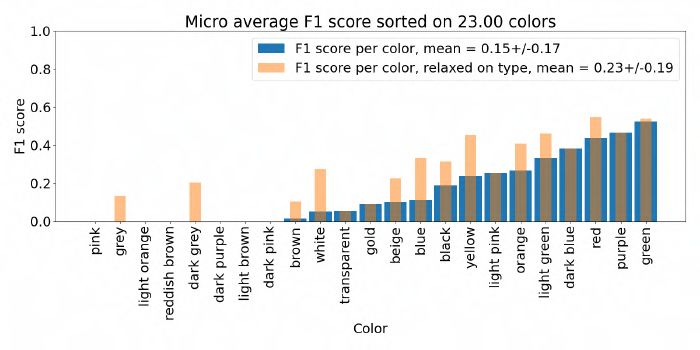
to suffer under multi-label classification [21], results from Ta-       blending, for it increases the efficiency by which new images
ble 1 indicate that at least for synthetically generated data, F1       can be photoshopped into scenes. Lastly, a drawback as seen
scores of up to 0.955 can be attained. If this translates to real       in Figure 6d is that rotation causes bounding boxes to not
data, we suspect that this decrease in performance is caused            tightly fit. This could be removed by switching from an alpha
by lack of diversity in the data. Speedups used to collect this         channel to a layer mask, though this would increase bound-
data reduce the variation in background and appearance of               ary artifacts. Alternatively, oriented bounding box annotation
different combinations of bricks. To combat this, more im-              could be used [33].
ages would need to be created so that networks better learn to
categorize individual bricks in different surroundings, or no           6.2    Ethics and Reproducibility
speedups should be implemented to make data more diverse.
A lack of data is a common problem for most computer vi-                Besides the annotation of the real data which was done
sion applications as data creation and annotation are massive           through crowdsourcing [29], there are no large ethical con-
and costly undertakings [6]. For practical applications, such           cerns as no human interaction was needed for the completion
as checking if a LEGO brick is present in a pile of bricks,             of the data collection.
we suspect traditional dataset collection methods may not be               In light of a ongoing reproducibility crisis in the scientific
sufficient. Although collecting data for such large piles would         community [34], we will shortly discuss the reproducibility
not be much harder than for 1-13 bricks, due to the amount of           of this research. All synthetic data creation protocols, as
occlusions, truncation, and sheer number of different LEGO              well as the ResNet-50 classifier are available for use on Git-
bricks, annotation would be prone to error, not to mention              lab [35–37]. All created datasets are available on TU Delft’s
costly and time consuming. For testing for such purposes we             WebDrive. In case the real dataset is to be replicated, it
recommend using a synthetic dataset.                                    should be noted that any pictures taken may produce some-
   Synthetic datasets are known to suffer from bridging the             what different results than the current datasets: while light-
gap to reality, and techniques such as domain randomiza-                ing, background, camera angle, camera zoom, and brick ori-
tion [4] and structured domain randomization [2] are aimed              entation were randomized, they were not controlled. These
especially at solving this. Although some domain randomiza-             factors may differ slightly between datasets. The cut-and-
tion is applied to the rendered dataset, more variation in light-       paste data suffers from these same random factors: different
ing intensity and color might produce better results, as not all        backgrounds and different brick orientations in cut-outs may
colors were recognized at equal rates per Figure 13. The re-            produce different dataset characteristics. The rendered data
sults show that shapes are also recognized at varying rates,            may differ in textures used for backgrounds and different 3D
possibly indicating that some 3D models were not accurate               models. Lastly, all classification scores present in section 6
representations of their real life counterparts an example of           and appendix A are taken from a single test run and may dif-
which is shown in Figure 12. It should be noted that the nature         fer from run to run.
of the LEGO classifying problem might hinder domain ran-
domization, as domain randomization depends on random-
izing textures and thus brick colors, an essential feature for          7     Conclusion and Future Work
distinguishing bricks. The cut-and-paste dataset suffers least
                                                                        We presented 3 novel datasets for computer vision purposes
                                                                        on multi-label images of LEGO bricks. After, we investi-
                                                                        gated the domain shift between these datasets by comparing
                                                                        F1 scores of a ResNet-50 classifier. Lastly, we investigated
                                                                        the use of speedups in traditional data collection. We find
                                                                        that networks trained on synthetic data are able to achieve
                                                                        F1 scores of 0.804 to 0.955, but these scores drop to 0.340
                                                                        to 0.447 depending on the type and amount of synthetic data
                                                                        used. The use of speedups during traditional data collection
                                                                        appears to make real data prone to overfitting.
                                                                           For future works, we do not consider improvements to net-
Figure 12: A faulty 3D brick model. Connective parts on the bot-        works as this is not the focus of the research, rather we recom-
tom are missing and the texture is slightly off, possibly hindering a   mend to further remove fallacies in data creation protocols.
domain shift.                                                           To further improve rendered data generation, we recommend
                                                                        using improved domain randomization. Using more detailed
from a lack of data and instinctively less of the domain shift          3D models and textures, as well as varying lighting conditions
than rendered data, however, other fallacies arise. A lack              more and randomly placing distractor objects could improve
of 3D-orientation coverage of bricks may cause the network              the domain shift. For cut-and-paste data, we suspect improv-
to overfit on certain viewpoints, and pasted images may not             ing bounding boxes as well as 3D orientation coverage would
blend seamlessly into scenes. To better these results, a more           increase scores the most. Finally, to prevent overfitting in the
diverse 3D coverage should be made and Poisson blending                 real dataset, additional data should be made with more em-
must be applied. Furthermore, edge detection using neural               phasis variation of backgrounds and brick combinations in
networks could further improve both 3D coverage as well as              pictures.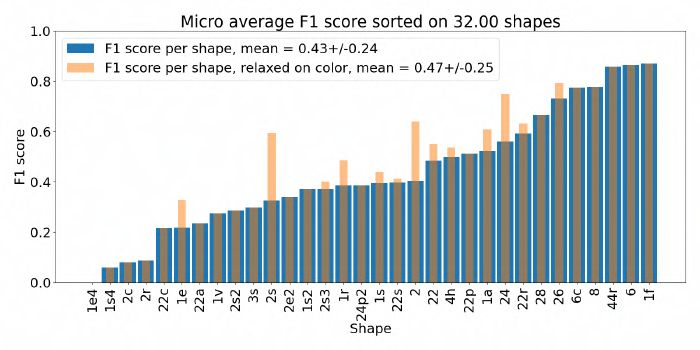
References                                                              from road surfaces,” in 2019 IEEE/CVF Conference on
[1] M. Braun, S. Krebs, F. Flohr, and D. M. Gavrila, “The               Computer Vision and Pattern Recognition Workshops
     eurocity persons dataset: A novel benchmark for object             (CVPRW), pp. 1277–1285, 2019.
     detection,” CoRR, vol. abs/1805.07193, 2018.                [17]   S. F. Dodge and L. J. Karam, “Understanding how
[2] A. Prakash, S. Boochoon, M. Brophy, D. Acuna,                       image quality affects deep neural networks,” CoRR,
     E. Cameracci, G. State, O. Shapira, and S. Birch-                  vol. abs/1604.04004, 2016.
     field, “Structured domain randomization: Bridging the       [18]   A. Singh, J. Sha, K. S. Narayan, T. Achim, and
     reality gap by context-aware synthetic data,” CoRR,                P. Abbeel, “Bigbird: A large-scale 3d database of object
     vol. abs/1810.10093, 2018.                                         instances,” in 2014 IEEE International Conference on
[3] T. Lin, M. Maire, S. J. Belongie, L. D. Bourdev, R. B.              Robotics and Automation (ICRA), pp. 509–516, 2014.
     Girshick, J. Hays, P. Perona, D. Ramanan, P. Dollár, and   [19]   M. Everingham, L. Van Gool, C. K. I. Williams,
     C. L. Zitnick, “Microsoft COCO: common objects in                  J. Winn, and A. Zisserman, “The pascal visual object
     context,” CoRR, vol. abs/1405.0312, 2014.                          classes (voc) challenge,” International Journal of Com-
[4] J. Tremblay, A. Prakash, D. Acuna, M. Brophy, V. Jam-               puter Vision, vol. 88, no. 2, pp. 303–338, 2010.
     pani, C. Anil, T. To, E. Cameracci, S. Boochoon, and        [20]   S. Ren, K. He, R. Girshick, and J. Sun, “Faster r-cnn:
     S. Birchfield, “Training deep networks with synthetic              Towards real-time object detection with region proposal
     data: Bridging the reality gap by domain randomiza-                networks,” 2015.
     tion,” CoRR, vol. abs/1804.06516, 2018.                     [21]   J. Wang, Y. Yang, J. Mao, Z. Huang, C. Huang, and
[5] D. Dwibedi, I. Misra, and M. Hebert, “Cut, paste and                W. Xu, “CNN-RNN: A unified framework for multi-
     learn: Surprisingly easy synthesis for instance detec-             label image classification,” CoRR, vol. abs/1604.04573,
     tion,” CoRR, vol. abs/1708.01642, 2017.                            2016.
[6] Y. Roh, G. Heo, and S. E. Whang, “A survey on data           [22]   H. Jung, M. Choi, J. Jung, J. Lee, S. Kwon, and W. Y.
     collection for machine learning: a big data - AI integra-          Jung, “Resnet-based vehicle classification and localiza-
     tion perspective,” CoRR, vol. abs/1811.03402, 2018.                tion in traffic surveillance systems,” in 2017 IEEE Con-
[7] H. Garcia-Molina, M. Joglekar, A. Marcus,                           ference on Computer Vision and Pattern Recognition
     A. Parameswaran, and V. Verroios, “Challenges in                   Workshops (CVPRW), pp. 934–940, 2017.
     data crowdsourcing,” IEEE Transactions on Knowledge         [23]   S. Xie, R. B. Girshick, P. Dollár, Z. Tu, and K. He, “Ag-
     and Data Engineering, vol. 28, no. 4, pp. 901–911,                 gregated residual transformations for deep neural net-
     2016.                                                              works,” CoRR, vol. abs/1611.05431, 2016.
[8] N. Patki, R. Wedge, and K. Veeramachaneni, “The syn-         [24]   S. Zagoruyko and N. Komodakis, “Wide residual net-
     thetic data vault,” in 2016 IEEE International Confer-             works,” CoRR, vol. abs/1605.07146, 2016.
     ence on Data Science and Advanced Analytics (DSAA),         [25]   N. Tahur, “The current state of the art in image classi-
     pp. 399–410, 2016.                                                 fication applied on multi-label images of lego bricks,”
[9] S. Gurumurthy, R. K. Sarvadevabhatla, and V. B.                     2020.
     Radhakrishnan, “Deligan : Generative adversar-              [26]   N. Japkowicz et al., “Learning from imbalanced data
     ial networks for diverse and limited data,” CoRR,                  sets: a comparison of various strategies,” in AAAI work-
     vol. abs/1706.02071, 2017.                                         shop on learning from imbalanced data sets, vol. 68,
[10] K. Quach, “You looking for an ai project? you love                 pp. 10–15, Menlo Park, CA, 2000.
     lego? look no further than this reg reader’s machine-       [27]   “Summary and statistics.” http://image-net.org/
     learning lego sorter,” Dec 2019.                                   about-stats. Accessed: 2020-05-30.
[11] D. West, “How i created over 100,000 labeled lego train-    [28]   O. Kwon and J. M. Sim, “Effects of data set features
     ing images,” Mar 2019.                                             on the performances of classification algorithms,” Sep
[12] C. ZEH and S. BABOVIC, “Lego sorting tool,” 1957.                  2012.
[13] “shutterstock.” https://www.shutterstock.com/.              [29]   R. Oltmans, A. Lengyel, and J. van Gemert, “Optimal
                                                                        methods for crowdsourcing image annotation of multi-
[14] L. Perez and J. Wang, “The effectiveness of data aug-
                                                                        ple lego’s,” 2020.
     mentation in image classification using deep learning,”
     CoRR, vol. abs/1712.04621, 2017.                            [30]   “rebrickable.” https://rebrickable.com/.
[15] Y. Xu, R. Jia, L. Mou, G. Li, Y. Chen, Y. Lu, and           [31]   K. Nooney, “Deep dive into multi-label classification..!
     Z. Jin, “Improved relation classification by deep recur-           (with detailed case study),” Feb 2019.
     rent neural networks with data augmentation,” CoRR,         [32]   “Pytorch.” https://pytorch.org/docs/master/generated/
     vol. abs/1601.03651, 2016.                                         torch.nn.BCEWithLogitsLoss.html.
[16] B. A. Maxwell, C. A. Smith, M. Qraitem, R. Mess-            [33]   J. O. du Terrail and F. Jurie, “Faster RER-CNN: applica-
     ing, S. Whitt, N. Thien, and R. M. Friedhoff, “Real-               tion to the detection of vehicles in aerial images,” CoRR,
     time physics-based removal of shadows and shading                  vol. abs/1809.07628, 2018.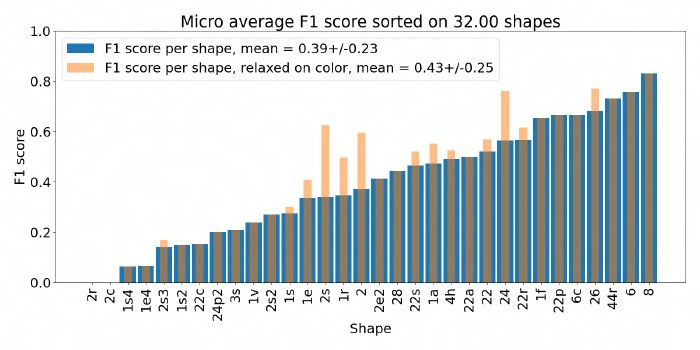
[34] M. Baker, “Is there a reproducibility crisis?,” Nature,
     vol. 533, pp. 452–454, 05 2016.
[35] B. Kam, A. Lengyel, and J. van Gemert, “Lego
     data collection.” https://gitlab.com/lego-project-group/
     lego-data-collection, 2020.
[36] B. Kam, R. Oltmans, H. Abderrazik, N. Tahur, D. Cian,
     A. Lengyel, and J. van Gemert, “Synthetic lego genera-
     tion.” https://gitlab.com/lego-project-group/lego, 2020.
[37] N. Tahur, A. Lengyel, and J. van Gemert, “Imageclass.”
     https://gitlab.com/lego-project-group/ImageClass,
     2020.
A Results
(a) Real3000s (b) Rendered3000
(c) Rendered5000 (d) CP3000
(e) CP5000 (f) CP10k
Figure 13: Micro average F1 score per class(a) Real3000s (b) Rendered3000
(c) Rendered5000 (d) CP3000
(e) CP5000 (f) CP10k
Figure 14: Micro average F1 score per color(a) Real3000s (b) Rendered3000
(c) Rendered5000 (d) CP3000
(e) CP5000 (f) CP10k
Figure 15: Micro average F1 score per shape(a) Real3000s (b) Rendered3000
(c) Rendered5000 (d) CP3000
(e) CP5000 (f) CP10k
Figure 16: Micro average F1 score sorted on bricks per imageYou can also read