Tourism Satellite Accounts - in Europe 2019 edition - Europa EU
←
→
Page content transcription
If your browser does not render page correctly, please read the page content below

Tourism Satellite Accounts
                 in Europe                 2019 edition

                    S TAT I S T I C A L
                      N GR EPPAOP R
                                  E RT S
Tourism Satellite Accounts
                  in Europe 2019 edition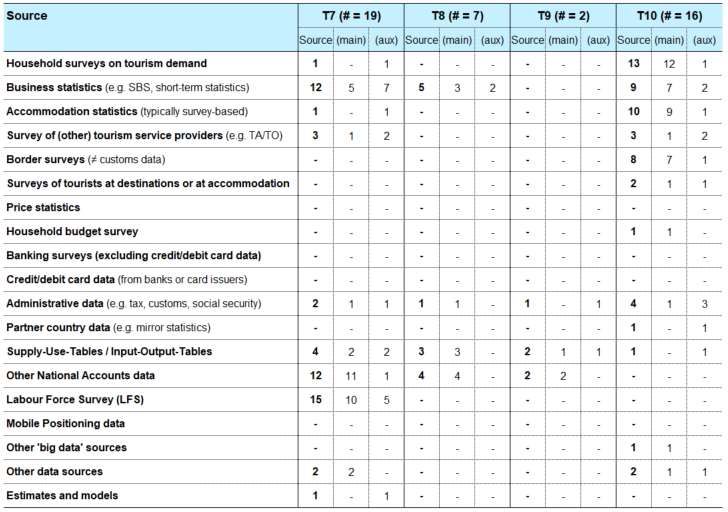
Printed by the Publication Office in Luxembourg

Manuscript completed in November 2019

Neither the European Commission nor any person acting on behalf of the Commission is responsible for
the use that might be made of the following information.

Luxembourg: Publications Office of the European Union, 2019

© European Union, 2019
Reuse is authorised provided the source is acknowledged.
The reuse policy of European Commission documents is regulated by Decision 2011/833/EU (OJ L 330,
14.12.2011, p. 39).

Copyright for the cover picture: © Christophe Demunter

For any use or reproduction of photos or other material that is not under the EU copyright, permission
must be sought directly from the copyright holders.
For more information, please consult: https://ec.europa.eu/eurostat/about/policies/copyright

The information and views set out in this publication are those of the authors and do not necessarily
reflect the official opinion of the European Union. Neither the European Union institutions and bodies nor
any person acting on their behalf may be held responsible for the use which may be made of the
information contained therein.

Collection:     Statistical reports
Theme:          Industry, trade and services

PDF       ISBN 978-92-76-12188-6 ISSN 2529-3222          doi: 10.2785/78529 KS-FT-19-007-EN-N
Print     ISBN 978-92-76-14125-9 ISSN 2529-5233          doi: 10.2785/325928 KS-FT-19-007-EN-C
Contents

Introduction................................................................................................................. 4
Main findings............................................................................................................... 5
    Coverage and methodology......................................................................................................... 5
    Analysis ......................................................................................................................................... 6

Background and introductory comments on the data ............................................. 7
    History............................................................................................................................................ 7
    Scope and coverage ..................................................................................................................... 7
    Governance ................................................................................................................................. 10
    Data sources for TSA compilation ............................................................................................ 10

The demand side: How much do visitors spend? .................................................. 11
    Overnight visitors (tourists) account for 90 % of the inbound tourism expenditure ........... 11
    Nearly half of the domestic tourism expenditure is linked to same-day visits ..................... 15
    Domestic tourism expenditure 1.8 times higher than inbound tourism expenditure .......... 17
    Outbound tourism expenditure in the EU approaches an estimated 300 billion euro, but
    relatively few countries compile this information ................................................................... 20

The supply side: How much does tourism contribute to the national economy? 22
    Tourism generates 4 million jobs in Italy ................................................................................. 24

Tourism gross fixed capital formation and collective consumption ..................... 25
Non-monetary data ................................................................................................... 26
Annex I — List of indicators in the questionnaire .................................................. 28
Annex II — Data sources for TSA tables ................................................................. 30
Annex III — List of links to national TSAs ............................................................... 33
Annex IV — Methodological notes .......................................................................... 34

   Tourism Satellite Accounts (TSA) in Europe (2019 edition)                                                                                                3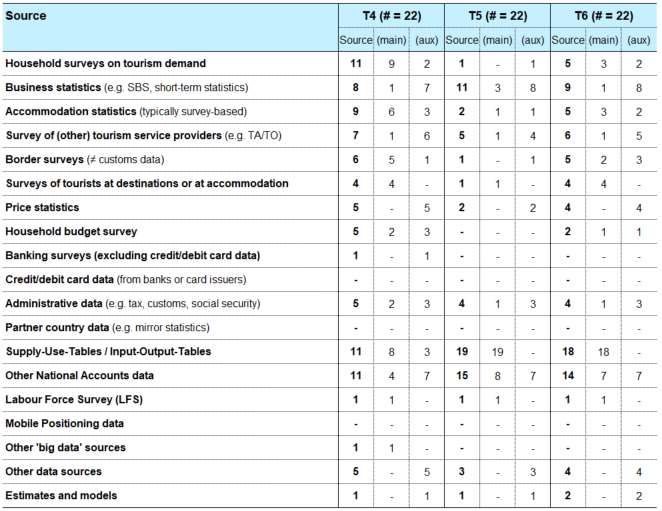
Main findings   2

                                               Introduction

Tourism plays an important role in many countries’ economies. This is certainly the case in the
European Union, which is still the world’s number one tourist destination. For a large number of EU
Member States, tourism has been a significant driver of the national economy and labour market
during the recent recession. It contributes not only to the economic development of countries and
regions, but also to their social and cultural development and general well-being.
Most European countries have a well-established system of statistics to track tourism demand in
terms of domestic and outbound trips, tourist accommodation and tourist expenditure. Whilst such
statistics are highly relevant, they don’t measure the overall contribution of tourism to the economy.
To this end, the World Tourism Organisation (UNWTO), the United Nations Statistics Division
(UNSD), the Organisation for Economic Cooperation and Development (OECD) and the Statistical
Office of the European Union (Eurostat) developed a harmonised system of tourism satellite
accounts (TSA)(1). It uses the same concepts, definitions and classifications as national accounts
and is the internationally recognised framework for measuring tourist activity and the importance of
tourism to national or regional economies. While traditional tourism statistics focus primarily on
‘flows’ (number of visitors, number of overnight stays etc.), TSA can tell us how much tourism
contributes to an economy and how many jobs it creates.
Since 2000, the European Commission has launched a number of initiatives to encourage Member
States to compile TSA. The Directorate-General for Internal Market, Industry, Entrepreneurship and
SMEs (DG GROW) conducted three rounds of grants. Subsequently, Eurostat coordinated a two-
year project(2) in 2008-09. In 2017(3) an, international workshops gathering TSA experts and users
was organised in Brussels (jointly with UNWTO), followed by a workshop for TSA experts in
Luxembourg in 2018. In 2019, Eurostat included for the first time a two days course on TSA in the
European Statistics Training Programme (ESTP). Since 2010, the Member States and EFTA
countries submit every three years available TSA data to Eurostat (2010, 2013, 2016 and 2019).
This report presents an analysis of the data gathered in 2019 and is a follow-up to the 2016 edition of
Tourism Satellite Accounts (TSA) in Europe(4). At this stage of development, national methodologies
are not sufficiently harmonised for the data to be fully comparably across countries. However, even
lacking the quality of official statistics, the results give useful insights about the state-of-affairs of TSA
implementation and about EU and national level estimates of the economic dimension of tourism.
Eurostat would like to thank all the national authorities that contributed to this publication. Special
thanks go out to Pavel Vančura and Zdeněk Lejsek (Czech Statistical Office) and Peter Laimer
(Statistics Austria), who kindly agreed to assess and analyse the data.

(1) 2008 Tourism Satellite Account: Recommended Methodological Framework (TSA:RMF 2008); United Nations Statistics Division
    (UNSD), Statistical Office of the European Communities (Eurostat), Organisation for Economic Cooperation and Development (OECD)
    and World Tourism Organisation (UNWTO). The document is available on the Eurostat website (see footnote 1).
(2) For more information, see http://ec.europa.eu/eurostat/web/tourism/methodology/projects-and-studies.
(3) http://statistics.unwto.org/event/DG_Grow_WS
(4) https://ec.europa.eu/eurostat/web/products-statistical-reports/-/KS-FT-17-002

   Tourism Satellite Accounts (TSA) in Europe (2019 edition)                                                                            4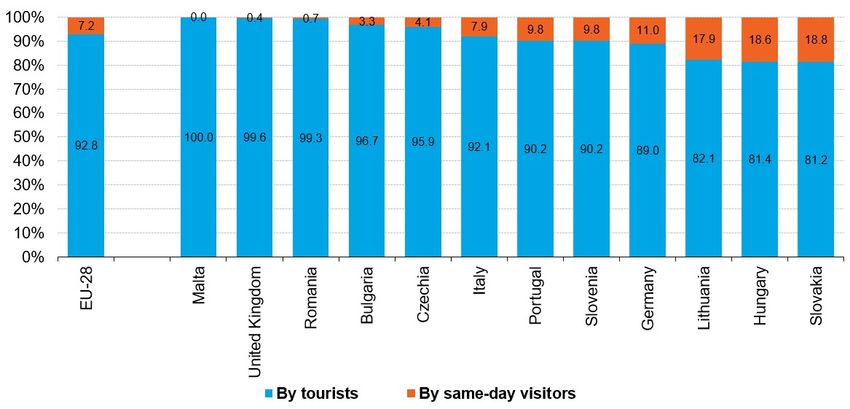
Main findings   2

                                   Main findings

The objective of this report is twofold: to take stock of the state-of-affairs regarding TSA
implementation across Europe, and to compile a limited set of TSA indicators allowing analysing
European tourism in a macroeconomic framework.

Coverage and methodology
Since 2010, Eurostat invites the Member States every three years to transmit the available national
TSA data, using a pre-defined template (the list of indicators in the questionnaire is available in
Annex I). The current paper is based on the results of the most recent exercise, which took place in
2019 and in which 27 European countries participated (25 Member States and 2 EFTA countries).
The 25 Member States account for 98.5 % of tourism activity in Europe in terms of trips made by
residents and 98.2 % in terms of overnight stays in tourist accommodation (see Table 1). Compared
with the previous edition (2016), more countries participated — in particular some larger countries
such as Germany, Italy and the UK are now included. This allows producing not only national data
but also meaningful and sufficiently representative results for the EU as a whole.
The internationally accepted TSA framework, the 2008 Tourism Satellite Account: Recommended
Methodological Framework (TSA:RMF 2008), was jointly developed by the United Nations Statistics
Division, Eurostat, the OECD and the UN World Tourism Organisation, and consists of 10 tables.
However, coverage of these tables varied widely across the participating countries. The tables
relating to the demand side and supply side are relatively complete (Tables 1 to 6 of the TSA
system), but less than half of the requested information was available for the table on employment
(Table 7). The indicators on gross fixed capital formation and collective consumption were only
sparsely covered (Tables 8 and 9). Table 10 comprises primary tourism statistics that help to put the
macroeconomic data into perspective. Future actions on TSA should focus on broadening TSA
coverage by including more countries and deepening it by introducing more tables and variables
from the TSA:RMF 2008.
The key challenge, however, is to improve the harmonisation of TSA compilation across Europe.
Different degrees of adherence to TSA:RMF 2008 affects the comparability. Due to limitations of the
data sources, a significant number of indicators differs slightly from the recommendations, or were
not available. A second factor affecting comparability is the range of reference years (see Table 3).
However, given that TSA are a tool for structural rather than short-term analysis, it is still meaningful
to compare indicators for the participating countries in terms of order of magnitude.

  Tourism Satellite Accounts (TSA) in Europe (2019 edition)                                                     5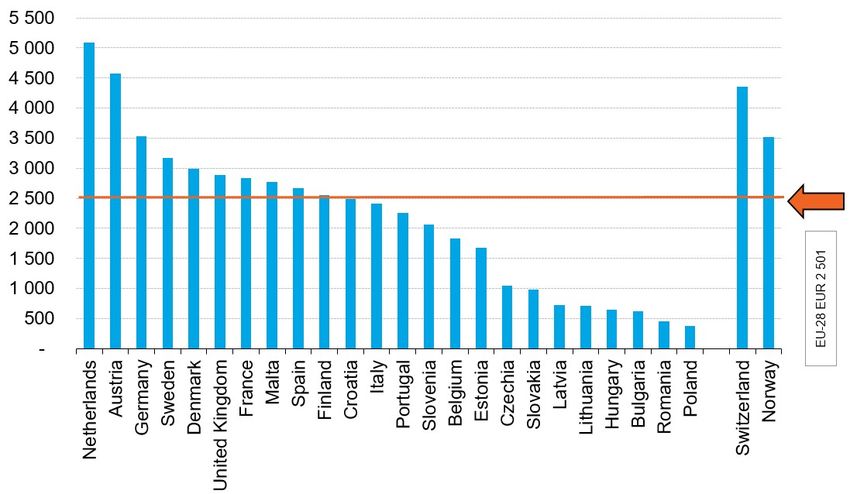
Main findings   2
Analysis
The analysis of the demand side (see Chapter 4) shows that domestic tourism accounted for 65 % of
internal tourism expenditure on average in the EU, and ‘inbound expenditure’ for 35 %. In 15 out of
the 27 countries for which data is available, inbound tourism expenditure was higher than domestic
tourism expenditure. The importance of domestic tourism in internal tourism expenditure ranged from
85 % in Germany to only 10 % in Malta.
Representing 54 % of domestic tourism expenditure and 90 % of inbound tourism expenditure on
average, overnight visitors were more important than same-day visitors for internal tourism
expenditure.
The analysis of the supply side is based on macroeconomic variables such as gross value added,
gross domestic product and internal consumption relating to tourism and how they compare with
totals for the overall economy. These variables are useful for gauging the importance of tourism for
the economy as a whole and compared with other economic activities (see Chapter 5).
The contribution of tourism to an economy can be expressed as a tourism ratio, i.e. the proportion of
total domestic supply accounted for by internal tourism consumption. The average tourism ratio in
the EU amounted to 3.3 %, i.e. domestic and inbound visitors consumed 3.3 % of the total output of
tourism and non-tourism industries. The ratio ranged from 1.5 % in Poland to 9.8 % in Croatia.
Tourism generated 16.5 million jobs in the 15 countries for which data was available. Italy recorded
the highest figures (4.2 million).

  Tourism Satellite Accounts (TSA) in Europe (2019 edition)                                                  6

Background and introductory comments on the data 3
Background and
introductory comments on
the data
This report presents results from the fourth round of TSA data collection in Europe (EU, EFTA and
candidate countries), Data was transmitted on a voluntary basis(5) to Eurostat in 2019.
History
The first TSA exercise took place in 2010, with 23 participating countries. Eurostat’s aim was to
collect readily available and voluntarily submitted TSA data from Member States, EFTA and
candidate countries at regular intervals but not each year. The next exercises took place in 2013 (22
countries) and 2016 (19 countries).
Scope and coverage
The indicators included in the reporting template (see Annex I) are a subset of the tables in the
TSA:RMF 2008 and focus on headline indicators and totals. The reporting template remained stable
for the four exercises, except an indicator on the number of persons employed was added (beyond
the TSA: RMF 2008 tables), as this was considered important to complete the picture of employment
in tourism.
It should be noted — especially when comparing and interpreting results — that the comparability of
the results is affected by methodological differences between national TSA and the TSA:RMF 2008,
different degrees of completeness, different levels of statistical ‘maturity’ (some figures are
preliminary, others come from pilot projects) and different reference years. To give data users a
clearer idea of data quality, explanatory notes on the tables and graphs are included where possible.
It is highly recommended that the user takes into account this metadata in the notes accompanying
the tables and graphs when analysing, comparing or interpreting results.
For the fourth TSA exercise in the EU, 27 countries provided data(6):
25 Member States (Belgium(7), Bulgaria, Czechia, Denmark, Germany, Estonia, Greece,
Spain, France, Croatia, Italy, Latvia, Lithuania, Hungary, Malta, the Netherlands, Austria,
Poland, Portugal, Romania, Slovenia, Slovakia, Finland, Sweden and the United Kingdom);
and
2 EFTA countries (Norway and Switzerland).
(5) The compilation and transmission of TSA data goes beyond the legal requirements for tourism statistics, as laid down in Regulation
(EU) No 692/2011 concerning European statistics on tourism, hence the voluntary nature of this data transmission.
(6) Greece provided data from a pilot study; this data is included in the EU28 aggregates but not printed at country level in this
publication. Ireland, Cyprus and Luxembourg did not submit data. However, Luxembourg plans publishing TSA data in the first half of
2020; Ireland and Cyprus are assessing the feasibility of compiling TSA. Turkey is currently also compiling TSA (to be published in the
near future).
(7) For the purpose of this paper, TSA for Belgium was kindly compiled by the Flemish Statistics Authority, based on regional TSA for
Flanders Region + Brussels-Capital Region, regional TSA for Wallonia and information from the Belgian interregional input-output
tables). This allowed to include national level data for Belgium (and to use a picture of the Belgian North Sea coast for the cover of this
publication!).
Tourism Satellite Accounts (TSA) in Europe (2019 edition) 7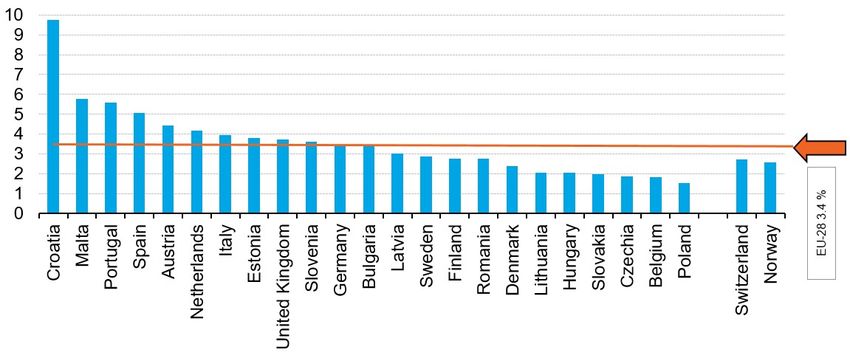
Background and introductory comments on the data               3
Table 1 indicates how many of the 50 indicators were transmitted by each of the countries (see
Annex I for the complete set of indicators). Coverage (which was partial in all cases, ranging from 18
to 46 indicators) also gives an indication of how complete the national TSA are. Table 1 also includes
some core tourism statistics to illustrate the representativeness of the participating countries when
estimating aggregates for the EU as a whole: the 25 Member States account for 98.2 % of all nights
spent in tourist accommodation establishments across the Union and 98.5 % of all tourism trips
made by EU residents.

Table 1: TSA transmission and number of indicators available, by country

                                                          Nights spent in tourist               Domestic + outbound
                                                          accommodation (2017)                   tourism trips (2017)
                                  Number of
                                  indicators                              Share of                                Share of
                                 transmitted             Number          EU-28 total           Number            EU-28 total
        Country                     (n=50)              (millions)          (%)               (millions)            (%)
EU-28                                                        3 058.1            100.0              1 255.3              100.0
Belgium                                18                         38.7               1.3               15.2                  1.2
Bulgaria                               39                         26.1               0.9                5.5                  0.4
Czechia                                44                         53.2               1.7               35.8                  2.9
Denmark                                35                         32.2               1.1               26.5                  2.1
Germany                                27                        401.2              13.1              243.6                 19.4
Estonia                                35                          6.5               0.2                4.6                  0.4
Ireland                                 -                         33.9               1.1               14.6                  1.2
Greece                                 22                        111.3               3.6                6.2                  0.5
Spain                                  41                        471.2              15.4              152.7                 12.2
France                                 35                        433.1              14.2              220.8                 17.6
Croatia                                21                         86.1               2.8                4.9                  0.4
Italy                                  40                        420.6              13.8               56.4                  4.5
Cyprus                                  -                         16.8               0.5                2.8                  0.2
Latvia                                 32                          5.0               0.2                4.2                  0.3
Lithuania                              41                          7.4               0.2                4.6                  0.4
Luxembourg                              -                          2.9               0.1                1.8                  0.1
Hungary                                43                         31.6               1.0               18.6                  1.5
Malta                                  26                          9.6               0.3                0.8                  0.1
Netherlands                            35                        111.7               3.7               45.1                  3.6
Austria                                39                        121.1               4.0               23.1                  1.8
Poland                                 36                         83.9               2.7               57.9                  4.6
Portugal                               27                         72.0               2.4               17.5                  1.4
Romania                                44                         26.9               0.9               17.9                  1.4
Slovenia                               39                         12.5               0.4                4.8                  0.4
Slovakia                               46                         14.7               0.5               11.0                  0.9
Finland                                34                         21.9               0.7               39.5                  3.1
Sweden                                 26                         58.7               1.9               59.6                  4.8
United Kingdom(¹)                      27                        347.5              11.4              159.4                 12.7
Norway                                 26                         33.3                 -               23.3                    -
Switzerland                            34                         53.3                 -               22.1                    -
Notes: Reference year for TSA data: 2010 (MT), 2013 (PL), 2014 (EE, FR, CH), 2015 (DE, EL, ES, IT), 2016 (BE, BG, HR, LV, LT, HU,
PT, RO, SK, FI, SE, UK, NO), 2017 (CZ, DK, AT, SI) and 2018 (NL).

(¹) 2013 data for tourism trips.
Source: Eurostat, Data collection on TSA 2019, Tourism statistics.

  Tourism Satellite Accounts (TSA) in Europe (2019 edition)                                                                         8
Background and introductory comments on the data 3
Table 2 shows the coverage of the selected indicators for the 10 TSA tables. TSA Tables 1 to 6 and
10 are relatively well covered. All 27 countries reported on ‘total internal tourism expenditure’
(included in TSA Table 4) and its two components ‘total inbound tourism expenditure’ (included in
TSA Table 1) and ‘total domestic tourism expenditure’ (included in TSA Table 2). For the core TSA
Table 6 (see below), 192 indicators were available in total from an attainable maximum of 216 (8
indicators per country adds up to 216 indicators for 27 countries), which gives a response rate, or
coverage, of 86 %.
For TSA Table 7 on employment — which users see as essential for analysing the tourism sector —
data availability was 46 %: 58 indicators were transmitted from an attainable maximum of 108 (four
indicators for 27 countries).
The least complete TSA tables are Tables 8 and 9, for which only eight countries (30 %) and two
countries (7 %), respectively, transmitted the single indicator requested. This reflects on the one
hand the complexity of compiling these tables and on the other hand the lower priority in terms of
user relevance given to these tables.
Table 2: Overview of coverage of TSA tables
Number of Availability in
Table indicators in participating
questionnaire countries (%)
TSA Table 1 Inbound tourism expenditure 3 85
TSA Table 2 Domestic tourism expenditure 3 84
TSA Table 3 Outbound tourism expenditure 3 58
TSA Table 4 Internal tourism consumption 5 95
TSA Table 5 Production accounts of tourism industries and other industries 3 100
TSA Table 6 Total domestic supply and internal tourism consumption 8 86
TSA Table 7 Employment in the tourism industries 4 46
TSA Table 8 Tourism gross fixed capital formation 1 30
TSA Table 9 Tourism collective consumption 1 7
TSA Table 10 Non-monetary indicators 19 53
Source: Eurostat, Data collection on TSA 2019.
The reference year for the data is not the same for each country (see Table 3). The Netherlands
provided information for 2018, four countries (Czechia, Denmark, Austria and Slovenia) for 2017, but
for most the data referred to 2016 (13 countries) or even before.
Table 3: Reference year for TSA data
Year Country
2018 NL
2017 CZ, DK, AT, SI
2016 BE, BG, HR, LV, LT, HU, PT, RO, SK, FI, SE, UK, NO
2015 DE, EL, ES, IT
2014 EE, FR, CH
2013 PL
2010 MT
Source: Eurostat, Data collection on TSA 2019.
Tourism Satellite Accounts (TSA) in Europe (2019 edition) 9Background and introductory comments on the data 3
Governance
Depending on how the statistical system is organised in a given country, various agencies can be
involved in compiling and disseminating official tourism statistics and the TSA. In most cases (22
countries), the national statistical institute (NSI) compiles the data. However, in some countries
another institution (see Table 4) produced the TSA.
Table 4: Institution responsible for compiling the TSA
Institution Country
BE(¹), BG, CZ, EE, ES, HR, IT, LV, LT, HU, MT, NL, AT, PT,
National statistical institute
RO, SI, SK, FI, SE, UK, NO, CH
Ministry competent for tourism DE, EL(2), FR, PL
National tourism board DK
(¹) TSA for Belgium was compiled by the Flemish Statistics Authority, on the basis of regional TSA for Flanders Region + Brussels-
Capital Region and regional TSA for Wallonia.
(2) Pilot project developed in the framework of the EU-funded project “Technical Assistance action to support tourism planning and
policy for the promotion of sustainable tourism development in Greece” of the Ministry of Tourism.
Source: Eurostat, Data collection on TSA 2019.
If the NSI is responsible for compiling the TSA, this is handled either by the unit dealing with tourism
statistics or by the unit in charge of national accounts (see Table 5). Both approaches have their
advantages. However, the most important thing is that tourism statisticians and national accountants
work closely together and pool their knowledge and experience.
Table 5: Unit within NSI responsible for compiling the TSA
Responsible unit in NSI Country
Tourism Statistics Unit BE, BG, CZ, EE, ES, LV, LT, HU, MT, AT, PT, RO, SK, FI, UK
National Accounts Unit HR, IT, NL, SI, SE, NO, CH
Source: Eurostat, Data collection on TSA 2019.
Data sources for TSA compilation
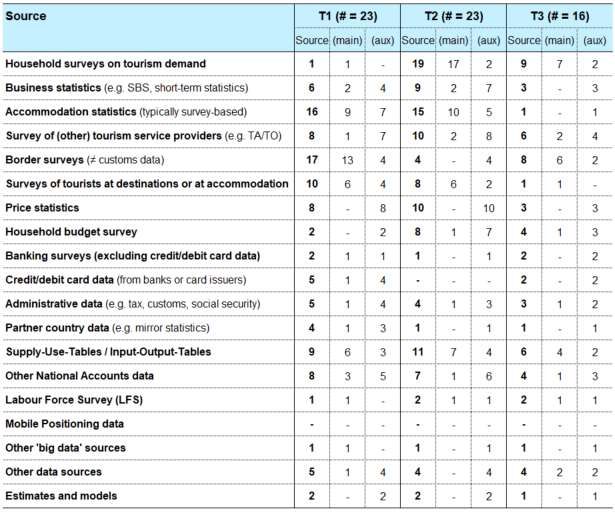
TSA compilers use a wide range of sources as input to the accounts. In the 2019 data collection,
compilers were asked to indicate for each of the TSA Tables the most relevant sources used, to be
selected from a pre-selected set of potential sources. The replies differentiated between ‘main
source’ and ‘auxiliary source’. Annex II includes the full overview. The most commonly cited sources
for the demand and supply information (TSA Tables 1 to 6) were data collected in the context of the
Regulation concerning European statistics, namely accommodation statistics (business surveys) and
tourism demand surveys (household surveys). Where available, countries also relied on border
surveys. Given the close link to national accounts, Supply-Use tables, Input-Output tables or (other)
information from National Accounts were often mentioned as essential building blocks. The data on
employment (TSA Table 7) generally includes information from the labour force survey and from
(structural) business statistics.
Tourism Satellite Accounts (TSA) in Europe (2019 edition) 10The demand side: How much do visitors spend? 4
The demand side: How
much do visitors spend?
The first four TSA tables contain demand-side data on expenditure by visitors (before and during
their trip) and tourism consumption. Tourism expenditure is divided into inbound, domestic and
outbound tourism in TSA Tables 1, 2 and 3 respectively. TSA Table 4 focuses on internal tourism
consumption, summarising inbound and domestic tourism expenditure, but also covering other
components of consumption.
Tourism consumption is more or less the same as tourism expenditure, albeit a little broader in
scope. Apart from expenditure, consumption also covers among other elements such as the imputed
rent of holiday homes or services paid by non-profit institutions for trips made by, for instance,
groups of disabled people.
Overnight visitors (tourists) account for
90 % of the inbound tourism expenditure
Table 6 on the next page (TSA Table 1) shows inbound tourism expenditure in the country visited.
These results are available for all 27 countries (the split between expenditure by overnight tourists
and same-day visitors, however, is only available for 21 countries).
France recorded the highest value: EUR 64 221 million or 16 % of the EU total tourism expenditure
(note that data for different countries is based on a wider range of reference years and therefore not
fully comparably in absolute values, see Table 3). Spain came second (EUR 59 213 million), followed
by Italy (EUR 48 148 million), Germany (EUR 39 555 million), the Netherlands (EUR 32 490 million)
and the United Kingdom (EUR 31 650 million). These six countries accounted for 68 % of total
inbound tourism expenditure in the EU (see also Figure 1).
Tourism Satellite Accounts (TSA) in Europe (2019 edition) 11The demand side: How much do visitors spend? 4
Table 6: Inbound tourism expenditure (TSA Table 1)
Expenditure
Country (Million EUR)
Total By overnight visitors By same-day visitors
EU-28 405 000 365 000 40 000
Belgium 5 203 : :
Bulgaria 3 744 3 200 544
Czechia(¹) 6 263 4 555 1 708
Denmark 7 366 6 584 782
Germany(²) 39 555 36 833 2 722
Estonia(³) 1 675 1 279 396
Ireland : : :
Greece : : :
Spain 59 213 : :
France(⁴) 64 221 : :
Croatia(⁵) 8 823 8 304 519
Italy 48 148 44 815 3 334
Cyprus : : :
Latvia 1 030 649 381
Lithuania 1 225 930 295
Luxembourg : : :
Hungary 4 147 3 869 278
Malta 1 033 1 021 12
Netherlands 32 490 : :
Austria 20 434 17 159 3 275
Poland 8 446 4 863 3 583
Portugal 14 713 14 257 455
Romania(⁶) 1 474 1 324 150
Slovenia 2 947 1 393 1 554
Slovakia(⁷) 2 465 1 833 632
Finland(⁸) 3 599 3 027 572
Sweden 12 649 : :
United Kingdom(⁹) 31 650 30 994 657
Norway(10) 5 404 : :
Switzerland 14 411 12 453 1 958
Notes: EU-28 aggregate estimated for this publication using available data. The results on average expenditure were not available
for all countries mainly due to missing data on the number of visitors (physical data). Reference year for TSA data: See Table 3.
(¹) Same-day visitors include transits which accounted for 787.8 million EUR.
(²) Including expenditure on personal and business trips.
(³) Expenditures of seasonal/border workers, exports of educational/medical services are excluded.
(⁴) Year 2017; Source: DGE, CST, base 2014.
(⁵) Estimation by the Institute for Tourism using various data sources (bottom up method).
(⁶) For same-day visitors information by neighbours countries used.
(⁷) Same-day visitors include transit visitors.
(⁸) Some degree of overestimation in inbound tourism expenditure as it is equivalent to travel receipts in the BOP.
(⁹) Fare expenditure relates to travel within the UK and fares on inbound travel on UK carriers. Sources: ONS International
Passenger Survey, ONS Input Output Supply and Use Tables.
(10) Estimated rents for vacation homes are included. Expenditures on valuables are not included. Travelers not being visitors are
included (balance of payment is used).
Source: Eurostat, Data collection on TSA 2019.
Tourism Satellite Accounts (TSA) in Europe (2019 edition) 12The demand side: How much do visitors spend? 4 Figure 1: Inbound tourism expenditure — top countries (% share in EU-28 total) Source: Eurostat, Data collection on TSA 2019. Figure 2 gives an overview of the countries’ average share of total inbound tourism expenditure accounted for by overnight tourists (as opposed to same-day visitors’ inbound tourism expenditure). At EU level, this share was 90 %, an estimate based on data from the 20 Member States who were able to distinguish by type of visitor. The highest percentage was reported by Malta (99 %), the United Kingdom (98 %) and Portugal (97 %). By contrast, Slovenia recorded the lowest share (47 %), because of the large number of same-day transit trips through the country contributing to the inbound tourism expenditure. Figure 2: Proportion of total inbound tourism expenditure accounted for by overnight tourists (%) Notes: EU-28 aggregate estimated for this publication using available data. No data available for BE, IE, ES, FR, CY, LU, NL and SE. Reference year for the data: See Table 3. Source: Eurostat, Data collection on TSA 2019. Tourism Satellite Accounts (TSA) in Europe (2019 edition) 13
The demand side: How much do visitors spend?                4

For many countries, tourism is an important driver for international trade in services. The credit side
of this part of the balance of payments (BoP) details the foreign receipts of a country.
Figure 3 depicts the share of inbound tourism expenditure (TSA) in relation to the total international
trade in services (BoP). Even if the travel concept (used in BoP) and the tourism concept (used in
tourism statistics and in TSA) are not entirely comparable(8), this ratio gives an idea of the
importance of inbound tourism for the trade in services.
For the 27 countries for which both series of data are available, inbound tourism expenditure
amounts to nearly one-fourth (23 %) of international trade in services, ranging from 5 % in Belgium to
more than 50 % in Spain (56 %) and Croatia (72 %).

Figure 3: Share of inbound tourism expenditure in relation to total international trade in services
(%)

Notes: EU-28 aggregate estimated for this publication using available data. Reference years for data on international trade in services
match TSA reference years (see Table 3), except MT (2011).

Source: Eurostat, Data collection on TSA in 2019, Statistics on international trade in services.

(8) BoP includes for instance border workers, long-term students etc.

   Tourism Satellite Accounts (TSA) in Europe (2019 edition)                                                                              14
The demand side: How much do visitors spend? 4
Nearly half of the domestic tourism
expenditure is linked to same-day visits
In almost every country, domestic tourism expenditure makes a significant contribution to the
economy and is therefore a key component of the TSA. It comprises expenditure by residents
travelling within their own country and expenditure linked to outbound trips but incurred in the country
of residence, e.g. fares for a trip abroad but paid to a carrier in the country of origin or purchase of a
new suitcase before the trip.
Reference years differ, but the highest figure was reported by Germany (EUR 224 649 million, or
30 % of EU28 total domestic tourism expenditure), followed by the United Kingdom (EUR 153 484
million) and France (EUR 103 747 million) (see Table 7 (corresponding to TSA Table 2)).
Table 7: Domestic tourism expenditure (TSA Table 2)
(million EUR)
Country Total By tourists By same-day visits
EU-28 759 000 408 000 351 000
Belgium 10 452 : :
Bulgaria 735 612 123
Czechia(¹) 4 845 3 626 1 219
Denmark 9 846 5 592 4 254
Germany(²) 224 649 100 859 123 790
Estonia(³) 212 212 :
Ireland : : :
Greece : : :
Spain(⁴) 50 342 : :
France(⁵) 103 747 : :
Croatia(⁶) 1 398 1 046 351
Italy 64 230 56 351 7 879
Cyprus : : :
Latvia 374 156 218
Lithuania 820 489 332
Luxembourg : : :
Hungary 2 146 1 372 774
Malta 112 97 16
Netherlands 51 873 : :
Austria 19 570 12 755 6 815
Poland 4 380 3 906 474
Portugal(⁷) 7 074 4 300 2 775
Romania 7 385 6 308 1 077
Slovenia 1 241 608 633
Slovakia 1 870 1 443 427
Finland 8 092 6 421 1 671
Sweden 16 383 : :
United Kingdom(⁸) 153 484 68 857 84 627
Norway(⁹) 12 896 : :
Switzerland 18 657 10 338 8 319
Note: EU-28 aggregated estimated for this publication using available data. Reference year for TSA data: See Table 3.
(¹) Tourists include business trips which accounted for 357.9 million EUR.
(²) Same-day visits' expenditure include 22.738 domestic share of outbound travellers.
(³) Domestic tourism expenditures by same-day visitors are not estimated, due to missing data.
(⁴) Estimations of rents associated to vacation homes are included.
(⁵) Year 2017; Source: DGE, CST, base 2014.
(⁶) Estimation by the Institute for Tourism using various data sources (bottom up method).
(⁷) Tourists expenditure are split between trips within the country (3.476 million €) and trips abroad (823 million €).
(⁸) Sources: UK Tourism Survey, GB Day Visit Survey, NI Continuous Household Survey, ONS International Passenger Survey, Morgan Stanley survey of airport spend,
ONS Consumer Trends.
(⁹) For resident producers only the expenditures for business travels are included as tourism expenditures. Expenditures on tour operator services are calculated gross.
Expenditures on transport services on outbound trips are included regardless of the producer being resident or non-resident. Estimated rents for vacation homes are
included. Expenditures on valuables and costly durables subject to custom control are not included.
Source: Eurostat, Data collection on TSA 2019.
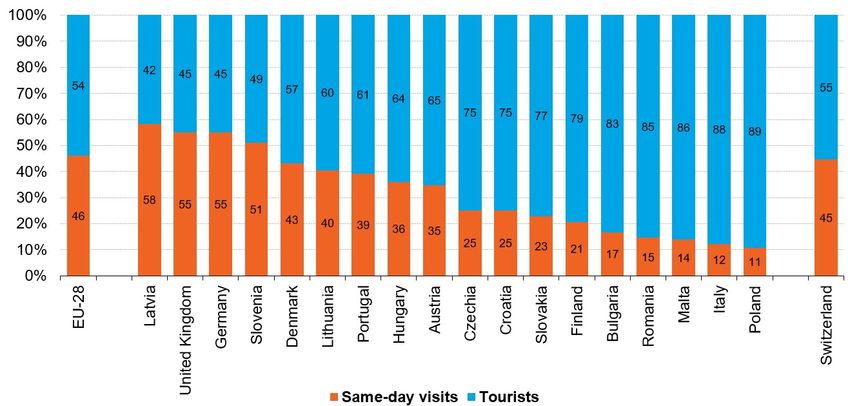
Tourism Satellite Accounts (TSA) in Europe (2019 edition) 15The demand side: How much do visitors spend? 4 Domestic tourism expenditure includes amounts spent by tourists in their country of residence in connection with an outbound trip. However, non-monetary data (the number of domestic same-day trips and domestic overnight stays) only covers trips/stays in the country of origin. Therefore, no average was calculated for domestic tourism expenditure. Domestic expenditure on domestic trips and domestic expenditure on outbound trips is reported separately in the TSA framework, but this breakdown was not included in the template gathering the input data for this paper. Available data reveals that same-day visitors had an average impact of 46 % on the level of domestic tourism expenditure. As shown in Figure 4, same-day domestic trips were more significant than overnight trips for Latvia, the United Kingdom, Germany and Slovenia. Figure 4: Expenditure accounted for by same-day visitors and by tourists as a proportion of total domestic tourism expenditure (%) Note: EU-28 aggregate estimated for this publication using available data. Source: Eurostat, Data collection on TSA 2019. Tourism Satellite Accounts (TSA) in Europe (2019 edition) 16
The demand side: How much do visitors spend?   4
Domestic tourism expenditure 1.8 times
higher than inbound tourism expenditure
Given that domestic tourism is more important than inbound tourism for many countries and as
domestic tourism expenditure includes the ‘domestic’ part of expenditure on outbound trips (see
above and methodological notes in Annex IV), domestic tourism expenditure accounted for 65 % of
internal tourism expenditure in EU28, with the remaining 35 % relating to inbound tourism
expenditure. Figure 5 shows the breakdown for individual countries.

Figure 5: Inbound tourism expenditure (ITE) and domestic tourism expenditure (DTE) as
proportions of internal tourism expenditure
(%)

Note: EU-28 aggregate estimated for this publication using available data.

Source: Eurostat, Data collection on TSA 2019.

As can be seen in Table 8 (corresponding to TSA Table 4), seven countries did not cover other
components of tourism consumption. In most cases, this was due to a lack of reliable data sources,
although some countries had included these components as ‘expenditure’ (which is not fully in line
with the updated TSA:RMF 2008).
As regards total internal tourism consumption, Germany had the highest figure: EUR 287 707 million,
or 23 % of the EU total internal tourism consumption. The United Kingdom followed with
EUR 188 436 million. France was third (EUR 187 575 million), Italy fourth (EUR 146 334 million) and
Spain fifth (EUR 123 899). At the other end of the scale, Malta reported the lowest value for internal
consumption (EUR 1 150 million), followed by the three Baltic States.
To put tourism consumption in a country into perspective (inbound as well as domestic components),
Figure 6 shows the internal tourism consumption in relation to the population of the country. Per
capita internal tourism consumption in the European Union was estimated at EUR 2 501 per
inhabitant. At country level, the Netherlands and Austria were on top with over EUR 5 000 and over
EUR 4 500 per inhabitant respectively.

   Tourism Satellite Accounts (TSA) in Europe (2019 edition)                                                                17
The demand side: How much do visitors spend?                            4

          Table 8: Internal tourism consumption (TSA Table 4)
          (million EUR)

                                                                                                                                Other
                                  Internal               Internal                Inbound               Domestic
                                                                                                                            components
        Country                   tourism                tourism                 tourism                tourism
                                                                                                                             of tourism
                                consumption            expenditure             expenditure            expenditure
                                                                                                                            consumption
EU-28                                 1 276 000              1 164 000                 405 000                759 000                           :
Belgium                                  20 774                 15 655                   5 203                 10 452                      5 119
Bulgaria                                  4 479                  4 479                   3 744                    735                           :
Czechia(¹)                                11 107                 11 107                  6 263                  4 845                       :
Denmark                                   17 212                 17 212                  7 366                  9 846                       :
Germany                                  287 207                264 204                 39 555                224 649                 23 003
Estonia                                    2 202                  1 887                  1 675                    212                    314
Ireland                                         :                      :                      :                      :                      :
Greece                                          :                      :                      :                      :                      :
Spain(²)                                 123 899                109 555                 59 213                 50 342                 14 344
France(³)                                187 575                167 968                 64 221                103 747                 19 607
Croatia(⁴)                                10 441                 10 221                  8 823                  1 398                    221
Italy                                    146 334                112 378                 48 148                 64 230                 33 956
Cyprus                                          :                      :                      :                      :                      :
Latvia                                     1 414                  1 404                  1 030                    374                     10
Lithuania                                  2 045                  2 045                  1 225                    820                       :
Luxembourg                                      :                      :                      :                      :                      :
Hungary                                    6 293                  6 293                  4 147                  2 146                       :
Malta(⁵)                                   1 150                  1 145                  1 033                    112                      5
Netherlands                               87 450                 84 363                 32 490                 51 873                  3 087
Austria(⁶)                                40 147                 40 004                 20 434                 19 570                    143
Poland(²)                                 14 505                 12 826                  8 446                  4 380                  1 679
Portugal(⁷)                               23 321                 21 787                 14 713                  7 074                  1 534
Romania                                    8 946                  8 860                  1 474                  7 385                     86
Slovenia                                   4 269                  4 188                  2 947                  1 241                     81
Slovakia(⁸)                                5 291                  4 335                  2 465                  1 870                    956
Finland(⁹)                                13 979                 11 691                  3 599                  8 092                  2 288
Sweden                                    31 257                 29 032                 12 649                 16 383                  2 225
United Kingdom(10)                       188 436                185 134                 31 650                153 484                  3 301
Norway(11)                                18 300                 18 300                  5 404                 12 896                       :
Switzerland                               35 461                 33 068                 14 411                 18 657                  2 393
Notes: EU-28 aggregated estimated for this publication using available data. Reference year for TSA data: See Table 3.
(¹) Tourism social transfers in kind and consumption of individual non-market services are not included. All other components of tourism
consumption (e.g. business trips, imputed rent) are directly included in tables T1 and T2.
(²) Other components include business expenses.
(³) Year 2017 ; Source : DGE, CST, base 2014.
(⁴) Other components include only the estimated value for imputed rental of a vacation home, without correction for tourism share.
(⁵) Other components of tourism consumption' refer exclusively to imputed rents of vacation dwellings owned by inbound tourists.
(⁶) Other components: vacation homes.
(⁷) European Implementation Manual on TSA used. Some of the 2008 recommendations adopted - the allocation of business tourism
expenditure to tables according to the residence of the visitor (tables 1, 2 or 3), instead of table 4, "other components".
(⁸) Other components includes: Social transfers in kind, Imputed rentals for housing.
(⁹) Other components = imputed consumption of vacation accom. on own account & expend. on business trips paid by employers.
(10) Estimates of upkeep of second homes. Includes fares to domestic carriers & outbound fares to other carriers.
(11) The services associated with vacation homes and the estimated rents for these are included in the tourism expenditure figures.
Calculations on social transfers in kind, FISIM, home exchange etc have not been carried out.
Source: Eurostat, Data collection on TSA 2019.

  Tourism Satellite Accounts (TSA) in Europe (2019 edition)                                                                                         18
The demand side: How much do visitors spend? 4 Figure 6: Internal tourism consumption per capita (EUR) Note: EU-28 aggregate estimated for this publication using available data. Reference years for population match TSA reference years (see Table 3). Source: Eurostat, Data collection on TSA 2019. Tourism Satellite Accounts (TSA) in Europe (2019 edition) 19
The demand side: How much do visitors spend?              4
Outbound tourism expenditure in the EU
approaches an estimated 300 billion euro,
but relatively few countries compile this
information
Outbound tourism expenditure is spending by residents of a country making tourism trips abroad on
goods and services acquired from non-resident providers. This is not included in the reconciliation of
tourism demand and supply, which may explain why not all countries completed TSA Table 3,
despite its importance for the balance of payments.
Total outbound tourism expenditure at EU level is estimated at EUR 299 000 million. Germany, the
United Kingdom and France, accounted for 57 % of this total (see Table 9 (corresponding to TSA
Table 3)). The average spend per trip (based on the data of only nine countries) was EUR 452.

Table 9: Outbound tourism expenditure (TSA Table 3) (million EUR)
     Country                             Total                          By tourists                           By SDV
EU-28                                              299 000                            278 000                              21 000
Belgium                                                   :                                  :                                   :
Bulgaria                                              1 475                              1 427                                  48
Czechia(¹)                                            2 867                              2 749                                 118
Denmark(²)                                            8 664                                  :                                   :
Germany                                              79 528                             70 800                               8 728
Estonia(³)                                                :                                  :                                   :
Ireland                                                   :                                  :                                   :
Greece                                                    :                                  :                                   :
Spain                                                18 856                                  :                                   :
France(⁴)                                            36 672                                  :                                   :
Croatia                                                   :                                  :                                   :
Italy                                                23 785                             21 911                               1 874
Cyprus                                                    :                                  :                                   :
Latvia                                                    :                                  :                                   :
Lithuania                                             1 068                                877                                 191
Luxembourg                                                :                                  :                                   :
Hungary                                               2 208                              1 797                                 411
Malta                                                   190                                190                                   :
Netherlands                                          17 337                                  :                                   :
Austria(⁵)                                           11 202                                  :                                   :
Poland                                                3 145                                  :                                   :
Portugal                                              4 334                              3 909                                 425
Romania                                               1 077                              1 069                                   8
Slovenia                                              1 085                                978                                 107
Slovakia                                              1 314                              1 067                                 247
Finland                                                   :                                  :                                   :
Sweden                                                    :                                  :                                   :
United Kingdom(⁶)                                    53 414                             53 208                                 206
Norway                                                    :                                  :                                   :
Switzerland(⁷)                                        4 359                                  :                                   :
Note: Reference year for TSA data: See Table 3.

(¹) Tourists include business trips which accounted for 581.8 million EUR.
(²) Travel account, BoP
(³) Table 3 is not compiled
(⁴) Year 2017; the figure includes frontier workers; Source: Banque de France.
(⁵) Based on TBoP (debit; incl. international passenger transport); not adjusted according to TSA: RMF 2008 (mainly in regard to
seasonal worker, long-term students); data on overnight visitors and same-day visitors are not available.
(⁶) Relates to expenditure overseas by UK residents, excludes fares paid to overseas carriers, Sources: ONS International
Passenger Survey, ONS Input Output Supply and Use Tables, ONS Consumer Trends.
(⁷) Includes only domestic tourism as part of an outbound trip.
Source: Eurostat, Data collection on TSA 2019.

  Tourism Satellite Accounts (TSA) in Europe (2019 edition)                                                                          20
The demand side: How much do visitors spend? 4 The division of outbound tourism expenditure into overnight tourists and same-day visitors is available for only 13 countries (accounting for 59 % of the EU total outbound tourism expenditure). Figure 7 gives the breakdown by type of visitor and reveals that, at EU level, 7 % of outbound tourism expenditure was spent by same-day visitors and 93 % was spent by tourists spending at least one night away from home during their outbound trips. For obvious reasons, the share of same- day visits in outbound tourism expenditure was minimal in island countries such as Malta and the United Kingdom (both less than 1 %) and more significant in centrally located, landlocked countries such as Hungary and Slovakia (both 19 %). Figure 7: Outbound tourism expenditure by type of visitor (%) Note: EU-28 aggregate estimated for this publication using available data (the 13 countries for which data is available account for 50% of EU tourism in terms of nights spent - see shares mentioned in Table 1). Source: Eurostat, Data collection on TSA 2019. Tourism Satellite Accounts (TSA) in Europe (2019 edition) 21
The supply side: how much does tourism contribute to the national economy?                       5
                                               The supply side: How
                                               much does tourism
                                               contribute to the national
                                               economy?

The TSA is an extension of the System of National Accounts (SNA). As a result, it compiles
information on both the supply side and the demand side of tourism. This means that it highlights
economic activity in tourism-related industries and portrays tourism in the context of the overall
economy and alongside other sectors. Putting tourism in an economic context is a key reason for
compiling TSA.
TSA Table 6 provides a consolidation of TSA Table 4 (demand side — internal tourism consumption)
and TSA Table 5 (supply side — production accounts of tourism industries and other industries). This
enables us to calculate the product-specific ‘tourism ratio in supply’ and the aggregates ‘tourism
value added’ and ‘tourism gross domestic product’. It forms the basis of the TSA system.
Table 10 (corresponding to TSA Table 6) shows that Spain recorded the highest tourism gross value
added (EUR 236 131 million). This represents 27 % of the tourism gross value added of the EU.
Germany (EUR 105 252 million, or 12 % of the EU total), Denmark (EUR 89 041 million), Italy
(EUR 87 823) and the United Kingdom (EUR 83 492 million) followed at a distance.
As regards the ratio of tourism to total domestic supply (see Figure 8), Croatia recorded the highest
figure (9.8 %), followed by Malta (5.8 %), Portugal (5.6 %) and Spain (5.1 %). The average for the EU
was estimated at 3.4 %.

Figure 8: Tourism ratio in domestic supply
(%)

Note: Internal tourism consumption as a proportion of total domestic supply. EU-28 aggregate estimated for this publication using
available data.
Source: Eurostat, Data collection on TSA 2016.

   Tourism Satellite Accounts (TSA) in Europe (2019 edition)                                                                        22
The supply side: how much does tourism contribute to the national economy? 5
Table 10: Total domestic supply and internal tourism consumption (TSA Table 6)
Tourism gross value Domestic supply (at Internal tourism
Tourism ratio*
Country added (at basic prices) purchasers' prices) consumption
(%)
(Million EUR) (Million EUR) (Million EUR)
EU-28 869 092 37 672 000 1 276 000 3.4
Belgium 7 972 1 135 849 20 774 1.8
Bulgaria : 131 365 4 479 3.4
Czechia 4 876 599 609 11 107 1.9
Denmark(¹) 89 041 716 922 17 212 2.4
Germany 105 252 8 268 827 287 207 3.5
Estonia 845 57 786 2 202 3.8
Ireland : : : :
Greece : : : :
Spain 236 131 2 446 123 123 899 5.1
France : : 187 575 :
Croatia(²) 4 215 107 089 10 441 9.8
Italy 87 823 3 711 419 146 334 3.9
Cyprus : : : :
Latvia 893 46 946 1 414 3.0
Lithuania 1 052 98 976 2 045 2.1
Luxembourg : : : :
Hungary 6 050 309 157 6 293 2.0
Malta 331 19 947 1 150 5.8
Netherlands 30 442 2 100 552 87 450 4.2
Austria(³) 26 111 905 478 40 147 4.4
Poland 3 514 954 517 14 505 1.5
Portugal(⁴) 11 147 417 076 23 321 5.6
Romania 4 556 326 479 8 946 2.7
Slovenia 1 463 118 552 4 269 3.6
Slovakia 1 847 269 291 5 291 2.0
Finland(⁵) 4 609 505 642 13 979 2.8
Sweden 10 175 1 093 075 31 257 2.9
United
83 492 5 040 236 188 436 3.7
Kingdom(⁶)
Norway(⁷) 12 573 710 748 18 300 2.6
Switzerland 14 502 1 303 645 35 461 2.7
(*) Tourism ratio = Internal tourism consumption (at purchasers' prices) as proportion of domestic supply.
Note: Reference year for TSA data: See Table 3.
(¹) Tourism specific and tourism related industries in T6.1. Margins included in T6.2
(²) Croatia-specific tourism characteristic industries are the following: retail trade and industries producing merchandise (one column in table 6),
mooring services of nautical port, renting of vessel (nautical charter).
(³) "Tourism ratio": In the Austrian TSA Tourism Direct Gross Value Added (TDGVA) is defined as the value added generated by tourism industries
and other industries of the economy in response to internal tourist consumption. However, the starting point of the calculation of TDGVA is TSA-
Table 6, which shows products characteristic of tourism on the supply as well as on the use (demand) side (internal consumption). Calculating the
"tourism ratio" of any given supply of commodities the amount purchased by tourists is related to the total supply of the respective commodity. These
"tourism ratios" are applied to the Gross Value Added (GVA) of each of the "symmetrically" corresponding industry in TSA-Table 5, the TDGVA of
each industry results. Therefore, the result under T6.8 differs from the national published one. Incl. Business trips.
(⁴) The amount of trade margins of the connected and non specific goods are implicit under internal tourims expenditure (margins in table 1 +
margins in table 2) and under "total output of domestic producers".
(⁵) We have published a tourism ratio of 2,5% because we subtract the price of commodities for Tourism connected products and non-tourism related
products from the internal tourism consumption in table 4. For these, only margins are included in Internal Tourism Consumption in Table 6. These
products are mainly related to fuel and shopping.
(⁶) Trade and transport margins not estimated.
(⁷) T6.1 is Gross value added for tourism industries. Tourism industries does not include services associated with own vacation homes and retail
trade of country-specific tourism characteristic goods. Production of local passenger transport is included in the transport industries. T6.7, see
comments under T2 and T4.
Source: Eurostat, Data collection on TSA 2019.
Tourism Satellite Accounts (TSA) in Europe (2019 edition) 23The supply side: how much does tourism contribute to the national economy? 5
Tourism generates 4 million jobs in Italy
Employment is a key variable in the economic analysis of productive activities. ‘Employment in
tourism’ measures the number of jobs in tourism and non-tourism industries (but directly connected
to tourism) held by the self-employed, employees and unpaid family co-workers.
Table 11 (TSA Table 7) reveals that tourism generated 16.5 million jobs in the 15 countries for which
data is available. The highest number of jobs connected to tourism was observed in Italy
(4.2 million).
Table 11: Employment in the tourism industries (TSA Table 7)
Number of hours Number of full-time Number of people
Country Number of jobs
worked equivalent jobs employed
EU-28 : : : :
Belgium 334 429 : : :
Bulgaria : : : :
Czechia(¹) 238 843 434 369 454 235 691 :
Denmark(²) : : 257 561 :
Germany 2 919 106 : : 2 431 710
Estonia(³) : : 22 446 :
Ireland : : : :
Greece : : : :
Spain 2 425 300 : 2 051 600 2 364 700
France(⁴) : : : 1 336 692
Croatia : : : :
Italy 4 206 857 : 3 173 021 :
Cyprus : : : :
Latvia : : : :
Lithuania 46 886 : : :
Luxembourg : : : :
Hungary 442 485 887 848 745 427 715 :
Malta 32 919 : 24 668 :
Netherlands 791 000 : 474 000 679 000
Austria(⁵) 317 500 507 468 000 244 000 :
Poland : : 110 055 :
Portugal(⁶) 488 003 : 416 817 :
Romania 371 696 650 408 865 367 563 :
Slovenia(⁷) : : : 65 741
Slovakia 402 416 680 932 027 386 569 388 086
Finland(⁸) 138 800 235 200 000 122 400 :
Sweden : 234 600 000 129 642 154 600
United Kingdom(9) 3 299 246 : 2 539 135 2 742 967
Norway(10) : : 162 500 :
Switzerland : : 171 784 :
Note: Reference year for TSA data: See Table 3.
(¹) Data are based on "Tourism Employment Module" by CZSO. All data represent "domestic concept of employment".
(²) A part of the numbers for the shipping share also includes freight and not only passengers.
(³) Number of full-time equivalent jobs is estimated only in tourism characteristic industries.
(⁴) For Number of people employed = number of employees, year 2017 ; Source : Acoss
(⁵) "Number of people employed" in FTE; according to TSA-RMF 2008.
(⁶) It refers to the Employment of the tourism characteristic industries.
(⁷) The number of people employed corresponds to total people employed in tourism industries according to NA. Number of people employed
directly connected with tourism is 35.877 (calculation upon number of persons employed in national accounts according to activities and tourism
ratios of supply in individual activities).
(⁸) Employment and working hours in the tourism industries. Full-time definition based on Labor force survey.
(9) Sources: Annual Population Survey, Annual Survey of Hours & Earnings, Business Register & Employment Survey, Workforce Jobs by
Industry, Annual Business Survey, Tourism Totals for Tourism Direct Employment and FTEs include employment data relating to "other
consumption products".
(10) Regarding the industries included, see comment under T6.
Source: Eurostat, Data collection on TSA 2019, Tourism statistics
Tourism Satellite Accounts (TSA) in Europe (2019 edition) 24The supply side: how much does tourism contribute to the national economy? 5
Tourism gross fixed
capital formation and
collective consumption
To produce TSA Tables 8 and 9, compilers need to gather data from sources other than those
usually included in official statistics. Furthermore, these tables present conceptual challenges.
Therefore, drawing up these tables can be considered a definite step towards compiling a full set of
TSA. However, only few countries are currently able to provide this information (see Table 12
(corresponding to TSA Tables 8 and 9)).
Table 12: Tourism gross fixed capital formation (TSA Table 8) and tourism collective
consumption (TSA Table 9)(million EUR)
Country Tourism gross fixed capital formation Tourism collective consumption
EU-28 : :
Belgium : :
Bulgaria : :
Czechia(¹) 1 344 :
Denmark : :
Germany 29 481 :
Estonia 275 :
Ireland : :
Greece : :
Spain(²) 15 216 1 977
France : :
Croatia : :
Italy : :
Cyprus : :
Latvia : :
Lithuania : :
Luxembourg : :
Hungary 1 647 :
Malta : :
Netherlands : :
Austria : :
Poland 19 906 :
Portugal : 197
Romania : :
Slovenia : :
Slovakia 1 197 :
Finland : :
Sweden : :
United Kingdom : :
Norway(³) 2 024 :
Switzerland : :
Note: Reference year for TSA data: See Table 3.
(¹) Data for year 2016.
(²) Tourism social transfers in kind are included in collective consumption.
(³) Regarding the industries included, see comment under T6.
Source: Eurostat, Data collection on TSA 2019, Tourism statistics
Tourism Satellite Accounts (TSA) in Europe (2019 edition) 25Non-monetary data 7
Non-monetary data
TSA Table 10 presents a basic set of physical, non-monetary indicators that relate mainly to the
demand side TSA tables and complement the core TSA figures. They also allow further analysis and
enable proper interpretation of the monetary information.
The 2008 System of National Accounts (SNA) states explicitly that physical indicators (on tourist
flows) are a key component of tourism satellite accounts. As a result, they should not be viewed
merely as ancillary components of the TSA. The non-monetary data in Table 13 (corresponding to
TSA Table 10) on the number of same-day trips, overnight trips and overnight stays for inbound,
domestic and outbound tourism was added to this data collection exercise to facilitate analysis. It
also provides the basis for calculating the average expenditure.
Tourism Satellite Accounts (TSA) in Europe (2019 edition) 26Non-monetary data 7
Table 13: Non-monetary indicators (TSA Table 10)
(thousands)
Inbound tourism Domestic tourism Outbound tourism
Country
SDT OT Nights SDT OT Nights SDT OT Nights
EU-28
Belgium : : : : : : : : :
Bulgaria 2 977 5 275 30 067 1 299 2 992 12 031 680 4 712 31 643
Czechia 21 036 13 665 44 893 57 603 32 562 119 347 2 538 8 893 57 879
Denmark 17 340 : 55 018 55 282 : 66 156 : : 52 421
Germany : : : : : : : : :
Estonia(¹) 2 644 3 160 12 455 : 2 572 5 372 : 1 426 8 719
Ireland : : : : : : : : :
Greece : : : : : : : : :
Spain 40 246 75 315 595 504 238 196 166 219 643 050 2 872 15 732 137 274
France(²) 120 509 86 861 582 964 84 901 191 636 895 659 15 209 29 055 231 583
Croatia : : : : : : : : :
Italy 30 335 46 692 319 392 65 767 51 280 326 844 : : :
Cyprus : : : : : : : : :
Latvia 5 004 1 793 8 776 9 126 3 071 7 233 : : :
Lithuania 3 026 2 296 9 962 11 670 2 554 6 910 2 190 1 953 12 938
Luxembourg : : : : : : : : :
Hungary(³) 7 970 13 474 60 605 107 507 14 425 44 543 9 518 6 444 16 733
Malta : : : : : : : : :
Netherlands : 18 780 47 002 : 25 132 69 080 : : :
Austria(⁴) : : 105 977 : : 38 523 : 11 491 73 761
Poland 56 510 15 800 : : 42 450 : 42 550 10 050 :
Portugal : : : : : : : : :
Romania 1 099 2 470 4 812 31 971 16 275 58 131 113 1 093 9 520
Slovenia : 3 991 9 685 : 1 513 4 523 2 397 3 013 15 711
Slovakia 15 472 7 620 23 905 6 666 7 841 24 506 2 844 3 491 20 596
Finland : : : : 29 790 : 1 160 9 120 50 250
Sweden : : : : : : : : :
United
: : : : : : : : :
Kingdom
Norway(⁵) : : : : 13 840 51 840 : 8 030 57 740
Switzerland(⁶) : : 19 883 68 268 7 732 16 051 7 512 13 427 :
Notes: SDT = Same-day trips; OT = Overnight trips. Reference year for TSA data: See Table 3 (except ES: 2016 and FR: 2017).
(¹) Inbound tourism: Number of overnight stays = nights spent by foreign visitors in collective accommodation establishments; Domestic and
outbound tourism: data based on the Household Budget Survey.
(²) Inbound tourism, Source: DGE, Banque de France, enquête EVE; Domestic and Outbound tourism, Source: DGE, Enquête SDT.
(³) TSA includes Spa services (country specific product) and Support activities for transportation beyond TSA:RMF 2008 Item 2c1 activities. The
share of these are on demand side 6 and 1%, on supply side 8 and 15% respectively.
(⁴) Inbound and Domestic tourism: Nights spent based on accommodation statistics in NACE 55.1, 55.2, 55.3 and private tourist accommodation.
Outbound tourism: Includes holiday and business trips and nights.
(⁵) Domestic and Outbound tourism data from the national travel survey conducted by Statistics Norway following the EU regulation 692/2011.
(⁶) Number of overnight-stays includes only NACE 55.1.
Source: Eurostat, Data collection on TSA 2019, Tourism statistics.
Tourism Satellite Accounts (TSA) in Europe (2019 edition) 27Annex I – List of indicators in the questionnaire
Annex I — List of
indicators in the
questionnaire
TSA Table 1
Inbound tourism expenditure [three indicators]
Total inbound tourism expenditure
Inbound tourism expenditure by tourists/overnight visitors
Inbound tourism expenditure by same-day visitors/excursionists
TSA Table 2
Domestic tourism expenditure [three indicators]
Total domestic tourism expenditure
Domestic tourism expenditure by tourists/overnight visitors
Domestic tourism expenditure by same-day visitors/excursionists
TSA Table 3
Outbound tourism expenditure [three indicators]
Total outbound tourism expenditure
Outbound tourism expenditure by tourists/overnight visitors
Outbound tourism expenditure by same-day visitors/excursionists
TSA Table 4
Internal tourism consumption [five indicators]
Total internal tourism consumption
Internal tourism expenditure
o Inbound tourism expenditure
o Domestic tourism expenditure
Other components of tourism consumption
TSA Table 5
Production accounts of tourism industries and other industries [three indicators]
Total output of domestic producers (at basic prices)
Total intermediate consumption of domestic producers (at purchasers’ prices)
Total gross value added (at basic prices)
TSA Table 6
Total domestic supply and internal tourism consumption [eight indicators]
Tourism gross value added (at basic prices)
Tourism Satellite Accounts (TSA) in Europe (2019 edition) 28You can also read