Efficient Delivery of Forecasts to a Nautical Sports Mobile Application with Semantic Data Services - Unpaywall
←
→
Page content transcription
If your browser does not render page correctly, please read the page content below
Efficient Delivery of Forecasts to a Nautical Sports Mobile
           Application with Semantic Data Services

              Ricardo Carvalho                                          Artur Rocha                            Marco Oliveira
                  Amorim                                     INESC Technology & Science                 INESC Technology & Science
          Faculdade de Engenharia                            artur.rocha@inesctec.pt                   marco.a.oliveira@inesctec.pt
              Universidade do
             Porto/INESC-TEC
             rcamorim@fe.up.pt
                                                                     Cristina Ribeiro
                                                                Faculdade de Engenharia
                                                                 Universidade do Porto /
                                                                      INESC-TEC
                                                                       mcr@fe.up.pt

ABSTRACT                                                                          forecasts for regions near the coast.
Weather and sea-related forecasts provide crucial insights                           Several kinds of institutions collect weather and sea-related
for the practice of nautical sports such as surf and kite surf,                   data: national and regional meteorology agencies, port au-
and mobile devices are appropriate interfaces for the visual-                     thorities, military marine departments and research insti-
ization of meteorology and operational oceanography data.                         tutes belong to this group. As data are gathered on a
Data are collected and processed by several agencies and                          systematic basis, there are well-established supporting in-
are often obtained from forecast models. Their use requires                       frastructures that coordinate the collection of data in the
adaptation and refinement prior to visualisation. We de-                          scope of their field of activity, making them usable for a
scribe a set of semantic data services using standard com-                        plethora of application-specific purposes. These data can
mon vocabularies and interoperable interfaces following the                       be generated by global observation systems such as satel-
recommendations of the INSPIRE directive. NautiCast, a                            lite networks, from campaign vessels, or even from devices
mobile application for forecast delivery illustrates the adap-                    deployed on specific constructions at the seashore or in the
tation of data at two levels: 1) semantic, with the integra-                      sea, such as multi-parametric buoys (including, for instance,
tion of data from different sources via standard vocabularies,                    submerged sensors). Such devices are used to read atmo-
and 2) syntactic, with the manipulation of the spacial and                        spheric parameters such as wind direction, temperature and
temporal resolution of data to get effective mobile commu-                        humidity, or sea surface ones like maritime agitation, wave
nication.                                                                         height and wave period.
                                                                                     Another step in data usage is the execution of mathe-
                                                                                  matical models to process sensor data and obtain forecast
Categories and Subject Descriptors                                                products, with spatially and temporally referenced values
H.4 [Information Systems Applications]: Miscellaneous;                            for selected variables. In-situ readings are used as reference
H.5 [Information Interfaces and Presentation]: User                               inputs at given points, to fine tune the mathematical mod-
Interfaces; C.2.4 [Distributed systems]: Distributed da-                          els used to predict behavioural changes for a specific time
tabases                                                                           coverage. Global predictions are therefore complemented by
                                                                                  higher resolution outputs near the coast.
                                                                                     Each data producer typically uses specific formats, which
1.    INTRODUCTION                                                                are well-known inside their community but significantly dif-
  The practice of outdoor sports is dependent on atmo-                            ferent from other communities. The implicit semantics for
spheric conditions that are permanently monitored by an                           these formats is therefore hard to process in a systematic
array of institutions. Sports directly related to the state of                    way. Furthermore, different institutions from different coun-
the sea, where sportspersons are physically exposed, such as                      tries may be involved in data collection for a given region,
surf and kite-surf, are greatly dependent on both weather                         leading to increased difficulties when processing the data for
and sea conditions and become much safer with accurate                            visualisation or other kinds of integrated processing. Never-
Permission to make digital or hard copies of part or all of this work for         theless, institutions are increasingly adopting standard data
personal or classroom use is granted without fee provided that copies are not     and metadata encodings, interoperable interfaces and com-
made or distributed for profit or commercial advantage and that copies bear       mon vocabularies to facilitate the exchange of both data and
this notice and the full citation on the first page. Copyrights for components
of this work owned by others than ACM must be honored. Abstracting with           metadata.
credit is permitted. To copy otherwise, to republish, to post on servers or to       This work is based on data collected for the northern Por-
redistribute to lists, requires prior specific permission and/or a fee. Request   tugal and Galicia regions, in the context of projects result-
permissions from Permissions@acm.org.                                             ing from European cross-border collaborations. The data
C3S2E’16 July 20 - 22 2016, Porto, Portugal                                       collecting agencies provide expertise on data collection and
Copyright 2016 ACM ISBN 978-1-4503-4075-5/16/07 ...$15.00.                        organisation, execute models on selected data to generate
http://dx.doi.org/10.1145/2948992.2948999.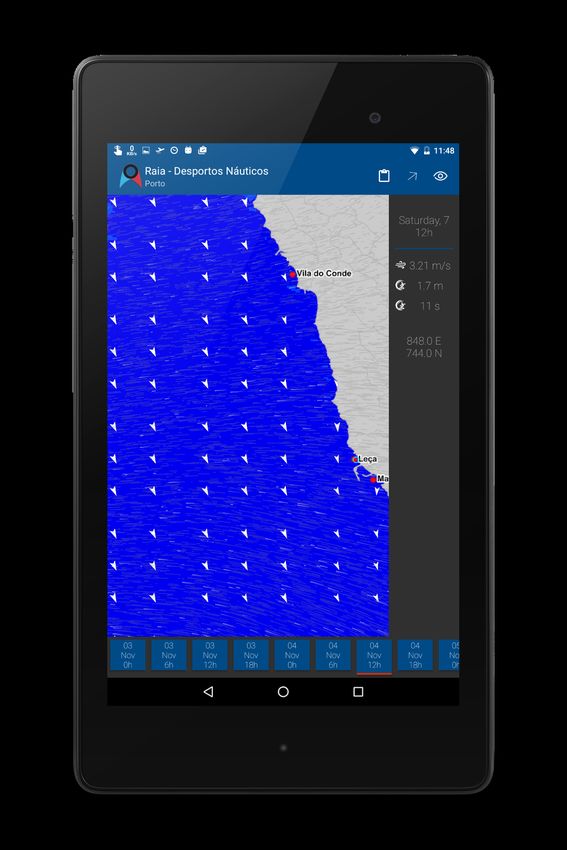
forecast products on a regular basis, and identify require-
ments concerning new forms of data exploration. Moreover,
the research institutes are engaged in modelling data and
aggregating metadata to build robust storage and interro-
gation infrastructures and services, as well as in the devel-
opment of new applications based on these services.
   The paper provides a synthetic view on existing data col-
lecting infrastructures for the target region and on the set
of services designed to integrate data within a common se-
mantic framework, leveraging on the data systematically col-
lected and processed by several institutions. The semantic
services are tested on a mobile application to assist users as
they choose a suitable place to practice sports that depend
heavily on sea and weather conditions. The development of
the application is a challenge at two levels. The first con-
cerns the interface to the semantic services. A successful
implementation in this case shows that the services satisfy
several general requirements. The second has to do with the
data manipulation in mobile applications. Visualising fore-
cast data in mobile devices has specific challenges concerning   Figure 1:    Wind, wave period and Surf Quality In-
the data volumes, the fusion of data from several sources,       dex data,    a detail from http://www.hidrografico.pt/
and the interface design. The result is an application which     previsao-surf-porto.php
is both rigorous on data presentation and appropriate for the
intended users. The decisions concerning data manipulation
and visualisation are detailed and provide insights for other
                                                                    For the surf and kite-surf predictions, the app relies on
applications dealing with geo-referenced forecast data.
                                                                 atmospheric forecasts by MeteoGalicia (Spain) and on more
                                                                 specific nautical forecast products from operational oceanog-
2.   DISTRIBUTED FORECASTS                                       raphy provided by Instituto Hidrográfico, a division of the
   At a high level, the Nauticast application uses several       Portuguese Navy. To tackle semantic issues derived from
kinds of information resources, namely data, operational         encoding at the dataset level, the partners agreed to comply
models and resulting products. Data consists either of basic     with the Climate and Forecast (CF) conventions (CF version
sensor data or those resulting from processing. By models we     1.4 or above) to specify which data each variable represents,
mean mathematical models devised by experts in forecasts,        as well as their spatial and temporal properties. In doing
which are run on raw or refined data. Products designate         so, each party can keep their own localised preferences con-
selected outcomes of models which are exchanged between          cerning long names and descriptions, which naturally arise
experts or disseminated to the public. An example of a           as two countries with different languages are involved, while
product presentation is the detail of a page of forecasts for    adhering to the same standard name to facilitate integrated
surfers presented in Figure 1. The horizontal axis has time      processing and visualisation.
periods (12H00, 18H00, 00H00, 06H00). The bottom part               All institutions agreed on the open access to semantically
of the figure shows values for three variables, wind, wave       rich data through a geographically distributed infrastructure
period and Surf Quality Index, in three distinct locations.      of standard services and data formats. Each institution has
The top part aligns this information with values for tide        its own systems and is in charge of supporting the corre-
and surf heights. The resources used in the data services        sponding services and data.
and in the mobile application were assembled in the context         To provide forecasts, the operational models usually gen-
of the RAIA Oceanographic Observatory [13] as a result           erate outputs as NetCDF [8, 5] files that are harvested by
of a coordinated cross-border effort by a set of institutions    a THREDDS Data Server (TDS) [9], thus making them im-
(a meteorological agency, a navy technical department and        mediately available to prospecting clients. TDS implements
several research groups) to interoperate their systems, build    standard interfaces (APIs) for data and metadata access ser-
a higher-level service-based infrastructure, and improve the     vices. APIs such as Web Map Service (WMS) [3], Web Cov-
knowledge of the maritime environment for the region of the      erage Service (WCS) [14] or Network Data Access Protocol
Northwest Iberian Peninsula.                                     (OPeNDAP) [2], among others, can be harvested by a Cata-
   The set-up of the distributed infrastructure required some    logue Service for the Web [11], and accessed by other services
adaptation of the partner communities, adopting good prac-       or systems, thus enabling the creation of added value appli-
tices both from the Earth and Ocean Sciences (EOS) and the       cations through the fusion of datasets which would be hard
Geospatial Communities (OGC) [13]. It takes advantage of         to relate otherwise.
existing standards and aims to contribute to the implemen-          Institutions apply multiple numerical models such as Wave-
tation of the European INSPIRE Directive [4] by 2020, as         watch III (WW3) [12], Wave Model for Coastal Regions
is legally required from EU member states. All the part-         (SWAN) [1], Regional Ocean Modeling System (ROMS) [7]
ner institutions are committed to make their data promptly       or Weather Research and Forecasting (WRF) [10], with dis-
available after running the forecasting models. There are        tinct enforcements, spatial and temporal resolution, to ob-
however several obstacles, ranging from the lack of invest-      tain forecasts for different uses. Each output of a model
ment on data infrastructures to the absence of actual appli-     execution generates a downscaled dataset of multi-variable
cations for some datasets that leads to their neglect.           spatio-temporal data.
Even if the spatial extent of the forecasts is the same, a               3.1    Handling data diversity
software application may have to display gridded data at                       As each device needs to retrieve the same resources to
very different scales and possibly with time gaps for which                 display, a service to pre-process data and make them avail-
not all forecasts are available. Apart from these issues, since             able to the clients was created. All data is thus gathered
high resolution models result in large volumes of data and                  and centralised in this node, that also handles the different
transferring large datasets to mobile devices is not cost-                  spatial and temporal resolutions that are retrieved from the
effective due to data fees, the implementation of an inter-                 geographically distributed centres.
mediate preprocessing service is essential in this case.                       This centralised node has the additional advantage of re-
   In the context of forecast data processing, dealing with                 ducing the dependency from multiple distributed services by
several, large datasets with high-resolution data hinders di-               also becoming a cache service, enabling data access even if
rect access by a mobile device. A pre-processing routine was                the original data services are momentarily down.
developed to address this issue and make it possible to de-                    Figure 2 shows the two main institutions involved in this
ploy the created dataset to the mobile devices displaying it                particular scenario: Meteogalicia1 , providing data related
to the end users. Nevertheless, as it is common for several                 to the weather conditions, such as wind speed and direc-
institutions to collaborate and produce specific parts of the               tion; and Instituto Hidrográfico2 responsible for the sea-
dataset, the fusion of these parts has to be executed prior                 related variables—wave period, significant height and wave
to their refinement.                                                        direction. In both cases, the forecasts are generated by
                                                                            running the mathematical models and enforcing them to
3.   SEMANTIC DATA FUSION                                                   other datasets coming from global forecasting model out-
                                                                            puts, satellite imaging, buoys deployed overseas or various
   The integrated visualization of multi-variable spatio-tem-
                                                                            campaign vessels.
poral data in mobile devices poses interesting issues con-
                                                                               Institutions also deal with sensor networks and the con-
cerning the high volume of exchanged data and the amount
                                                                            cept of data fusion, i.e. merging data from heterogeneous
of processing power required to properly render them. Data
                                                                            arrays of sensors, has been discussed [15]. The resulting
from diverse provenances and with different resolutions needs
                                                                            data is then made available either directly from the exist-
to be merged and tailored before being sent over to users’
                                                                            ing catalogs or through services that implement standard
devices. On the course of this section an approach to solve
                                                                            interfaces for established output formats.
these issues and make data systematically available to the
                                                                               To start with, the collection of the required oceanographic
end-users will be detailed.
                                                                            and atmospheric datasets has to deal with issues such as
                                                                            network delays and server maintenance, considering the ge-
                                                                            ographic dispersion of the involved infrastructures. An ap-
                                             Campaigns                      plication can take advantage of the built-in NetCDF remote
                                                                            access client3 and query a remote file for specific variables or
                                             Mathematical                   coverages. Preliminary testing with such approach revealed
                                               Models                       some issues when querying each of the fields using the re-

                             ...                                            mote access client, so the choice fell on retrieving the whole
                                                                            dataset for each forecast.
                                                                               In the process of merging the datasets, some discrepan-
                                                                            cies concerning spatial and time resolution and repository
                                                             Data sources

                                                                            organisation were found. As expected, the outputs of each
                                              ...
      Meteo Galicia     Hidrográfico                                        institution show subtle differences in the geographical cov-
                                                                            erage, and the way this data is made available to the pub-
                                                                            lic follows local, organisation-dependent conventions. After
                                                                            starting to fetch data for the wind-related forecasts, we also
                                                                            noticed that 1) the time coverage for that data was differ-
                      Thredds, CSW                    Catalogs              ent on datasets from different institutions; and that 2) the
        WMS*, WCS, OPeNDAP                            Services
                                                                            geographic boundaries were, in some cases, also different.
                                                                               After retrieving the raw datasets, processing them into the
                                                                            single dataset requires normalisation of time and spatial res-
                                                             Refinement

                                                                            olution. To handle the existing diversity, the higher resolu-
                                                                            tion dataset was retrieved, then the necessary data variables
                                                                            have been extracted along with their temporal and spatial
                                                                            boundaries. These were then used as criteria to query the
                                                                            remaining datasets. A set of points of interest have also been
                                                                            selected for displaying in the devices. Coordinates for these
                                                             End users

                                                                            spots are passed onto the next stage to be associated with
                                                                            the values for the remaining variable.

                                                                            3.2    Data resolution
                                       ...                                  1
                                                                              http://www.meteogalicia.es
                                                                            2
                                                                              http://www.hidrografico.pt
Figure 2: Outlined representation of the data flow, starting                3
                                                                              https://www.unidata.ucar.edu/software/netcdf/
from the data sources until the end-user                                    docs/remote_client.html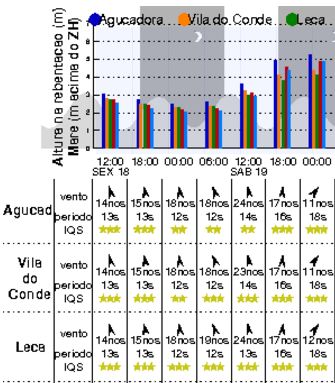
(a) (b) (c)
Figure 3: Application screen shots showing 3a) the initial sport selection; 3b) the simplified view with the quality index
variable shown; and 3c) the detailed view of a specific region
Table 1: Comparison of the available data for two variables– and good enough for the desired usage. This means obtain-
Wave significant height (Hs) and wind Gust—extracted from ing a common geographic reference, with a specified spacing
both sources. Values are for December 8th 2015 for all datasets, allowing quick evaluation of the results of
resolution changes in the device’s interface.
[41.0, -8.9] Reference Dataset Weather dataset Concerning time coverage, the existing differences between
datasets rely, at the moment, on one providing forecasts ev-
Time / Variable Hs Gust
ery 6 hours and others having more frequent data, decreasing
T00:00:00.000Z 1.9983872 11.65399
that spacing up to 1 hour intervals. Again, the first dataset
T01:00:00.000Z – 11.65399
is used as a master and the corresponding data is retrieved
T02:00:00.000Z – 11.554
from the other institutions. As shown in Table 1, actual
T02:00:00.000Z – 11.554
data is only extracted when the involved datasets provide
... ... ...
values for the needed variables. In this case, we retrieve two
T06:00:00.000Z 1.9972923 11.35399
points (highlighted) from this block. From the users’ point
of view, this still ensures forecasts accuracy, and keeps the
involved data exchange to the minimum without compro-
mising visual quality. As these models are very accurate,
Although each institution applies internally defined spa- applying a dataset for half of the time coverage yields little
tial and temporal settings, a bigger issue emerges when con- to no accuracy loss for the kind of users and applications we
sidering displaying such data on mobile devices. As it is are dealing with.
important to maintain the temporal extent of the forecasts,
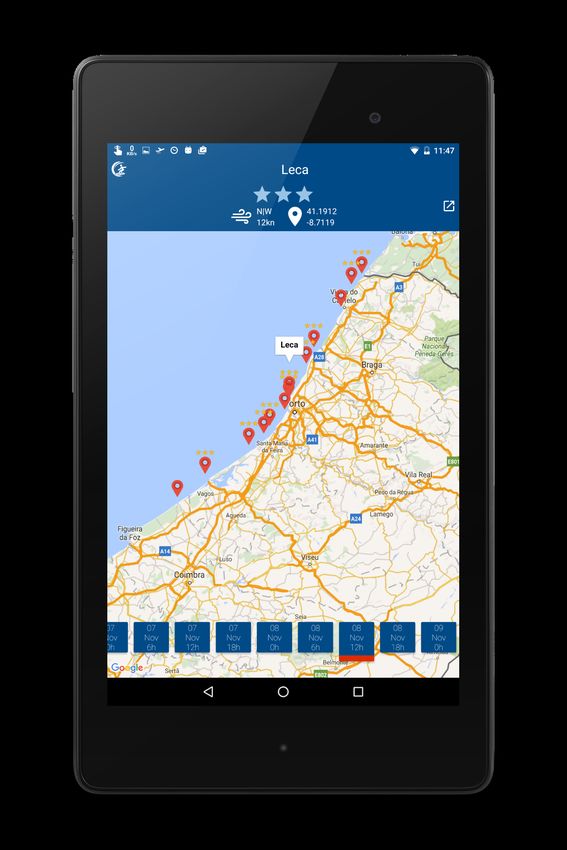
the spatial resolution has been reduced instead, in order to 4. END USER DATA VISUALIZATION
downsize the volume of the merged dataset. The goal is to
facilitate the download of the dataset from the server, and To address the constraints in visualizing fairly large fore-
more importantly, to ensure that a larger number of devices cast data through limited interfaces, we implemented a pro-
is capable of loading such dataset. cess to merge separate datasets and assemble smaller ones
The THREDDS data server has a sub-setting service for with negligible loss of accuracy. To display this data, we
NetCDF-based files that allows developers to get specific used well-accepted representation models in data visualisa-
portions of a dataset, either specifying a bounding box, a tion. An example of such representations are flux curves,
temporal coverage or both. Additionally, it is also possi- proposed in the context of wind data visualization by Bec-
ble to define, for each of the requested variables, a stride— cario 4 . Despite their visually-rich interfaces, these methods
n— that samples each n-th value of the selected variable. assume an underlying layer of datasets with high spatial res-
To merge the datasets, the spatial resolution is reduced to 4
For a real-time demonstration of this visualization model,
match a grid size that is appropriate for all the forecasts please refer to: http://earth.nullschool.net/olution, and therefore the visualization of this kind data in cases targeted at nautical sports. Analysing the methodol-
constrained environments is often limited to basic, tabular ogy used to harvest and process weather data, these projects
representations. apply similar approaches to build global forecast datasets.
This includes the selection of a set of spots—well known
4.1 Weather data visualization in NautiCast for their suitability for this kind of sports—with indicators
Although simple interfaces are flexible and can display rating their current conditions in a predefined scale.
significant amounts of data, their lack of precision becomes Despite their successful delivery of forecast data to the
visible when considering single points in a map, instead of users focused on a specific sport activity, existing applica-
larger geographic regions. Animations have been proposed tions rely on globally generated data for their predictions.
to provide a richer visualization in small devices, represent- This means that data generated and optimised locally by
ing different variables in a map view [6]. This allows, for dedicated institutions is not considered in the process. This
instance, the display of wind motion and speed using mov- allows a broader set of places with existing data in the global
ing particles, and the use of static arrows to represent wave mesh, but does not take advantage of a wealth of more de-
characteristics. tailed and geographically distributed datasets. Prediction
Figure 3 shows the application interface. The application accuracy can be improved with local information, but the
starts by highlighting the two target sports for this partic- use of data from different sources call for a different ap-
ular scenario: surf and kite-surf, as shown in Figure 3a. proach. Institutions that collect and process local, high-
Cached data is immediately available in the mobile device precision forecast data, can be included in the overall work-
at application start. Background tasks check for updated flow, ensuring a higher resolution dataset whenever possi-
datasets. If they are available, the dataset is automatically ble and, at the same time, providing better predictions for
updated. The application is organised around the forecast known spots.
conditions for specific spots. Figure 3b, for instance, has in-
formation for the surroundings of the “Leça” beach. Selected
spots are popular due to their favourable characteristics for 5. CONCLUSION AND FUTURE WORK
the practice of surf, kite-surf or other nautical sports. Generic forecast data is often organised in complex struc-
Data for each spot is a detail of the larger dataset, rep- tures and consists of large datasets. The direct delivery of
resenting a summary obtained by mathematical models and this data to the end users does not facilitate an easy in-
empirical formulations applied to those spots. Such detailed terpretation and poses technical problems when the read-
data includes a set of selected variables and their correspond- ing devices have limited resources. Among researchers in
ing values for the spot and, in case of a surf forecast, a rating weather and ocean forecasts, standards for data and meta-
of one to three stars. The stars correspond to the Index of data harvesting are already in place, and are increasingly
Surf Quality (IQS), computed by Instituto Hidrográfico con- important for the goal of creating an environment of inter-
sidering the variables that contribute to the overall quality of operable, worldwide services. Data services can demonstrate
the spot, for a particular time instant. This rating provides their importance when considering data visualization, which
a global, easy to grasp information from the surf forecast for requires an array of output formats for resources such as im-
that specific spot. ages and data subsets.
Users can have a more detailed view of a selected region We describe a generic approach to deliver forecast data to
(see Figure 3c), encompassing several spots, where the re- the end users, focusing on the specific scenario of nautical
maining data—sea and wind conditions—are included. This sports that are heavily dependent on weather conditions.
view shows the merged pre-processed dataset with image Our project has built on forecast data from several sources
resources extracted from the available WMS web services. and a set of services providing an extra layer of abstraction
These images are downloaded together with the dataset and on them. Projects RAIA (0520-RAIA-CO-1-E) and RAIA-
the device’s screen resolution is considered to generate ap- TEC (0688-RAIATEC-1-P) set the baseline for this work
propriate images. This allows a richer visualization, com- and provided essential insights on how to tackle interoper-
plementing iconographic symbols and flux curves with a ability issues in this particular domain. Our goal was to
background image that shows different colours depending test whether the existing services could support an applica-
on wave heights, using a pre-defined scale. tion aimed at end users, using simple devices, and taking
advantage of datasets with different spatial and temporal
4.2 Weather visualisation initiatives resolutions.
Delivering forecast data for public information has been The workflow we adopted includes running daily routines
explored in other applications. Several projects propose op- to extract the appropriate datasets from the partner institu-
timized interfaces and refined data to deliver forecasts to tions and to merge them into a single, lower resolution and
the general public. Services such as AccuWeather5 can dis- compressed dataset that can be easily ingested by smaller
play weather information on a variety of interfaces, including devices such as tablets or smartphones.
mobile devices. Nevertheless, their approach is generic, and For the end user, focused on getting quick and visible
therefore more specialised information, relevant to specific feedback from the forecast data, we consider that there was
sports, is not considered. little to no compromise in terms of both data quality and
On the other hand, initiatives such as WindGuru6 and accuracy. In the end, the implemented workflow proved to
WindFinder7 offer information at a deeper level, in some be robust with respect to the diversity of data sources and
institutions, namely in terms of temporal coverage and spa-
5
http://www.accuweather.com/ tial resolutions. The same approach can be used in other
6
http://windguru.cz application domains, where users depend on local forecasts
7
http://www.windfinder.com/ for specific needs.6. ACKNOWLEDGMENTS [13] B. Vila, A. Gómez, C. Cortizas, P. Dias, M. Hermida,
This work is financed by the ERDF – European Regional M. Oliveira, A. Rocha, and X. Méndez. RAIA
Development Fund through the Operational Programme for Observatory: Visualization of Oceanographic Data
Competitiveness and Internationalisation - COMPETE 2020 under INSPIRE Directive. In Actas das 2as Jornadas
Programme, and by National Funds through the FCT – Fun- de Engenharia Hidrográfica, pages 369 – 372. Instituto
dação para a Ciência e a Tecnologia (Portuguese Foundation Hidrográfico, 2012.
for Science and Technology) within project POCI-01-0145- [14] A. Whiteside and J. D. Evans. Opengis R web
FEDER-006961 coverage service (wcs) implementation standard. Open
Geospatial Consortium, 2008.
7. REFERENCES [15] A. Wun, M. Petrovi, and H.-A. Jacobsen. A system
[1] N. Booij, R. Ris, and L. H. Holthuijsen. A for semantic data fusion in sensor networks. In
third-generation wave model for coastal regions: 1. Proceedings of the 2007 inaugural international
model description and validation. Journal of conference on Distributed event-based systems, pages
Geophysical Research: Oceans (1978–2012), 75–79. ACM, 2007.
104(C4):7649–7666, 1999.
[2] P. Cornillon, J. Gallagher, and T. Sgouros. Opendap:
Accessing data in a distributed, heterogeneous
environment. Data Science Journal, 2(5):164–174,
2003.
[3] J. de La Beaujardiere. Opengis R web map server
implementation specification. Open Geospatial
Consortium, 2006.
[4] I. Directive. Directive 2007/2/ec of the european
parliament and of the council of 14 march 2007
establishing an infrastructure for spatial information
in the european community (inspire), 2007.
[5] B. Domenico. Ogc network common data form
(NetCDF) core encoding standard version 1.0. Open
Geospatial Consortium, 10:e090r3, 2011.
[6] R. F. C. Gomes. Visualização de dados oceanográficos
espácio-temporais multivariáveis em dispositivos
móveis. Master’s thesis, Universidade do Porto, 2014.
[7] D. B. Haidvogel, H. Arango, W. P. Budgell, B. D.
Cornuelle, E. Curchitser, E. Di Lorenzo, K. Fennel,
W. R. Geyer, A. J. Hermann, L. Lanerolle, et al.
Ocean forecasting in terrain-following coordinates:
Formulation and skill assessment of the regional ocean
modeling system. Journal of Computational Physics,
227(7):3595–3624, 2008.
[8] H. L. Jenter and R. P. Signell. Netcdf: A
public-domain-software solution to data-access
problems for numerical modelers. In Preprints of the
American Society of Civil Engineers Conference on
Estuarine and Coastal Modeling, volume 72, 1992.
[9] U. John Caron and E. Davis. UNIDATA’s THREDDS
data server. In 22nd International Conference on
Interactive Information Processing Systems for
Meteorology, Oceanography, and Hydrology, 2006.
[10] J. Michalakes, S. Chen, J. Dudhia, L. Hart, J. Klemp,
J. Middlecoff, and W. Skamarock. Development of a
next generation regional weather research and forecast
model. In Developments in Teracomputing:
Proceedings of the Ninth ECMWF Workshop on the
use of high performance computing in meteorology,
volume 1, pages 269–276. World Scientific, 2001.
[11] D. Nebert, A. Whiteside, and P. Vretanos. Opengis R
catalogue services specification. Open Geospatial
Consortium, 2007.
[12] H. Tolman, M. Accensi, H. Alves, F. Ardhuin,
J. Bidlot, N. Booij, A.-C. Bennis, T. Campbell, D. V.
Chalikov, J.-F. Filipot, et al. User manual and system
documentation of wavewatch iii version 4.18. 2014.You can also read