The Impact of Different Weather Files on London Detached Residential Building Performance-Deterministic, Uncertainty, and Sensitivity Analysis on ...
←
→
Page content transcription
If your browser does not render page correctly, please read the page content below
sustainability

Article
The Impact of Different Weather Files on London
Detached Residential Building
Performance—Deterministic, Uncertainty, and
Sensitivity Analysis on CIBSE TM48 and CIBSE
TM49 Future Weather Variables Using CIBSE TM52
as Overheating Criteria
Joseph Amoako-Attah and Ali B-Jahromi *
 Department of Civil and Built Environment, School of Computing and Engineering, University of West London,
 London W5 5RF, UK; Joseph.Amoako-Attah@uwl.ac.uk
 * Correspondence: ali.jahromi@uwl.ac.uk; Tel.: +44-0208-231-2270

 Academic Editor: Umberto Berardi
 Received: 18 August 2016; Accepted: 8 October 2016; Published: 22 November 2016

 Abstract: Though uncertainties of input variables may have significant implications on building
 simulations, they are quite often not identified, quantified, or included in building simulations results.
 This paper considers climatic deterministic, uncertainty, and sensitivity analysis through a series
 of simulations using the CIBSE UKCIP02 future weather years, CIBSE TM48 for design summer
 years (DSYs), and the latest CIBSE TM49 DSY future weather data which incorporates the UKCP09
 projections to evaluate the variance and the impact of differing London future weather files on
 indoor operative temperature of a detached dwelling in the United Kingdom using the CIBSE TM52
 overheating criteria. The work analyses the variability of comparable weather data set to identify
 the most influential weather parameters that contribute to thermal comfort implications for these
 dwellings. The choice of these weather files is to ascertain their differences, as their development is
 underpinned by different climatic projections. The overall pattern of the variability of the UKCIP02
 and UKCP09 Heathrow weather data sets under Monte Carlo sensitivity consideration do not seem
 to be very different from each other. The deterministic results show that the operative temperatures
 of the UKCIP02 are slightly higher than those of UKCP09, with the UKCP09 having a narrow range
 of operative temperatures. The Monte Carlo sensitivity analysis quantified and affirmed the dry bulb
 and radiant temperatures as the most influential weather parameters that affect thermal comfort
 on dwellings.

 Keywords: building simulation; operative temperature; CIBSE overheating criteria; future weather;
 uncertainty and sensitivity analysis; CIBSE TM48; CIBSE TM49; CIBSE TM52

1. Introduction
     There is a direct bearing of changes in climatic conditions on buildings in relation to buildings
energy performance and thermal comfort. In building performance practice, it is imperative to secure
reliable formatted multi-year weather files which have been prepared from reliable meteorological
predictions to assess the energy performance and overheating risk in buildings [1–5].
     In 2002, the Department for Environment, Food and Rural Affairs as part of the UK climate impacts
program commissioned and funded the work on the UK climate projections, UKCIP02 [6]. This fourth
generation of climate change is deterministic climate projection, which gives a single outcome for a
specific variable at a given location [7]. The Climate Change Scenarios for the United Kingdom: The

Sustainability 2016, 8, 1194; doi:10.3390/su8111194                      www.mdpi.com/journal/sustainability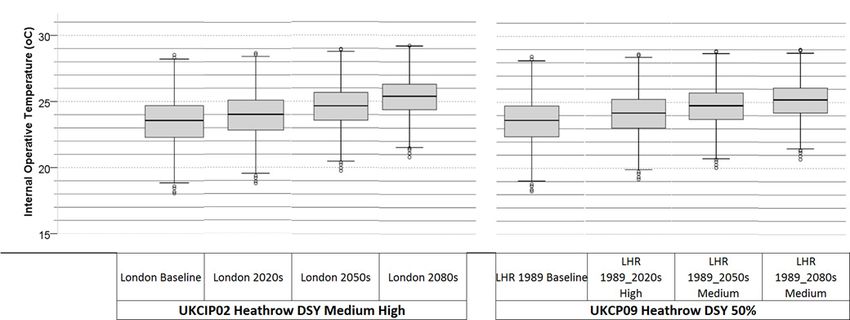
Sustainability 2016, 8, 1194                                                                        2 of 18

UKCIP02 Scientific Report acknowledged that the UKCIP02 scenarios do not incorporate the entire
range of possible future scenarios, as no probabilities were appended to the four climatic scenarios [6].
      In 2009, the UK Climate Projections (UKCP09), the fifth and most comprehensive prediction of
climate change projections was published by the United Kingdom Impacts Programme which has a
collective contribution from the Met Office Hadley Centre, UK Climate Impacts Programme and over
thirty different organisations [7] to provide practical support for effective adaptation to organisations
whose work and functions are underpinned by climate change [7]. One of the key differences between
the UKCIP02 and UKCP09 projections lies in the methodologies used in producing them. The UKCP09
scenarios are underpinned by probabilities of climate change based on quantification of the known
sources of uncertainty. This aspect of the UKCP09 scenarios makes it supersede the UKCIP02 scenarios
that are based only on a variant of one (Met Office) model [7].
      The UKCP09 has deferring properties and characteristics when compared with UKCIP02. One key
difference is that the UKCIP02 data generation is based on four of the six marker projected emission
scenarios of the IPCC Special Report on Emission Scenarios (SRES) of high, medium-high, medium-low,
and low, which underpin the United Kingdom’s Meteorological Office Hadley Centre (MOHC) Climate
Change Model (HadCM3) future global climate model (CIBSE 2009). On the other hand, the UKCP09
future projected emissions scenarios are underpinned by three of the six marker emission scenarios of
the IPCC Special Report on Emission Scenarios of A1F1, A1B, and B1 scenarios, namely high, medium,
and low emission scenarios, respectively [6,8,9].
      In addition, the UKCIP02 variations are mapped to the MOHC HadRM3 regional climate models
(RCM) to simulate climatic variations on a 50 km grid RCM spatial resolution [6]; UKCP09 scenarios,
however, include pattern-scaling and down scaling uncertainty and have a greater RCM spatial
resolution of 25 km, grid coupled with a 5 km resolution for a weather generator [7].
      The output of climate models of the UKCIP02 and UKCP09 cannot be directly used in building
simulation practice. Downscaling of annual, seasonal, or monthly outputs to hourly data is required.
In 2008, the Chartered Institution of Building Services Engineers (CIBSE) released two sets of future
weather files, the test reference years (TRYs) and the design summer years (DSYs) based on the
UKCIP02 climate projections. The methodology used to produce the CIBSE future weather files was
the ‘morphing’ time series adjustment [10] methodology that adjusted the historic weather files to
the climate projection [8,11]. The first TRY typical year was based on direct observation of weather
source baseline period of 1983–2004 [8]. These weather data sets are based on observed measurements
and are deterministic in nature [11,12]. With the release of UKCP09 probabilistic climate projections,
it was imperative to develop new methodologies that take cognisance of the probabilistic nature of
the UKCP09 climate projections to advance the improvement of building simulation weather files.
The Engineering and Physical Sciences Research Council (EPSRC) in 2008 funded four projects to
utilize the probabilistic UKCP09 to produce weather files for building simulation analysis. CIBSE, on
the other hand, have sought potential alternatives (with the morphing methodology in view) to offer
weather files for building simulations based on the UKCP09 probabilistic climate projections [11].
      The CIBSE TRY weather files as representative weather years for building energy performance
analysis are not suitable for overheating analysis; hence, the DSY weather files were developed [13].
The method for developing the DSY weather files is simple when compared with that of the TRY
weather files [13]. The CIBSE DSY is a single complete weather year which gives a near extreme
weather year. CIBSE has currently developed a new methodology for producing DSYs based on the
UKCP09 probabilistic climate projections for use in building simulations. This offers a better correlation
between the likelihood of the DSY occurring and the likelihood of building overheating [14]. These
new DSYs for London take into consideration the geographical location, the impact of the urban heat
island effect, and future climate change, when performing building simulation summer overheating
analysis for London [14,15]. The new DSY weather files for London include two additional weather
stations of London Weather Centre (LWC) and Gatwick Airport (GTW). This offers different levels of
overheating risk assessment for different locations in London, namely urban, intermediate urban, and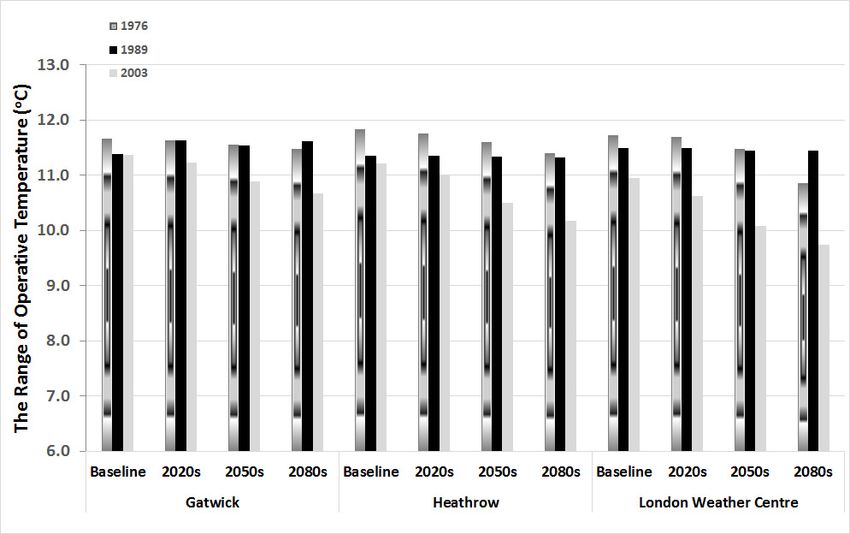
Sustainability 2016, 8, 1194                                                                       3 of 18

suburban locations. Moreover, the new DSYs include the two additional years of 1976 (a year with
two-week extreme heat wave) and 2003 (a year with more persistent warm summer) as the earlier DSY
based on 1989 weather data from London Heathrow Airport (LHR) does not represent a sufficiently
warm year for overheating risk assessment in buildings [14]. In addition, it considers three greenhouse
emissions scenarios of high, medium, and low, three future periods of 2020s, 2050s, and 2080s, and
differing levels of probabilities of 10th, 50th, and 90th percentiles [14,15].

1.1. Justification for the Choice of CIBSE Weather Files
     Over the years, different approaches for developing weather data series for building performance
analysis have been developed [7,16]. In the UK, basically two differing methodologies stand out in
creating hourly weather files for use in building simulation practice; the ‘morphing’ methodology
which is the current industrial standard by CIBSE, which adjusted the historic weather files to climatic
projections, and the development of various probabilistic projections of hourly weather data sets by
the use of the UKCP09 weather generator.
     The UKCP09 weather generator is a stochastic tool that uses daily precipitation to create other
weather outputs of daily and hourly variables on a 5 km grid for a historical period of 1961–1990 [7].
This offers an advantage due to greater spatial resolution. In addition, the weather generator is
suitable for future TRY and DSY weather data sets for building performance analysis [11]. However,
the CIBSE weather data sets developed using the morphing methodology are based on observed
climatic periods and thus have limited uncertainties which could affect the baseline weather data [13].
Without the implementation of change factor corrections, the CIBSE weather data sets could result in
overestimating future climate change variations due to changes in differences of climates reference
points: 1961–1990 for the weather generator and 1983–2004 for the earlier CIBSE historic TRY and DSY
weather files [11,13].
     The choice of the CIBSE morphing methodology as against the weather generation data is based
on its reliability [14]. The weather generator does not produce extreme events [11]. The weather
generator output of weather data sets years is not as warm in terms of the Weighted Cooling Degree
Hours (WCDH) criterion used in the historical data development of the new CIBSE DSYs. This is
because the ‘extremes of the temperature distribution are not clustered together into particular warm
years to the extent as they are in the observed data’ [14].
     Although the monthly average climate over the years changes, one advantage of the morphing
methodology in the non-variant underlying characteristics of the TRY and DSY weather data sets,
which facilitates a direct comparison between the present and future building performance analyses.
On the other hand, there are differences in basic weather characteristics such as the timing and severity
of warm spells between the timelines in using the weather generator [11]. Furthermore, the current
CIBSE DSY weather data sets for London consider the urban heat island effects in future weather files,
whilst this consideration is absent in the UKCIP09 weather generator.
     The use of the weather generator to statistically produce many thousands of historic and
probabilistic future weather data at a high spatial resolution provides the significant advantage of a
better idea of a complete data set for overheating risk assessment when compared with the observable
weather data [17]. The weather generator has an advantage over the morphing methodology.
It produces certain weather variables in place of missing data [11] when considering observed data
independently. However, the many files generated pose a computational challenge to resources not
readily available in building simulation practices [11,13].
     A readily acceptable methodology should produce an output of weather data sets that is consistent
with currently used data sets and augment the use of standardised weather data sets for use in building
energy and thermal performance analysis. The weather generator’s outputs of daily precipitation,
partial vapour pressure, relative humidity, maximum temperature, minimum temperature, sunshine
fraction, direct radiation, and potential evapotranspiration are insufficient for use within thermal
simulation for building energy and thermal performance analysis. Key missing parameters such
Sustainability 2016, 8, 1194                                                                         4 of 18

as wind speed, wind direction, atmospheric pressure, and cloud cover are essential in creating
weather files of the same format, as is used in CIBSE weather data sets for building simulation
software [11,13,17].
       Although the weather generator method is more versatile than the morphing method, in terms
of observed data and location, the large amount of weather data produced is of a disadvantage in
simulation practice [16]. The CIBSE weather files based on the morphing methodology are used in this
work due to the consistency between the present available observable historic weather files and those
of the future files and a platform for direct comparison of standardised weather data sets for energy
and thermal performance analysis. The majority of building performance simulators in the UK make
use of CIBSE weather files as trusted consistently replicable weather data sets in their work, as it offers
a single data set for a particular location, climatic period, emission scenario, and probability level for
all designers to compare building performances [16,18]. This serves as the primary reason for the use
of CIBSE weather data sets for this work.
       This paper analyses the variability of the selected comparable CIBSE TM48 and CIBSE TM49
weather data set on internal operative temperatures to identify the most influential weather parameters
that contribute to indoor operative temperatures in three locations in London. Uncertainty and
sensitivity analysis of the CIBSE weather data sets based on the deterministic single projection of
UKCIP02 and the CIBSE weather data sets based on the probabilistic UKCP09 projections is performed
to ascertain the contrast between the two files. In addition, the 50th percentile central estimate weather
files for Heathrow 1989 was used to provide comparable outputs in relation to the CIBSE’s 2008 weather
files. Moreover, the UKCP09 A1B (medium emission scenario) and the UKCIP02 A2 (medium-high
emission scenario) are used for comparative analysis, as the two emission scenarios are closer in the
chosen time period.

1.2. Monte Carlo Uncertainty and Sensitivity Analysis
     The key to determining the target output of thermal comfort is a comprehensive building model
and credible input variable information [19]. Though uncertainties of input variables may have
significant implications on building simulations, they are quite often not identified, quantified,
or included in building simulations [19]. Most simulation programs do not incorporate uncertainties in
input and thus result in outputs of single estimates [19]. Uncertainties in building energy simulations
are associated with the variability of the weather data, the thermo-physical properties of the buildings
in relation to the building fabric and systems, and the associated internal heat gains coupled with
variable occupant behaviour. The occurrence of uncertainties is attributed to incomplete specifications,
inadequate knowledge of building characteristics, and a lack of specifications in operating conditions
in relation to weather, internal heat gains, and system set points [19]. It may also relate to inherent
simplifications of a model and a lack of sufficient input data information [20]. The impact of these
input uncertainties influence the accuracy of building energy simulations in spite of the efficacy of
the applied model [19]. Uncertainty analysis is thus used to determine a confidence limit for a model
output [21].

1.3. Thermal Comfort
     Thermal comfort is defined as that condition of mind that expresses satisfaction with the thermal
environment [22]. It is one of the main criteria in accessing the overall post occupancy of building [23]
and involves the interactions between the climate, the building with its services, and variable occupant
behaviour [24]. Global thermal comfort models fall into two broad classes: the adaptive [25] and
the rational [26]. Adaptive models are generally based on field investigations aimed to correlate
acceptable indoor conditions as a function of the mean outdoor temperature [27]. On the contrary,
the rational approach is based on the correlation of the thermal sensation with the heat balance
equation on the human body [28], which is affected by the indoor microclimate (air temperature,
mean radiant temperature, humidity, and air velocity) and personal parameters (activity and clothing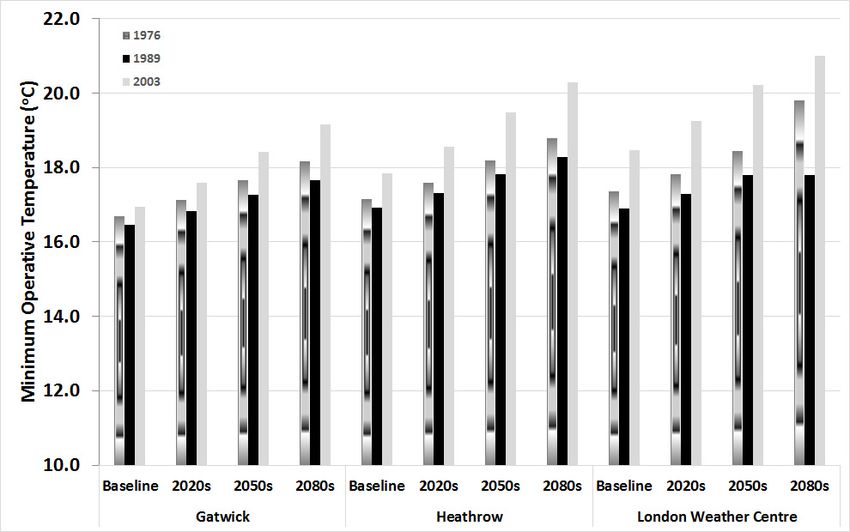
Sustainability 2016, 8, 1194                                                                        5 of 18

thermophysical properties). For both approaches and under specific hypotheses in terms of the values
of the main variables affecting the thermal sensation [26], the operative temperature can be used as an
indicator of indoor comfort conditions.
     Indoor operative temperature is a simplified measure of thermal comfort. Operative temperature
can be calculated by averaging the air temperature with the mean radiant temperature with a weighting
factor depending upon the air velocity [22]. Studies indicate that comfort temperature is closely related
to the indoor operative temperature [29,30]. Too low or too high operative temperatures affect the
thermal comfort of building occupants in general [31].
     This paper focuses on using building simulation tools to produce indoor climatic data in the form
of operative temperatures as a means of expressing thermal comfort based on CIBSE TM52 overheating
criteria that is underpinned by the adaptive thermal comfort models. The CIBSE TM52 criteria is for
naturally ventilated buildings [24].

2. Materials and Methods
     In this work, Monte Carlo approaches are used in estimating climatic deterministic, uncertainty,
and sensitivity analysis through a series of simulations using the UK Charted Institution of Building
Services Engineers CIBSE UKCIP02 future weather years, CIBSE TM48 for design summer years (DSY),
and the latest CIBSE TM49 DSY future weather data which incorporates the UKCP09 projections,
to evaluate the variance in climatic projections and the impact of future climate change on the thermal
comfort of a detached dwelling in the United Kingdom using the CIBSE TM52 overheating criteria.
The global sensitivity analysis used in the study incorporates the standardised regression coefficient
(SRC) and the partial correlation coefficient as sensitivity indices to identify the key parameters
that contribute to thermal comfort implications in the dwellings due to climate change. In building
simulation practices, it is acceptable for two different sensitivity analysis methods to be used to
ascertain their robustness and further inspire confidence in the results [32].
     The essence for the climatic sensitivity analysis is based on the following:

(1)    the limitations of the CIBSE TM48 morphing methodology in producing certain variables that
       independently have no relationship to the probabilistic consideration of the UKCP09 CIBSE TM49
       weather series, making the output different from the latest weather data series;
(2)    differences in the baseline periods for the two climate projections: 1983–2004 and 1961–1990
       baselines for the UKCIP02 and UKCP09 projections, respectively;
(3)    a consideration of the London urban heat island effect in the CIBSE TM49 weather files leading
       to the generation of three different weather data sets for London; and
(4)    a consideration of the extreme heat waves experienced in 1976 and 2003 years to examine
       overheating risk under different scenarios.

2.1. Thermal Analysis Simulation (TAS) 3D Modelling
     It is generally recommended that for naturally ventilated buildings, the 50th percentile (best guess)
projections and the medium greenhouse gas emission scenario has to be used in the building simulation
analysis [33]. This choice of UKCP09 future weather file based on the 50th percentile of external
temperature and 2050s emission scenarios was used because of its usage in other studies. For example,
Mavrogianni et al. in 2012 used this criterion for their dynamic thermal simulation work for identifying
factors that affect the high indoor summer temperatures in London dwellings [33]. The medium-high
climate change emission scenario was chosen in the UPCIP02 weather file consideration. The CIBSE
TM36, using dynamic thermal modelling, offered a quantitative assessment of the risks of overheating
in 13 case study buildings comprising of houses, offices, and schools for three locations in the UK,
using the UKCIP02 medium-high climate change scenario and the CIBSE Guide A (2006) [34] as the
overheating criteria [35].
Sustainability 2016, 8, 1194 6 of 18
The various modelling and simulation parameters of Building Summary, Calendar, Building
Elements, Zones, Internal conditions (which include thermostat set up, infiltration and ventilation,
occupancy, lighting and equipment details), Schedule, and Aperture Types, which were used to
populate and simulate each building, are maintained with the only variant being the weather data.
For details of the model, that is u-values, occupancy patterns, and other modelling and simulation
assumptions and parameters, as well as the accuracy of the internal temperatures within the model,
please see Appendix A.
A series of scenarios based on the current and the future climate variables on different timelines
of 2020s, 2050s, and 2080s with their respective medium-high carbon scenarios for the CIBSE TM48
UKCIP02 weather files and similar time slice of 2020s, 2050s, and 2080s for CIBSE TM49 UKCP09
weather files are simulated for Gatwick Airport, London Weather Centre and Heathrow Airport.
2.2. Developing Multivariate Linear Regression
The case study is based on a building simulation and global sensitivity analysis that explores
the analysis of uncertainties and sensitivities related to climate change variability. The IBM SPSS
statistics Monte Carlo sensitivity analysis tool is used to identify the influential parameters that affect
the internal operative temperature (thermal comfort) of dwellings.
The CIBSE weather data set used in the EDSL TAS simulation has seven key weather variables
of global horizontal radiation, cloud cover, relative humidity, wind direction, wind speed, diffused
horizontal radiation, and dry bulb temperature. Table 1 indicates the input parameters with their
probability distributions for the uncertainty and sensitivity analysis for the climate change impact on
thermal comfort. The CIBSE weather data sets used in this study are the design summer year (DSY)
CIBSE TM48 UKCIP02 weather files and the CIBSE TM49 UKCP09 weather files for Gatwick Airport,
London Weather Centre, and Heathrow Airport.
Table 1. Input parameters with their probability distributions for the uncertainty and sensitivity
analysis for the climate change impact on thermal comfort.
Input Parameter Acronym Units Probability Distribution
Global Radiation GR W/m2 Normal
Diffused Radiation DR W/m2 Normal
Cloud Cover CC (0–1) Normal
External Temperature ET (◦ C) Normal
External Humidity EH (%) Normal
Wind Direction WD (◦ ) Normal
Wind Speed WS (m/s) Normal
Average Radiation Temperature ART (◦ C) Normal
Average Dry Bulb Temperature ADBT (◦ C) Normal
Daily Hourly Exponentially Weighted
DHEWRMT (◦ C) Normal
Running Mean Temperature
The detached dwelling used as the case study is 49 Carnation Drive, a 1995 three-bedroom house
located at Bracknell, Berkshire, about 48 km from Central London, the closest weather station for
CIBSE TM48 UKCIP02. For CIBSE TM49 UKCP09 weather files, the case study building location is
located at 48.87 km, 48 km, and 18.71 km respectively from Gatwick Airport, London Weather Centre
and Heathrow Airport.
EDSL TAS simulations were performed on variations of climate change as input parameters and
consider uncertainties in various CIBSE DSY weather files in predicting indoor operative temperature
as a thermal comfort indicative parameter. The EDSL TAS coupled with the developed Excel CIBSE
TM52 overheating criteria historical data were then sent to IBM SPSS statistical software to create a
multivariate linear regression XML model. The aim of this multivariate linear regression model was to
capture the complex thermal interaction of parameters used in the EDSL TAS program. The uncertaintySustainability 2016, 8, 1194 7 of 18
and sensitivity analysis on the multivariate linear regression model was then subsequently analysed
using IBM SPSS statistics software.
2.3. Uncertainty and Sensitivity Analysis Due to Climate Change
This work employs the box and whiskers plot as one of the effective methods used in uncertainty
analysis. The box and whiskers plot presents a summary of the important data set characteristics of
the maximum and minimum values, the median, the dispersion, asymmetry, the extreme values, and
the percentile rank analysis [36].
The purpose of sensitivity analysis in building performance modelling and simulation and
observational study is to explore the uncertainty of the key input parameters that influence
the prediction of the building performance parameters and to investigate the important
varying contribution of different design parameters with respect to building performance [12,37].
The regression sensitivity analysis is mostly used in building performance analysis due to its
computational and results interpretation simplicity [37].
The standardised regression coefficient (SRC) or the beta value method sensitivity analysis is
widely used in the literature [12,37,38] and as it offers variability measure of independent input
parameters in a linear regression model. The SRC offers a quantitative global sensitivity analysis index
which is robust and easy to use [20]. It gives a quantitative measure of parameter sensitivity and
influences the different input parameters on the output with the sign indicating the direction of the
parameter sensitivity to the target parameter [38].
The standardised regression coefficient (SRC) and partial correlation coefficient (PCC) are chosen
as regression sensitivity methods because they are appropriate for linear models [38]. The partial
correlation assists in the examination of the relationship or association between two variables whilst
controlling the other variables. Whilst the two methods may give the same results in the case of
uncorrelated inputs, differences in results may show if there are correlated inputs as only PCC is
appropriate for both correlated and uncorrelated inputs, but SRC is only suitable for uncorrelated
inputs [38]. The standardised rank regression coefficient is not used, as it is only applicable for
non-linear models [38].
Sensitivity analysis involves the changes in different design parameters to ascertain their relative
influence on the target variable. The developed multivariate linear regression XML model is used to
run the uncertainty and sensitivity analysis in the IBM SPSS statistical software. The Monte Carlo
simulation was set to 100,000 iteration runs for each target parameter to provide adequate coverage
of the solution space. The results of the uncertainty analysis are presented as box and whiskers
plots. The box and whiskers plot also shows the variations in sensitivity measures for various input
parameters. The IBM SPSS software is then used to calculate the standardised regression coefficient
(SRC) and partial correlation coefficient (PCC) to ascertain the input parameters that are most sensitive
and thus explain the high variability in the models.
3. Results
3.1. Deterministic Analysis
Figure 1 illustrates the deterministic analysis results in the form of histogram. The analysis
compares the maximum, minimum, average, and range of internal operative temperatures using
CIBSE TM52 as overheating criteria and of UKCIP02 Heathrow DSY medium-high and the UKCP09
Heathrow 1989 medium 50% probabilistic scenarios weather data sets.Sustainability 2016, 8, 1194 8 of 18
Sustainability 2016, 8, 1194 8 of 17
Figure 1. Internal operative temperatures for UKCIP02 Heathrow DSY medium-high and UKCP09
Heathrow 1989 medium 50% probabilistic
probabilistic scenarios.
scenarios.
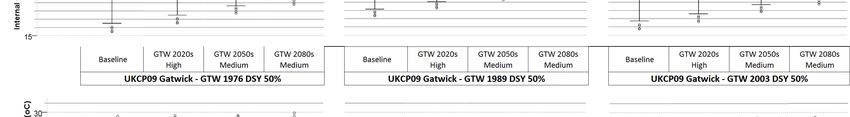
Figures 2–5 illustrate the deterministic analysis results in the form of histogram analysis
There is a marginal difference in maximum operative temperatures for the Heathrow DSY
comparison of the maximum, minimum, average and range of operative temperatures of UKCP09
medium-high and UKCP09 Heathrow 1989 medium 50% probabilistic scenarios for the baseline,
Heathrow DSY Medium 50% probabilistic scenarios for 1976, 1989 and 2003 and the time series
2020s, and 2050s weather data sets, with the former being slightly higher. For the 2080s scenarios,
analysis of internal operative temperatures using CIBSE TM52 as overheating criteria.
the difference in operative temperature for the two weather data sets is about 0.5 ◦ C. The minimum
As expected, there is a progressive increase in maximum internal operative temperatures for
operative temperature variability indicates a similar trend of marginal difference. The minimum
1976 and 2003 for all timeline scenarios. Gatwick has the lowest maximum operative temperatures
operative temperatures for the UKCP09 Heathrow DSY 1989 medium 50% probabilistic scenarios’
whilst London Weather Centre is observed to have the highest operative temperatures. The difference
weather data sets for the baseline, the 2020s, and 2050s timelines show slightly higher temperatures
in the maximum operative temperatures between the various timeline scenarios of Gatwick when
in the range of about 0.1 ◦ C for all respective comparative scenarios. The 2080s scenario variation is
compared with Heathrow and London Weather Centre show a difference of about 0.6 °C and 1.0 °C
the opposite of that observed in other timelines with the UKCIP02 showing slightly higher minimum
for Heathrow and London Weather Centre respectively. The highest maximum operative
temperatures. The average internal operative temperatures for the two weather data sets’ respective
temperatures for the London Weather Centre timelines could be attributed to the urban heat island
timelines show a strong similarity in the trend of average operative temperatures. The range operative
effect. Similar trends are observed in Figure 3 which compares the minimum internal operative
temperatures for the UKCIP02 Heathrow DSY medium-high are slightly higher than their respective
temperatures for the three locations using UKCP09 1976, 1989 and 2003 medium 50% probabilistic
comparative timelines for the UKCP09 Heathrow 1989 medium 50% probabilistic scenarios, ranging
weather data set◦scenarios with overheating analysis based on CIBSE TM52 adaptive thermal comfort
from about 0.25 C to 0.42 ◦ C for the baseline and 2080s scenarios respectively.
criteria.
Figures 2–5 illustrate the deterministic analysis results in the form of histogram analysis
The average operative temperatures for the three locations indicated as expected, with London
comparison of the maximum, minimum, average and range of operative temperatures of UKCP09
Weather Centre having the highest average temperatures followed by Heathrow. Gatwick has the
Heathrow DSY Medium 50% probabilistic scenarios for 1976, 1989 and 2003 and the time series analysis
least average operative temperatures when compared to the other two locations. The 1989 medium
of internal operative temperatures using CIBSE TM52 as overheating criteria.
50% probabilistic weather data set appears to have slightly higher average operative temperatures of
about 0.5 °C when compared to all scenarios of the 1976 and 2003 weather data sets. Comparison of
the range operative temperatures shows the 2003 medium 50% probabilistic weather data set to have
the lowest value when compared to the other years.Sustainability 2016, 8, 1194 9 of 18
Sustainability 2016, 8, 1194 9 of 17
Figure
Figure 2.
2. A
A comparison
comparison of
of maximum
maximum internal
internal operative
operative temperatures
temperatures for
for Gatwick,
Gatwick, Heathrow
Heathrow and
and
London
London Weather
Weather Centre using UKCP09 1976,1976, 1989
1989 and
and 2003
2003 medium
medium 50%
50% probabilistic
probabilistic weather
weather data
data
set
set scenarios
scenarios with
with overheating
overheating analysis based on CIBSE TM52 adaptive thermal comfort criteria.
Figure 3. A comparison of minimum internal operative temperatures for Gatwick, Heathrow and
London
Figure 3.Weather Centre using
A comparison UKCP09internal
of minimum 1976, 1989 and 2003
operative medium 50%
temperatures forprobabilistic weather data
Gatwick, Heathrow and
set scenarios
London withCentre
Weather overheating
using analysis
UKCP09based
1976, on CIBSE
1989 TM52medium
and 2003 adaptive thermal
50% comfortweather
probabilistic criteria. data
set scenarios with overheating analysis
analysis based
based on
on CIBSE
CIBSE TM52
TM52 adaptive
adaptive thermal
thermal comfort
comfort criteria.
criteria.Sustainability 2016, 8, 1194 10 of 18
Sustainability 2016, 8, 1194 10 of 17
Figure
Figure 4.
4. A comparison
A comparison
3. A comparisonofof average
average internal
ofminimum internaloperative
internal operativetemperatures
operative temperatures for
temperatures for Gatwick,
for Gatwick, Heathrow
Gatwick, Heathrow and and
London Weather Centre using UKCP09 1976, 1989 and 2003 medium 50% probabilistic weather
London Weather Centre using UKCP09 1976, 1989 and 2003 medium 50% probabilistic weather data data
set
set scenarios
scenarios with
with overheating
overheating analysis
analysis based
analysis based on
based on CIBSE
on CIBSE TM52
CIBSE TM52 adaptive
TM52 adaptive thermal
adaptive thermal comfort
thermal comfort criteria.
comfort criteria.
criteria.
Figure
Figure 5.
5. A
A comparison of the range
range internal
internal operative
operative temperatures
temperatures for
for Gatwick,
Gatwick, Heathrow
Heathrow and
Figure 5. A comparison
comparison ofof the
the range internal operative temperatures for Gatwick, Heathrow and
and
London
London Weather
Weather Centre
Centre using
using UKCP09
UKCP09 1976,
1976, 1989
1989 and
and 2003
2003 medium
medium 50%
50% probabilistic
probabilistic weather
weather data
data
London Weather Centre using UKCP09 1976, 1989 and 2003 medium 50% probabilistic weather data
set
set scenarios
scenarios with
with overheating
overheating analysis based
analysis based on
based on CIBSE
on CIBSE TM52
CIBSE TM52 adaptive
TM52 adaptive thermal
adaptive thermal comfort
thermal comfort criteria.
comfort criteria.
criteria.
set scenarios with overheating analysis
3.2. Uncertainty Analysis—Box and Whiskers Plots
As expected, there is a progressive increase in maximum internal operative temperatures for
Figure
1976 and 20036 illustrates the comparison
for all timeline scenarios.ofGatwick
the UKCIP02
has theHeathrow DSY medium-high
lowest maximum and UKCP09
operative temperatures
Heathrow DSY 1989 medium 50% probabilistic weather data set effect on internal
whilst London Weather Centre is observed to have the highest operative temperatures. The difference operative
temperature
in the maximumto ascertain
operativethetemperatures
impact of climate change
between on thermal
the various comfort
timeline of residential
scenarios buildings.
of Gatwick when
The
compared with Heathrow and London Weather Centre show a difference of about 0.6 C and 1.0The
box and whiskers plot is a graphical method of representing data through their quartiles.
◦ ◦C
plots show the uncertainty associated with Monte Carlo simulation of overheating
for Heathrow and London Weather Centre respectively. The highest maximum operative temperatures analysis with
internal operative
for the London temperatures
Weather Centre timelines could be1parameter
as the output attributed using the various
to the urban weather
heat island scenarios
effect. Similar
indicated above as the only variants. The ten (10) input variables as displayed in Table 1 are used in
the analysis and the same sample size of 3672 hourly data between 1 May and 30 September as
specified in the CIBSE TM52 overheating criteria which were used in each analysis.Sustainability 2016, 8, 1194 11 of 18
trends are observed in Figure 3 which compares the minimum internal operative temperatures for
the three locations using UKCP09 1976, 1989 and 2003 medium 50% probabilistic weather data set
scenarios with overheating analysis based on CIBSE TM52 adaptive thermal comfort criteria.
The average operative temperatures for the three locations indicated as expected, with London
Weather Centre having the highest average temperatures followed by Heathrow. Gatwick has the least
average operative temperatures when compared to the other two locations. The 1989 medium 50%
probabilistic weather data set appears to have slightly higher average operative temperatures of about
0.5 ◦ C when compared to all scenarios of the 1976 and 2003 weather data sets. Comparison of the
range operative temperatures shows the 2003 medium 50% probabilistic weather data set to have the
lowest value when compared to the other years.
3.2. Uncertainty Analysis—Box and Whiskers Plots
Figure 6 illustrates the comparison of the UKCIP02 Heathrow DSY medium-high and UKCP09
Heathrow DSY 1989 medium 50% probabilistic weather data set effect on internal operative
temperature to ascertain the impact of climate change on thermal comfort of residential buildings.
The box and whiskers plot is a graphical method of representing data through their quartiles. The plots
show the uncertainty associated with Monte Carlo simulation of overheating analysis with internal
operative temperatures as the output parameter using the various weather scenarios indicated above
as the only variants. The ten (10) input variables as displayed in Table 1 are used in the analysis and
the same sample size of 3672 hourly data between 1 May and 30 September as specified in the CIBSE
Sustainability 2016, 8, 1194 11 of 17
TM52 overheating criteria which were used in each analysis.
Figure 6. Box
Figure 6. Boxand
and whiskers
whiskers plots
plots ofUKCIP02
of the the UKCIP02 Heathrow
Heathrow DSY medium-high
DSY medium-high and Heathrow
and UKCP09 UKCP09
Heathrow DSY 198950%
DSY 1989 medium medium 50% probabilistic
probabilistic weather
weather data set. data set.
A comparison of the median lines shows that the 50th percentiles of the UKCP09 for the 2020s
A comparison of the median lines shows that the 50th percentiles of the UKCP09 for the 2020s
and 2050s are slightly higher than that of the UKCIP02 weather projections, whilst the opposite is
and 2050s are slightly higher than that of the UKCIP02 weather projections, whilst the opposite is
realised with regard to the 2080s weather data set. However, the overall pattern of variability of the
realised with regard to the 2080s weather data set. However, the overall pattern of variability of the
two weather data sets seems to be not very different from each other as analysis of the UKCIP02 and
two weather data sets seems to be not very different from each other as analysis of the UKCIP02
UKCP09 results show that the median changes from 23.5 °C◦ to 25.4 °C and 23.5 °C to 25.3°C
and UKCP09 results show that the median changes from 23.5 C to 25.4 ◦ C and 23.5 ◦ C to 25.3◦ C
respectively. Thus, there is no marked observable effect of change in internal operative temperatures
respectively. Thus, there is no marked observable effect of change in internal operative temperatures
in the two sets of the uncertainty analysis results.
in the two sets of the uncertainty analysis results.
The whiskers of the plots, indicated by the extended vertical lines above and below the plots and
The whiskers of the plots, indicated by the extended vertical lines above and below the plots and
which show the variability of the internal operative temperatures outside the upper (75th percentiles)
which show the variability of the internal operative temperatures outside the upper (75th percentiles)
and lower quartiles (25th percentiles) to the 90th percentile and 10th percentile of the data sets
and lower quartiles (25th percentiles) to the 90th percentile and 10th percentile of the data sets
respectively, also show symmetry pointing to the non-skewedness of the data. The whisker plots
respectively, also show symmetry pointing to the non-skewedness of the data. The whisker plots
progressively decrease along the time lines of the two different weather data sets with the decrease
progressively decrease along the time lines of the two different weather data sets with the decrease
in the UKCP09 Heathrow 1989 DSY Medium 50% probabilistic weather data sets slightly more
pronounced than the UKCIP02 Heathrow DSY medium-high data sets.
The outliers showing the individual points outside the whiskers with 10% probability of
occurrence are virtually similar when comparing the respective timeline scenarios of the two different
weather data sets. The outliers for both the maximum and minimum values generally lie close to the
whiskers’ ends.
Figure 7 illustrates the box plots comparison of the internal operative temperatures reported inSustainability 2016, 8, 1194 12 of 18
in the UKCP09 Heathrow 1989 DSY Medium 50% probabilistic weather data sets slightly more
pronounced than the UKCIP02 Heathrow DSY medium-high data sets.
The outliers showing the individual points outside the whiskers with 10% probability of
occurrence are virtually similar when comparing the respective timeline scenarios of the two different
weather data sets. The outliers for both the maximum and minimum values generally lie close to the
whiskers’ ends.
Figure 7 illustrates the box plots comparison of the internal operative temperatures reported in
relation to the effect of the design summer year (DSY) medium 50% probabilistic scenarios of the 1976,
Sustainability 2016, 8, 1194 12 of 17
1989, and 2003 weather data sets of Gatwick, Heathrow, and London Weather Centre.
Figure 7. Box and whiskers plot comparison of the internal operative temperatures reported in
Figure 7. Box and whiskers plot comparison of the internal operative temperatures reported in relation
relation to the effect of the design summer year (DSY) medium 50% probabilistic scenarios of the 1976,
to the effect of the design summer year (DSY) medium 50% probabilistic scenarios of the 1976, 1989,
1989, and 2003 weather data sets of Gatwick, Heathrow, and London Weather Centre.
and 2003 weather data sets of Gatwick, Heathrow, and London Weather Centre.
In general, the medians for the 2003 scenarios are higher than those of the 1976 scenarios.
In general,
Furthermore, there isofzero
analysis skewedness
Figure of thethe
7 shows that interquartile
medians ofranges and theWeather
the London whiskers. A progressive
Centre timeline
decrease of variability in the length of the interquartile ranges (IQR) is
scenarios are higher than those of their comparative Heathrow timelines scenarios and even observed along thehigher
years,
coupled with a progressive decrease in the whiskers. Thus, the baselines have larger
than those of the Gatwick timeline scenarios. This could be attributed to the urban heat effect in the dispersion for
bothofthe
city box and
London. Asthe whiskers and
anticipated, progressively
the outliers of thedecrease
1976 andalong2003 the timelines.
weather scenarios lie further away
Moreover, the variability of the interquartile range and the
from the whiskers when compared with that of the 1989 data set point towards relative dispersion
moreof extreme
the data internal
set outer
range are temperatures
operative larger in the 1976 and 2003
in those scenarios
years’ weatherthan
datathat
sets.of the 1989 scenario, indicating a clustering of
parameters near the 25th and 75th percentiles and a further large dispersion of the outliers.
As expected,
3.3. Sensitivity the with
Analysis medians of the
SRC and PCC 1989 scenarios Indices
as Sensitivity of Gatwick, Heathrow, and London Weather
Centre are comparatively lower than those of the 1976 and 2003 scenarios. In addition, the interquartile
Figure 8 illustrates the comparison of the standardised regression coefficient (SRC) and the
ranges and the whiskers are relatively smaller. This observation points to a relatively middle clustering
partial correlation coefficients (PCC) of the weather input variables for the UKCIP02 Heathrow and
of data about the medians, 25th percentiles, and the 75th percentiles of the 1989 timeline scenarios,
UKCP09 1989 Heathrow weather data sets. Figure 9 illustrates the comparison of the standardised
indicating less uncertainty in the target variable of internal operative temperatures.
regression coefficient (SRC) and the partial correlation coefficients (PCC) of the weather input
variables for the UKCP09 1976 Gatwick, Heathrow and London Weather Centre weather data sets.
All the sensitivity analysis results, when considering the variation of the weather data alone,
indicate that the internal operative temperature of dwellings is mostly influenced by the radiant
temperature and the dry bulb temperature. The other weather variables of wind direction, wind
speed, external humidity, external temperature, cloud cover, diffused radiation, global radiation, and
the daily hourly exponentially weight running mean temperature have a relatively small impact onSustainability 2016, 8, 1194 13 of 18
In general, the medians for the 2003 scenarios are higher than those of the 1976 scenarios.
Furthermore, analysis of Figure 7 shows that the medians of the London Weather Centre timeline
scenarios are higher than those of their comparative Heathrow timelines scenarios and even higher
than those of the Gatwick timeline scenarios. This could be attributed to the urban heat effect in the
city of London. As anticipated, the outliers of the 1976 and 2003 weather scenarios lie further away
from the whiskers when compared with that of the 1989 data set point towards more extreme internal
operative temperatures in those years’ weather data sets.
3.3. Sensitivity Analysis with SRC and PCC as Sensitivity Indices
Figure 8 illustrates the comparison of the standardised regression coefficient (SRC) and the partial
correlation coefficients (PCC) of the weather input variables for the UKCIP02 Heathrow and UKCP09
1989 Heathrow weather data sets. Figure 9 illustrates the comparison of the standardised regression
coefficient (SRC) and the partial correlation coefficients (PCC) of the weather input variables for the
Sustainability
UKCP09 2016,Gatwick,
1976 8, 1194 Heathrow and London Weather Centre weather data sets. 13 of 17
Figure 8. Comparison of
8. Comparison of the standardised
standardised regression coefficient (SRC) and the partial correlation
coefficients (PCC) of the weather input variables for the UKCIP02 Heathrow and UKCP09 1989
Heathrow weather data sets.
All the sensitivity analysis results, when considering the variation of the weather data alone,
indicate that the internal operative temperature of dwellings is mostly influenced by the radiant
temperature and the dry bulb temperature. The other weather variables of wind direction, wind speed,
external humidity, external temperature, cloud cover, diffused radiation, global radiation, and the daily
hourly exponentially weight running mean temperature have a relatively small impact on the internal
operative temperature. This observation is in consonance with the formulae used in predicting thermalSustainability 2016, 8, 1194 14 of 18
Figure 8. Comparison of the standardised regression coefficient (SRC) and the partial correlation
comfort in CIBSE(PCC)
coefficients TM52ofand
the BSI (2007)input
weather BS EN 15251, for
variables which
the combine
UKCIP02 the air andand
Heathrow radiant temperatures
UKCP09 1989
to obtain the operative temperature.
Heathrow weather data sets.
Sustainability 2016, 8, 1194 14 of 17
Figure 9.9. Comparison
Figure Comparison ofof the
the standardised
standardised regression
regression coefficient
coefficient (SRC)
(SRC) and
and the
the partial
partial correlation
correlation
coefficients(PCC)
coefficients (PCC)ofof
thethe weather
weather input
input variables
variables forUKCP09
for the the UKCP09 1976 Gatwick,
1976 Gatwick, Heathrow Heathrow and
and London
London Weather Centre weather
Weather Centre weather data sets. data sets.
4. Discussion
4. Discussion and
and Conclusions
Conclusions
This study
This study investigated
investigated the
the impact
impact of
of varying
varying weather
weather patterns
patterns on
on the
thethermal
thermalperformance
performance ofof
dwellings. The
dwellings. The work
work is
is underpinned
underpinned by by building
building simulation
simulation models
models in
in TAS
TAScoupled
coupled with
with the
theMonte
Monte
Carlo global sensitivity analysis method using IBM SPSS to indicate that the proposed
Carlo global sensitivity analysis method using IBM SPSS to indicate that the proposed method can method can
facilitate the analysis and prediction of sensitive weather parameters which influence
facilitate the analysis and prediction of sensitive weather parameters which influence the thermal the thermal
comfortof
comfort ofresidential
residentialbuildings.
buildings.
The deterministic analysis results
The deterministic analysis results of
of the
the UKCP09
UKCP09 Heathrow
Heathrow DSYDSY Medium
Medium 50%50% probabilistic
probabilistic
scenarios for
scenarios for 1976,
1976, 1989,
1989, and
and 2003
2003 indicated
indicated aa progressive
progressive increase
increase in
inmaximum
maximum internal
internal operative
operative
temperatures for the 1976 and 2003 years for all timeline scenarios. Gatwick had the lowest
temperatures for the 1976 and 2003 years for all timeline scenarios. Gatwick had the lowest maximum maximum
operative temperatures,
operative temperatures, whilst
whilst London
London Weather
Weather Centre
Centre was
was observed
observed to
to have
havethe
thehighest
highestoperative
operative
temperatures. This affirmed the incorporation of the urban heat island effect of the London Weather
Centre weather data sets of CIBSE TM49, as compared with the Heathrow and Gatwick weather files.
The Monte Carlo uncertainty analysis results of the median lines showed that the 50th
percentiles of the UKCP09 for the 2020s and 2050s are slightly higher than that of the UKCIP02
weather projections, whilst the opposite is realised with regard to the 2080s weather data set.Sustainability 2016, 8, 1194 15 of 18
temperatures. This affirmed the incorporation of the urban heat island effect of the London Weather
Centre weather data sets of CIBSE TM49, as compared with the Heathrow and Gatwick weather files.
The Monte Carlo uncertainty analysis results of the median lines showed that the 50th percentiles
of the UKCP09 for the 2020s and 2050s are slightly higher than that of the UKCIP02 weather projections,
whilst the opposite is realised with regard to the 2080s weather data set. However, the overall patterns
of variability of the two weather data sets do not seem to be very different from each other, as analysis
of the UKCIP02 and UKCP09 results show that the median changes from 23.5 ◦ C to 25.4 ◦ C and 23.5 ◦ C
to 25.3 ◦ C, respectively. Thus, there is no marked observable effect of change in internal operative
temperatures in the two sets of the uncertainty analysis results. However, the deterministic results
shows the operative temperatures of the UKCIP02 are slightly higher than those of UKCP09, with the
UKCP09 having a narrow range of operative temperatures.
The Monte Carlo sensitivity analysis quantified and identified the dry bulb and radiant
temperatures as the most influential weather parameters that affect thermal comfort on dwellings.
This finding agrees with published literature (CIBSE TM52, 2013; CIBSE Guide A, 2006). These study
results further indicate the marginal differences in maximum and minimum operative temperatures
for the Heathrow DSY medium-high and UKCP09 Heathrow 1989 medium 50% probabilistic scenarios
for the baseline, 2020s, and 2050s weather data sets, with the former being slightly higher. For the 2080s
scenarios, the difference in maximum operative temperature for the two weather data sets was about
0.5 ◦ C. Moreover, the time series analysis of internal operative temperatures using CIBSE TM52 as
overheating criteria for the UKCIP02 Heathrow DSY medium-high and UKCP09 Heathrow DSY 1989
medium 50% probabilistic scenario weather data sets showed a very strong similarity in the respective
timelines for the two weather data sets.
The standardised regression coefficient and the partial correlation coefficients are useful sensitivity
indices for determining the relative importance of weather parameters that influence the indoor
operative temperatures of dwellings. The work stresses the need for climate sensitive design,
and knowledge of this could offer insight for efficient designs and retrofitting practice to improve the
thermal comfort of dwellings. In addition, this work is useful in sustainable engineering practice, as it
could be extended to the energy requirements of buildings.
For easy analysis and replicable of the methodology used in this work, it is recommended
that building simulation software incorporate Monte Carlo and global sensitivity analysis as key
standard functionalities of its modelling. This will enable simulation software to facilitate the
analysis and predict key thermal performance parameters and further assess different energy
conservation measures.
Author Contributions: Ali B-Jahromi conceived and designed the project; Joseph Amoako-Attah performed the
experiments and analyzed the data. Joseph Amoako-Attah and Ali B-Jahromi wrote and reviewed the paper.
Conflicts of Interest: The authors declare no conflict of interest.Sustainability 2016, 8, 1194 16 of 18
Appendix A
Table A1. Modelling and Simulation Parameters and Assumptions.
Wall 0.42 W/m2 K
Floor 0.46 W/m2 K
Building Fabric—Calculated Roof 0.19 W/m2 K
area weighted average U-values Windows 3.29 W/m2 K
Door 2.74 W/m2 K
Garage door 1.77 W/m2 K
Construction Data Base NCM Construction—v5.2.tcd
Bath 0.01873684 pers/m2 . 150 Lux
Bed 0.01873684 pers/m2 . 100 Lux
Circulation area 0.02293877 pers/m2 . 100 Lux
Occupancy levels; People Dining 0.0169163 pers/m2 . 150 Lux
density; Lux level Kitchen 0.0237037 pers/m2 . 300 Lux
Lounge 0.0187563 pers/m2 . 150 Lux
Toilet 0.02431718 pers/m2 . 100 Lux
Natural Gas CO2 Factor 0.216 Kg/kWh
Fuel Source
Grid Electricity CO2 Factor 0.519 Kg/kWh
Latitude, longitude and time zone used in the modelling are 51.5 degrees North
0.4 degree East and UTC + 0.0 respectively to reflect the geographical and time
Orientation
parameters of London. Sheppey, Sheerness is 59.4 km from London, the closest
weather station.
4-16-4 uncoated glass, air filled; solar energy transmittance of 0.76 and total
Glazing
(normal) light transmittance of 0.8
Simple natural cross-ventilation in all directions. Window width is 10% less
than wall external area. Openable window proportion 50% set in the manner of
Ventilation
side openable windows. Set openable window temperature 20–21 ◦ C (control
zone dry bulb temperature). Openable window schedule 8 a.m. to 4 p.m.
DSY (CIBSE) for Gatwick, Heathrow and London Weather Centre. It includes
Weather data Global Solar Radiation, Diffuse Solar Radiation, Cloud Cover, Dry Bulb
temperature, Relative Humidity, Wind Speed and Wind Direction.
Impact of shading TAS simulation of “mean height of surroundings”
Terrain type City
Ground reflectance TAS default value of 0.2
Calendar NCM Standard
Air Permeability 10 m3 /hm2 @50Pa
Infiltration 0.500 ACH
Lighting Efficiency 5.2 W/m2 per 100 lux
Average Conductance 172 W/K
References
1. Palme, M.; Isalgue, A.; Coch, H. Avoiding the Possible Impact of Climate Change on the Built Environment:
The Importance of the Building’s Energy Robustness. Buildings 2013, 3, 191–204. [CrossRef]
2. Amoako-Attah, J.; B-Jahromi, A. Impact of Conservatory as passive solar design of UK dwellings. Proc. Inst.
Civ. Eng. J. Eng. Sustain. 2016, 169, 198–213. [CrossRef]
3. Amoako-Attah, J.; B-Jahromi, A. Method comparison analysis of dwellings’ temperatures in the UK. Proc. Inst.
Civ. Eng. J. Eng. Sustain. 2015, 168, 16–27. [CrossRef]
4. Amoako-Attah, J.; B-Jahromi, A. Impact of standard construction specification on thermal comfort in UK
dwellings. Adv. Environ. Res. 2014, 3, 253–281. [CrossRef]Sustainability 2016, 8, 1194 17 of 18
5. Amoako-Attah, J.; B-Jahromi, A. Impact of future climate change on UK building performance.
Adv. Environ. Res. 2013, 2, 203–227. [CrossRef]
6. Hulme, M.; Jenkins, G.L.; Lu, X.; Turnpenny, J.R.; Mitchell, T.D.; Jones, R.G.; Lowe, J.; Murphy, J.M.;
Hassel, D.; Boorman, P.; et al. Climate Change Scenarios for the United Kingdom: The UKCIP02 Scientific Report;
Tyndall Centre for Climate Change Research, University of East Anglia: Norwich, UK, 2002.
7. Jenkins, G.J.; Murphy, J.M.; Sexton, D.M.H.; Lowe, J.A.; Jones, P.; Kilsby, C.G. UK Climate Projections: Briefing
Report; Met Office Hadley Centre: Exeter, UK, 2009.
8. The Chartered Institution of Building Services Engineers. The Use of Climate Change Scenarios for Building
Simulation: The CIBSE Future Weather Years; CIBSE TM48; Chartered Institution of Building Services Engineers:
London, UK, 2008.
9. Williams, D.; Elghali, L.; France, C.; Wheeler, R.C. Projecting building energy demand using probabilistic
weather conditions accounting for climate change. In Proceedings of the CIBSE Technical Symposium,
DeMontfort University, Leicester, UK, 6–7 September 2011.
10. Belcher, S.E.; Hacker, J.N.; Powell, D.S. Constructing design weather for future climates. Build. Serv. Eng.
Res. Technol. 2005, 26, 49–61. [CrossRef]
11. Mylona, A. The use of UKCP09 to produce weather files for building simulation. Build. Serv. Eng. Res. Technol.
2012, 33, 51–62. [CrossRef]
12. Tian, W.; de Wilde, P. Uncertainty and sensitivity analysis of building performance using probabilistic climate
projections: A UK case study. Autom. Constr. 2011, 20, 1096–1109. [CrossRef]
13. Eames, M.; Kershaw, T.; Coley, D. On the creation of future probabilistic design weather years from UKCP09.
Build. Serv. Eng. Res. Technol. 2011, 32, 127–142. [CrossRef]
14. The Chartered Institution of Building Services Engineers. Design Summer Years for London; CIBSE TM49;
Chartered Institution of Building Services Engineers: London, UK, 2009.
15. Virk, G.; Mylona, A.; Mavrogianni, A.; Davies, M. Using the new CIBSE design summer years to assess
overheating in London: Effect of the urban heat island on design. Build. Serv. Eng. Res. Technol. 2015, 36,
115–128. [CrossRef]
16. Gupta, R.; Gregg, M.; Du, H.; Williams, K. Evaluative application of UKCP09-based downscaled future years
to simulate overheating risk in typical English homes. Structural Survey. Struct. Surv. 2013, 32, 231–252.
[CrossRef]
17. Smith, S.T.; Hanby, V.I. Methodologies for the generation of design summer years for building energy
simulation using UKCP09 probabilistic climate projections. Build. Serv. Eng. Res. Technol. 2012, 33, 9–17.
[CrossRef]
18. Watkins, R.; Levermore, G.J.; Parkinson, J.B. Constructing a future weather file for use in building simulation
using UKCP09 projections. Build. Serv. Eng. Res. Technol. 2011, 32, 293–299. [CrossRef]
19. Dominguez-Munoz, F.; Cejudo-Lopez, J.M.; Carrillo-Andres, A. Uncertainty in peak cooling load calculations.
Energy Build. 2010, 42, 1010–1018. [CrossRef]
20. Rodriguez, G.C.; Carrillo-Andres, A.; Dominguez-Munoz, F.; Cejudo-Lopez, J.M.; Zhang, Y. Uncertainties
and sensitivity analysis in building energy simulation using macroparameters. Energy Build. 2013, 67, 79–87.
[CrossRef]
21. Spitz, C.; Mora, L.; Wurtz, E.; Jay, A. Practical application of uncertainty and sensitivity analysis in building
energy simulation using macro parameters. Energy Build. 2012, 67, 79–87.
22. Handbook, A.F. Thermal Environmental Conditions for Human Occupancy, ASHRAE Standard 55-2010.
In American Society of Heating, Refrigerating and Air-Conditioning Engineers; American Society of Heating,
Refrigerating and Air-Conditioning Engineers: Atlanta, GA, USA, 2009.
23. De Dear, R.J.; Akimoto, T.; Arens, E.A.; Brager, G.; Candido, C.; Cheong, K.W.D.; Li, B.; Nishihara, N.;
Sekhar, S.C.; Tanabe, S.; et al. Progress in thermal comfort research over the last twenty years. Indoor Air
2013, 23, 442–461. [CrossRef] [PubMed]
24. The Chartered Institution of Building Services Engineers. The Limits of Thermal Comfort: Avoiding Overheating
in European Buildings CIBSE TM52; Chartered Institution of Building Services Engineers: London, UK, 2013.
25. Nicol, F.; Humphreys, M.; Roaf, S. Adaptive Thermal Comfort: Principles and Practice; Routledge: London,
UK, 2012.
26. D’Ambrosio Alfano, F.R.; Olesen, B.W.; Palella, B.I.; Riccio, G. Thermal comfort: Design and assessment for
energy saving. Energy Build. 2014, 81, 326–336. [CrossRef]You can also read