Sketch-and-test: visual crowd research using p5.js
←
→
Page content transcription
If your browser does not render page correctly, please read the page content below
Journal Title
                                                                                                                    XX(X):1–17
                                         Sketch-and-test: visual crowd                                               c The Author(s) 2020
                                                                                                                    Reprints and permission:
arXiv:2004.08198v1 [cs.HC] 17 Apr 2020

                                         research using p5.js                                                       sagepub.co.uk/journalsPermissions.nav
                                                                                                                    DOI: 10.1177/ToBeAssigned
                                                                                                                    www.sagepub.com/

                                                                                                                      SAGE

                                         M.W.A. Wijntjes and M.J.P. van Zuijlen

                                         Perceptual Intelligence Lab
                                         Delft University of Technology
                                         Landbergstraat 15
                                         2628CE Delft
                                         The Netherlands

                                         Corresponding author: m.w.a.wijntjes@tudelft.nl

                                         GitHub repository: https://github.com/maartenwijntjes/p5-sketch-and-test

                                         Prepared using sagej.cls [Version: 2017/01/17 v1.20]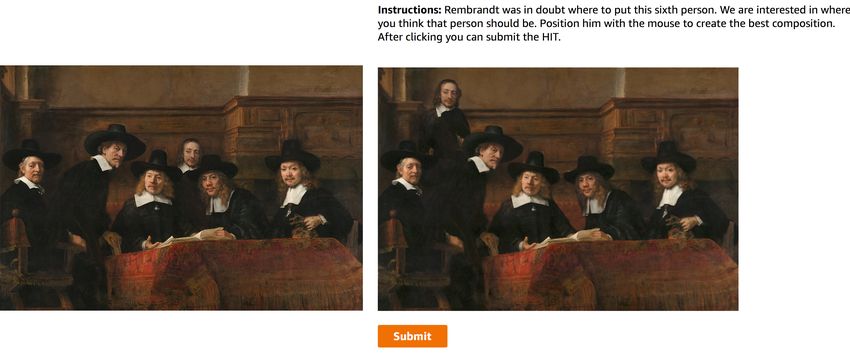
2                                                                                      Journal Title XX(X)

Abstract
Designing visual crowd experiments requires both control and versatility. While behavioural and
computer sciences have produced a fair number of tools facilitating this process, a gap remains when
it comes to the combination of accessibility and versatility. The Processing language is widely used by
artist and designers of varying levels of expertise and thus fulfils these conditions.
   Here, we investigated whether the Processing inspired JavaScript library p5.js can be used for visual
crowd research. We specifically explored how to use p5.js in combination with MTurk and report a simple
way of using p5.js ‘sketches to perform online tests.
   We report four complementary experimental paradigms to illustrated the accessibility and versatility
pf p5.js: Change blindness, BubbleView, Gauge figure (attitude probe) and Composition. Results reveal
that previous literature findings can be reproduced and novel insights can easily be achieved.
   The creative freedom of p5.js together with low threshold crowd access seems a powerful combination
for all areas that involve vision: perception, design, art history, communication and beyond.

Introduction
Collecting behavioural data through online crowd experiments has become a standard research tool
for many different scientific disciplines. There are various possible reasons to choose online over lab
experiments, such as speed and efficiency but also more specific reasons such as access to certain
subject pools (Paolacci et al. 2010). Performance seems generally not to be degraded (Buhrmester et al.
2011) although participants sometimes lack attention Goodman et al. (2013). Most paradigms from
experimental psychology give similar results as lab experiments Crump et al. (2013); Haghiri et al.
(2019).
   Crowd experiments range from simple questionnaires to complex visual presentations. Within the
wide spectrum of behavioural sciences that use crowd experiments, researchers on visual perception are
particularly concerned about controlling the presentation. Relating physical characteristics of the stimulus
to subjective experience is an essential element of psychophysics. To this end, software used by vision
scientists is often very customizable and allows for high levels of control. Two packages regularly used
are Psychotoolbox (Kleiner et al. n.d.) (PTB, formerly called Psychophysics Toolbox Brainard (1997))
for Matlab and PsychoPy (Peirce et al. 2019) for Python. PTB’s own description reflects that vision
scientists require both accuracy and versatility to generate stimuli and collect behavioural data:

        The PTB core routines provide access to the display frame buffer and color lookup table,
        reliably synchronize with the vertical screen retrace, support sub-millisecond timing, expose
        raw OpenGL commands, support video playback and capture as well as low-latency audio,
        and facilitate the collection of observer responses.

   While PTB is only available off-line, PsychoPy can be run online. To this end, a platform is needed
that hosts the JavaScript files generated in PsychoPy and, more importantly, saves the collected data.
PsychoPy users can use the platform Pavlovia.org where it is possibly to upload HTML/JavaScript
code. Conducting psychophyical studies using JavaScript does not seem to affect control over reaction
times (de Leeuw and Motz 2016), a typical dependent variable for vision research. The third step, after
coding and hosting an experiment, is recruiting participants, which can be done through crowdsourcing
marketplaces, such as MTurk but also many other alternatives.

Prepared using sagej.cls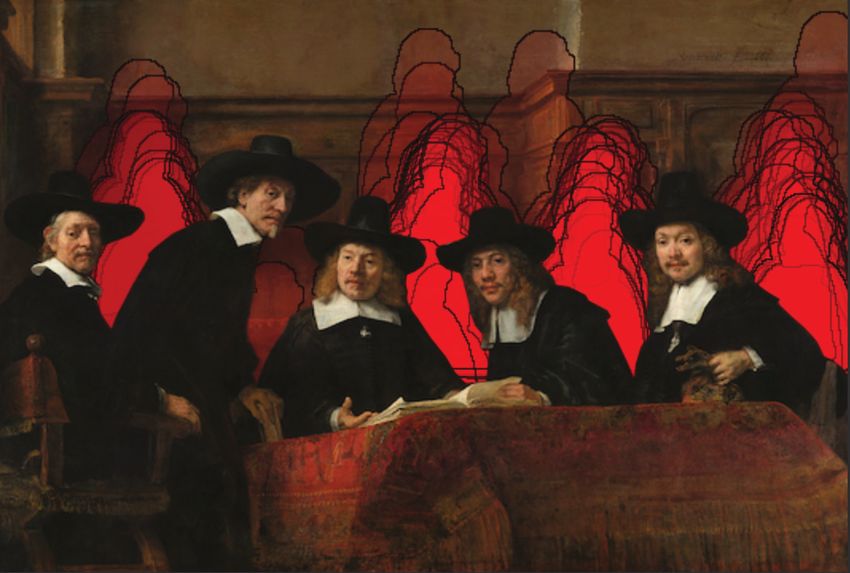
3

   These three steps (interface design, data collection and recruitment) are inherent components of any
(online) experiment. Instead of using a dedicated psychology toolbox, it is possible to directly code an
HTML/JavaScript experiment and host it on a web server. Yet, all steps seem relatively high-threshold
and to this end, a number of initiatives have been taken to facilitate the online behaviour researcher.
For example, psiTurk (Gureckis et al. 2016) is an open source platform that allows researchers to code
and use full experiments. One of the motivations behind psiTurk is reproducability: by publishing an
online experiment it can easily be reproduced by peer scientists. A difference between psiTurk and
PsychoPy is that psiTurk integrates all three steps of coding, hosting and recruitment. Another initiative
is TurkPrime (Litman et al. 2017) which focuses more on participant management and MTurk interface
for the researcher. As MTurk was originally designed for computer science applications, the interface
and management for participants is not well supported.
   Considering that a ’standard’ HIT (Human Intelligence Task) on MTurk through the online requester
portal only entails writing some HTML code, it is not immediately evident why the relatively complex
solutions mentioned above are needed. It is quite possible to run an experiment directly from the requester
portal. However, a lack of HTML/JavaScript expertise can impede the flexibility of stimulus generation
and behavioural data collection that is common to PsychoPy and related packages.
   Artists and designers face similar challenges: they aim to create rich visual experiences with complex
user interactions. A well-known language used by visual artists is Processing. It aims to be accessible
to non-programmers and contains a wide variety of graphical possibilities and user input. A JavaScript
library having much of the functionality of Processing, p5.js, recently (February 2020) launched its first
official version. Over the past few years, p5.js (McCarthy et al. 2015) has attracted a large community of
creative coders ranging from beginners to professional artists.
   In this paper we report how the p5.js library can be used to program visual experiments for
crowd research. Developing stimuli and experiments is particularly accessible through the online editor
(https://editor.p5js.org), and with small additions this code can be copy-pasted into the MTurk requester
portal. We will exemplify the creative freedom and ease of creating a HIT by reporting four short studies.
We used four different experimental paradigms, three of which are rather well known in vision science
while the fourth is an example of visual crowd research at large: collecting crowd input for visual tasks
is not reserved to the behavioural sciences.

Methods
p5.js & MTurk basics
The name p5 originates from Proce55ing, an alternative spelling of Processing which is a widely used
programming language (Reas and Fry 2007) “in the context of visual arts”∗ . P5.js is a JavaScript library
that shares much of the functionality of Processing (McCarthy et al. 2015). Both Processing and p5.js
aim to make code accessible to a wide audience and are thus relatively easy to use by beginners. A
program made by a user is called a ‘sketch’, emphasizing the iterative design process with immediate
visual feedback. For a general introduction about p5.js we recommend visiting their webpage† . Here, we
will discuss a few specific functionalities needed for visual crowd research.

∗ https://processing.org
† https://p5.js.org

Prepared using sagej.cls
4                                                                                                  Journal Title XX(X)

   A p5.js sketch is a JavaScript file that uses the commands and structure of the Processing language.
In the JavaScript file, images and data are loaded, screen presentation defined and data is collected from
mouse movement and keyboard. p5.js even makes it possible to use smartphone events (like orientation
and acceleration) as input. When using the MTurk requester portal, the experimenter can choose a
template to start coding their own experiment. The HMTL, CSS and JavaScript code for a project can be
written or copied into the editor. MTurk created a library of custom HTML tags (Crowd HTML Elements)
that can be used to save data. The fact that saving data makes use of HTML while p5.js makes use of
JavaScript is the first small challenge to be overcome. We found that collecting data in a p5.js Table object
is most convenient. When the experiment finishes, the Table is then converted to a CSV file and we use a
simple function to transfer this data to the HTML tag.
   Besides saving data, experimental design data needs to be loaded. Often a data file is needed that
contains sampling points, image names, etc. Again, using a CSV file and importing it as a Table is most
convenient. The order of the trials can be randomised to counter balance for order effects. When linking
images and scripts from other websites, problems with ‘Cross-Origin Requests Sharing’ can occur. It is
not always clear how to change these ’CORS’ settings on the server or webpage. We found that hosting
on Amazon S3 worked well and the relevant settings could easily be adjusted.
   We distinguish two phases in our experiment preparation: 1) coding the p5.js sketch ( e.g. in the online
editor), and 2) putting this code on the MTurk editor. Importantly, we aimed to create experiments that
can also (almost‡ ) completely run in the p5.js editor (or on any webpage). The biggest difference with
MTurk is data collection as it is not possible to save user input in the p5.js online editor, or any ‘normal’
website. As we envision that using p5.js for visual crowd research will also be used in education (the
authors use it extensively in a course about visual communication and perception), we propose a simple
solution: saving data locally and let participants voluntarily share their data via any form of electronic
communication. The scenario will often be that students use their peers as participants. For this, the
sketch needs to be ‘aware’ of where it resides: on MTurk or on the editor, for which we wrote a function.
   These were general issues of how to use p5.js for visual crowd experiments. We will further discuss
specific functions of p5.js during the description of the example experiments below.

Change blindness
While the effect is striking and theoretical implications notable (O’Regan 1992), a change blindness
experiment is very easy to create. In the original study, two pictures are shown subsequently for 240 ms
with a gray frame presented intermittently for 80 ms (Rensink et al. 1996). Humans are surprisingly bad
in detecting rather large changes in a visual scene under these conditions. This contrasts considerably
with our subjective experience of a richly detailed world (Cohen et al. 2016). The finding implies that
we only retain little visual information in our memory, as the world is already ‘out there’ to consult if
needed (O’Regan 1992). Besides of fundamental interest, the change blindness paradigm also applies to
interface design (Varakin et al. 2004) and to optimize graphics algorithms (Cater et al. 2003).
   For our change blindness experiment we used stimuli from Ma et al. (2013) who developed a
computational model for predicting human performance in this task. We used 10 picture pairs from their
original set, 5 ’easy’ picture pairs with average reaction times of about 5 seconds and 5 ’difficult’ pairs

‡ only   exceptions were when we made use of MTurk Crowd HTML Elements to collect textual input.

Prepared using sagej.cls
5
with average reaction times of about 60 seconds. These different reaction times makes them interesting
and challenging to put on MTurk: would a participant be willing to spend 60 seconds to find a changing
target?
original
modified
s
0m
24
s
original m
80
s
0m
24
s
m
80
s
0m
24
Figure 1. Overview of the changeblindness paradigm, using stimuli from (Ma et al. 2013). The original and
modified version are shown in succession with an intermediate gray frame.
Two aspects of the p5.js sketch for the change blindness paradigm are interesting to discuss. First,
the filenames are loaded from a CSV file. The filenames are then used to load the images. Reading
data from the CSV, as well as loading the images is done asynchronously, meaning that the code will
continue to execute, before the data or images have finished loading. While this is useful for normal web
pages, in the case of web experiments this can lead to serious issues. To prevent these problems, we use
callback functions, which will only execute once the data has finished loading. This is typically needed
for experiments with a set of images. Secondly, we used the frameRate() function to control the flicker
paradigm. On the original publication (Rensink et al. 1996) an image was shown for 240 ms and the gray
blank for 80 ms. Thus, using a frame rate of 12.5 Hz and assigning 3 frames to the image and 1 frame to
the blank will result in the required visual presentation. Interestingly, the logging of mouse clicks is not
affected by this frame rate setting.
Bubble View
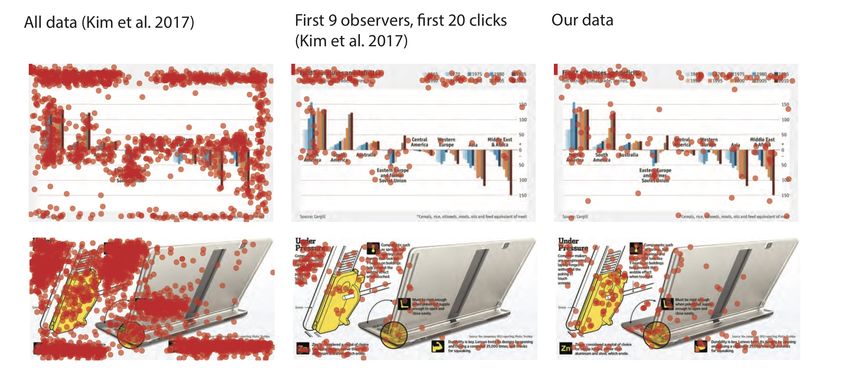
BubbleView (Kim et al. 2017) was designed as alternative for eye-tracking studies. The paradigm is
simple: let observers try to understand what is represented in an image by sharpening areas of an overall
blurred image. Image ‘understanding’ is tested by letting observers describe the picture verbally, while
the visual information is quantified by their mouse clicks to sharpen areas. The rationale behind this
Prepared using sagej.cls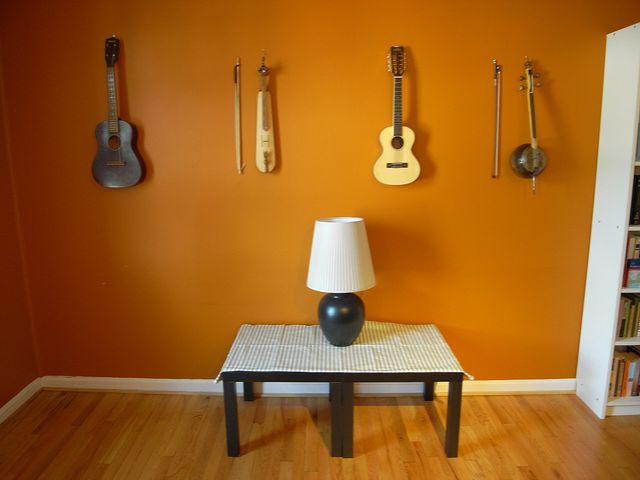
6 Journal Title XX(X)
approach is that it functionally mimics gaze behaviour: where you plan to look (a fixation) is based on
low resolution information from your periphery (i.e. outside the fovea). Recent studies have proposed
that blurring may not be optimally representing the loss of peripheral information (Rosenholtz 2016), but
computationally much easier than the alternative (Freeman and Simoncelli 2011).
(Kim et al. 2017) showed that click data are very similar to fixation data. We used two images of
their data visualisation set to reproduce in our p5.js experiment. The p5.js library allows for basic image
filter operations such as blur, and gives access to pixel values through the pixels() command. In our
implementation of BubbleView, we showed a blurred version of an image and defined a sharp aperture
by displaying the pixels from the (sharp) original around a mouse click location. These are all relatively
trivial steps in p5.js. What is furthermore interesting in this example is that we mixed a p5.js sketch with
an HTML MTurk crowd element for the textual input. As MTurk is a very suitable solution for collecting
textual input, we used that instead of P5. It should be noted that this is primarily practical for a single
trial experiment.
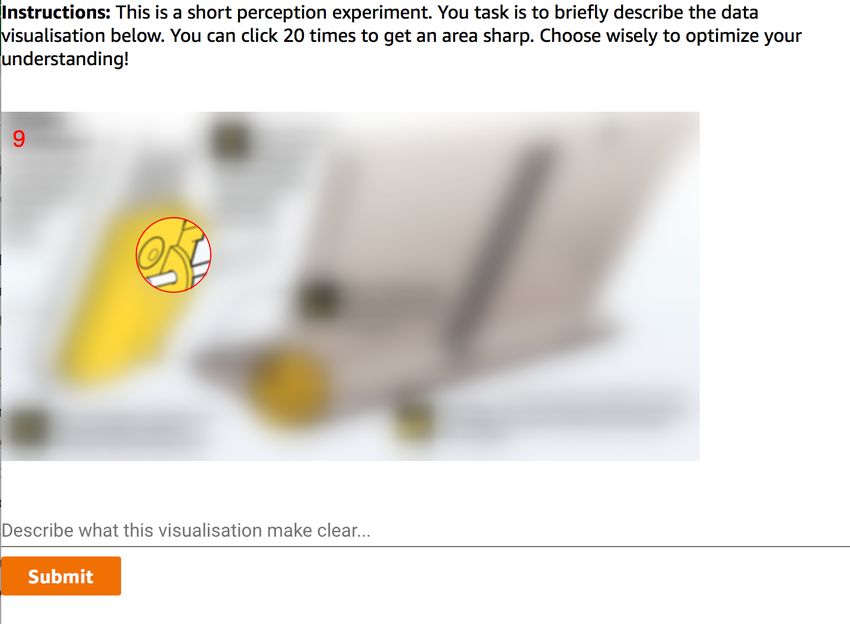
Figure 2. The BubbleView interface in MTurk. The instruction text, text input and submit button are all in the
MTurk HTML, while the image interaction is in p5.js.
We collected 20 clicks per participant, using 9 participants. This is perhaps on the low side, but
knowing that the click patterns are rather robust (Kim et al. 2017), we thought this was sufficient. We
Prepared using sagej.cls
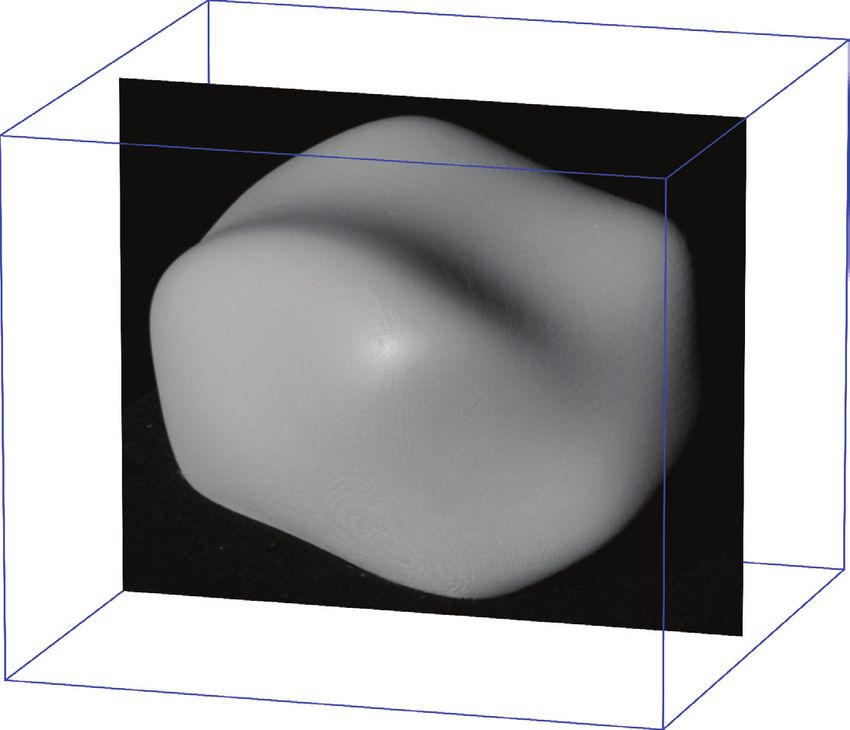
7

used the following criteria for the workers: US, acceptance rate of 95% and more than 1000 accepted
HITS.

Gauge figure attitude probe
The perception of 3D shape (Todd 2004) is a classic subject in vision science because it concerns the
intriguing question of constructing the third dimension, depth, from a flat retinal signal. The reverse
process is equally interesting and studied by artist, designers and computer scientists: how to represent a
3D shape in a two-dimensional medium?
   An important experiment in the area of 3D shape perception became the so-called ‘gauge figure task’
(Koenderink et al. 1992). It lead to fundamental insights about mathematical transformations describing
perceptual ambiguities (Koenderink et al. 2001) and also led to more applied studies on the relation
between line drawing technique and 3D shape perception (Cole et al. 2009).
   The experimental task is to adjust the 3D orientation of a figure that looks like a drawing pin or thumb
tack. An example trial is shown in figure 3. There are various ways to analyse the data, for example
simply correlate slant (orientation from screen plane, i.e. outside the screen) and tilt (orientation in screen
plane, like the clock pointer) settings. A more complex way is to reconstruct the global 3D surface by
integrating the settings because these are essentially the local attitude (the derivative) of the surface. We
will not discuss these details further but chose the reconstruction method primarily because it nicely
visualises the results. We used (Wijntjes 2012) to setup the triangulation and reconstruct the 3D relief,
but the experiment itself fully ran in p5.js. Furthermore, we used a stimulus from (Wijntjes et al. 2012)
but with a courser sampling of 64 points, which is approximately recommended by a previous MTurk
study (Cole et al. 2009).
   A total of 20 workers participated in this study. We instructed the participants to spend about 3 seconds
per setting, which would make the experiment last about 3 minutes. Including reading time this would
be about 5 minutes. We offered $1 in reimbursement for their time. In this experiment, we used so-called
Masters.

Composition
In the previous three experiments we focused on well-known paradigms from vision science, but in
this last example we want to go beyond these. We will not reproduce known results but rather employ
a p5.js experiment to answer a question of artistic composition. Rambrandts’ Syndics of the Drapers
Guild painting is one of his most lauded works. The unconventional viewpoint, and the dynamics of
the viewers’ feeling to interrupt a meeting that just started, is one of the many aspects discussed in art
history. Yet, Rembrandt did not immediately achieve this final composition, as x-ray studies have shown
(Van Schendel 1956). One of the changes that Rembrandt seem to have made during the process was the
position of the servant, the person in the middle behind the others. According to Van Schendel (1956),
Rembrandt initially planned to position this person at the far right of the painting. We thought it would
be interesting to ask the MTurk crowd for their opinion.
   We used photo editing software to cut out the foreground scene and independently the servant.
The place of the servant was filled with image elements of the remaining scene as to not give away
Rembrandts’ choice. Participants were instructed to position the servant at the location that resulted in

Prepared using sagej.cls
8                                                                                          Journal Title XX(X)

Figure 3. Left the experiment screen is shown with the explanation. In the middle the triangulation can be
seen, which is convenient for reconstructing the global depth from the local settings. The blue dots are the
barycentres of the triangles and are the sampling points where the gauge figure appeared (in random order).
On the right, all settings of 1 observer are shown. Mind that the observers did not see settings simultaneously.

the best composition. A total of 100 workers participated in this short, single trial experiment, for which
they were reimbursed $0.1.

Figure 4. Left the original painting is shown: the ‘Syndics of the Drapers Guild’ (1662) by Rembrandt. On the
right, the experimental interface is shown. As can be see: the servant is cut out of the original and can be
freely positioned anywhere in the canvas.

Prepared using sagej.cls
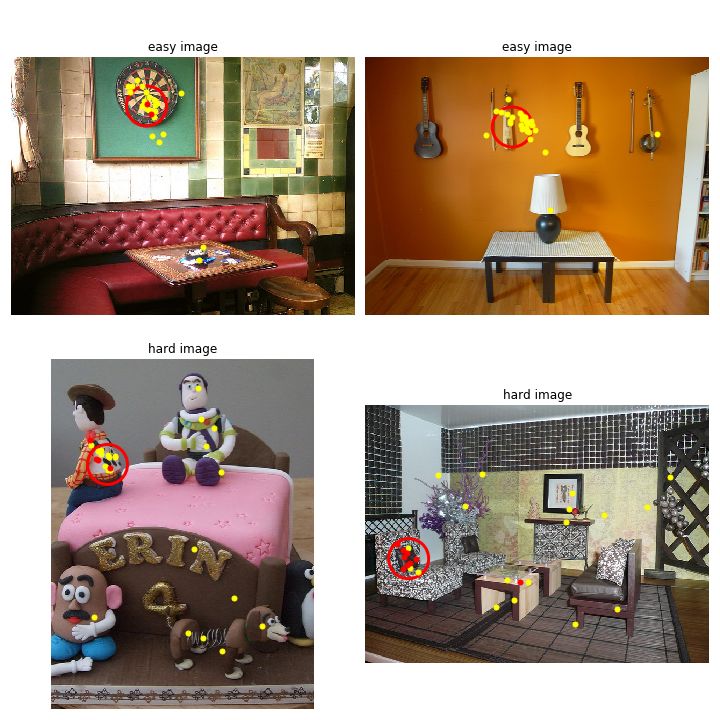
9

Results and discussions
Change blindness
Four of the 10 images used in the change blindness experiment are visualized in figure 5 with the location
of the target, as well as the location the participants clicked. Participants were instructed to find the target
change as fast as possible and click where they saw the change. We did not include data from 3 out
of 30 participants: their average response time was 3 seconds and click locations seemed random. The
clicks for the remaining 27 participants are visualized as the yellow points in 5. To save participants
from frustration, if they did not make a click within one minute, we would highlight the target after one
minute. Clicks made after this one minute are visualized in red. As can be seen in figure 5, the majority
of clicks placed by participants are at, or near the target, with a smaller number of clicks located far from
the target. These distant clicks could be the participants wrongfully believing they saw a change, or the
participant giving up.
   We looked at the reaction times for each trials that qualified the following two conditions: 1) clicks
were made within one minute (so as to remove trials in which the correct answer was shown to the
participant) and 2) if their click was placed correctly. Correctly here is defined as being within a 0.1
radius from the changing object, based on an image re-scaled to a width of 1 by 1. Note that this is a
rather conservative criterion, as in some trials a relatively large object moves around in which where clicks
made at the center of the changing object would qualify, but clicks at the edges might not. Performing
an independent t-test on the reaction times confirmed that the easy images (M = 10.7s, SD = 14.1s) were
found significantly faster than the hard images (M = 25.1s, SD = 23.6s), t(269) = -6.08, p < .0001. Ma
et al. (2013) found average reactions times of 5.1 seconds for easy images and 58.7 seconds for the
difficult images. Thus, our difference is substantially smaller. This is somewhat surprising but there can
be various reasons for this difference, for example images size: we used rather small images. Ma et al.
(2013) did not report image size but it was likely larger.

Bubble View
We plotted the raw data in figure 6. As the data from (Kim et al. 2017) differed from ours by the number
of participants and clicks we corrected for that by visualizing their first 9 observers and 20 clicks in the
middle column. It should be noted that this filtering may bias the results because click strategies may
depend on either time or click limitations.
   The pattern of clicks seems rather similar: participants mostly click on text. In the bottom row the
click data also seems mostly similar except that the yellow element seems to attract more attention in
our experiment than the original. It is a zoomed in picture of the screen flipping mechanism which is
relatively difficult to visually understand (even if you see the sharp version). The yellow part may need
multiple clicks to understand its global appearance, while the text between the yellow part and laptop is
simply to much to reveal by clicking.

Gauge figure attitude probe
We reconstructed the 3D surfaces on the basis of local surface attitude estimates of 20 participants. The
data is shown in figure 7 and ordered on relief depth. What can immediately be seen is that about 35% (the
last 7) of the observers did not seem to understand the task. Although there is not much known literature

Prepared using sagej.cls
10                                                                                     Journal Title XX(X)

Figure 5. 4 examples of images used for the change blindness experiment. The top images were designated
easy and the bottom as hard, as per (Ma et al. 2013). The red ellipse indicates the change target location.
Yellow and red clicks were made by participants. Red clicks were placed after one minute, when the target
location was revealed to participants

about this, we know from experience that the instruction for gauge figure experiments in the lab requires
substantial attention. It is seems relatively difficult to understand although showing visual examples
generally helps. We have also experimented with instruction videos in other (for now unpublished) MTurk
research, which seemed to improve understanding. Taking into account that in this case we only used 64
words to describe the whole task puts the results in perspective: having 65% ’normal’ data is actually
above our own expectation.
   Although there is further analysis possible, e.g. quantify how integrable (globally consistent) the
attitude estimations are (Koenderink et al. 1992) or whether differences can be described by affine

Prepared using sagej.cls
11

Figure 6. Two experiments compared with the original data from (Kim et al. 2017). Because we only used 9
participants and let them click 20 times we imposed the same restriction on the original data by selecting their
first 9 observers and 20 clicks.

transformations (Koenderink et al. 2001). However, we think it can also be visually inferred that the
depth range and global attitude seem to vary quite substantially between observers which is much in line
with previous findings. Further analysis may actually reveal these quantitatively but is beyond the current
scope.

Composition
The compositional choices of 100 participants are visualised in figure 8. It can be readily seen that 4
horizontal locations dominate. One of them is similar to the actual painting, and the far right alternative
is similar to Rembrandts’ under drawing (Van Schendel 1956). Perhaps the other two locations have also
been considered by Rembrandt, and maybe there will be art historical evidence for that although we were
not able to uncover that.
   A natural follow-up question for this short experiment is obviously what the experiential (i.e.
perceptual, aesthetic and/or emotional) effect these choices would have.

General discussion
We studied the use of p5.js for visual crowd research. Many functionalities that are needed for visual
crowd research are available in p5.js which is likely due to the shared interest of artists, designers and
vision researchers in both accuracy and versatility. To demonstrate the use of p5.js we replicated three
experiments and piloted a new, fourth experiment. That the results are similar to previous findings may not
be too surprising, although two out of three experiments were originally conducted offline. The fact that
we find rather similar results adds to the evidence that crowd experiments can replicate lab experiments.

Prepared using sagej.cls
12                                                                                          Journal Title XX(X)

Figure 7. On the left, the stimulus is shown, aligned in a 3D frame where also the subjective surface reliefs
are visualised (on the right), which are ordered from shallow to deep. As can be seen in these results, there is
quite some variability in the perception for 3D shape, and also in understanding the task (e.g. last 7 observers).
                            10

                                 20
                        0
                      0
                      50
                      100
                      150
                      200
                      250
                      300
                        0

                            10

                                 20

                                 10                                                          10
                                  5                                                          5
                                  0                                                          0

Figure 8. Visualisation of 100 responses of where the servant would result in the best composition. There are
clearly 4 dominant horizontal positions with more or less equal probability, except the left most.

Prepared using sagej.cls
13 More interesting than the experimental results per se is the fact that we demonstrated a simple and effective way to perform a wide variety of visual crowd experiments. With the BubbleView experiment we demonstrated the ability to filter (blur) images and display specific pixel regions (the sharp areas) and how to collect mouse click data. The Change Blindness experiment exemplified how to make use of external measurement lists that contain filenames and how to measure reaction times. The Gauge Figure experiment showed how to use shape primitives and how to load and use sample locations. The Composition experiment showed the usefulness of .png images with transparent areas. Overall, this set of four experiments should serve as an adequate basis for developing new experimental paradigms. While the use of p5.js can also stand on its’ own, we specifically investigated it in the context of Amazon Mechanical Turk. While collecting information about other MTurk studies we noticed that although many researchers share their code publicly, it cannot always be easily re-used. For example, BubbleView (Kim et al. 2017) released their code but not the integration with MTurk because that requires “more complex development settings including a database, a web server, and scripts for automatically managing MTurk HITs.”. These are perfectly valid reasons for not offering a simple way to replicate the experiment on MTurk. But it does increase the threshold for less experienced researchers to use their experimental paradigm. Similar to the efforts of both Processing and p5.js in making programming accessible to a large audience, our aim was to increase accessibility of visual crowd research. The solution we studied works well but also has its limitations. For example observer management and complex experimental designs may be easier in psiTurk (Gureckis et al. 2016), PyschoPy (Peirce et al. 2019) or TurkPrime (Litman et al. 2017), while fast and accurate graphics may work better with custom code and servers. Also database management, adaptive and automatic HIT creation require more complex solutions. Yet, these trade-offs come with the advantage that designing and running an experiment is almost as simple as copy-pasting a p5.js sketch from the online editor into the MTurk requester portal. This brings us some last contemplations concerning visual crowd research. Reducing the distance between idea and experiment, between hypothesis and data, does not have much priority in traditional behavioural sciences. In fact, iterative and exploratory research is currently approached with caution due to the replication crisis (Pashler and Wagenmakers 2012; Collaboration 2015). Aside from simple fraud, statistical malpractice etc, a reason for replication failures is that some scientists iterate until a significant effect is found. The problem is that the statistics do not take these iterations into account. Furthermore, the hypothesis can be adjusted post-hoc, i.e. after the results arrived. For this reason, behavioural sciences now make use of pre-registrations: the hypothesis and paradigm should be fixated before running the study. Carefully planning a scientific study goes conjointly with carefully programming the experiment. Then why the need for this sketch-and-test framework we have just been reporting? Because ‘visual crowd research’ both covers a (limited) area of behavioural sciences and at the same time extents towards other disciplines. Research in vision science is not only steered by preconceived hypotheses but also draws inspiration from informal observations, for example in the area of visual illusions. Exploratory research can precede explanatory research, especially in vision science. The sketch-and-test framework can facilitate this process. Visual crowd research extents the borders of behavioural science towards areas such as communication design, media studies and (digital) art history. With design, the sketching and testing is conducted on many different levels, from paper prototypes to specific interaction design software such as Sketch or Prepared using sagej.cls
14                                                                                      Journal Title XX(X)

    Figma. Because p5.js sketches are rather easy to design, integration with a testing platform such as MTurk
    can be very valuable in the design process. In fact, the Change Blindness and BubbleView experiments we
    reported are tightly linked with visual information design questions (Varakin et al. 2004; Newman et al.
    2020). In areas where large collections of cultural data are studied, such as digital art history, there seems
    to be a need for annotations (Wijntjes 2018). With simple tasks written in p5.js, annotating collections
    becomes easy. This would allow for novel ways of analysing visual conventions throughout art history
    and open up many new and interesting directions of future research.

    Acknowledgements
    This work is part of the research program Visual Communication of Material Properties with project
    number 276-54-001, which is financed by the Dutch Research Council (NWO). Furthermore, we
    would like to thank students from the course Visual Communication Design at the TU Delft, who
    enthusiastically joined our fascination of visual perception and communication and caused some kind
    of reciprocal inspiration. Lastly, we would like to thank prof. Joris Dik, who introduced us to many
    intriguing art historical questions of which the Drapers Guild is merely one.

    Appendix
    Here, we report code fragments that are important for running p5.js crowd experiments. If pictures are
    used they need to be hosted at a server that has the correct CORS settings. Image loading needs to be done
    in the preload function. Here is an example where one image is loaded. For an example where multiple
    images are loaded in the basis of the filenames in a .csv file, please see the GitHub repository.
1   let path = ’https://materialcom.s3.eu-central-1.amazonaws.com/bubbleview/stims/’
2   let imageNameShort = ’wsj104.png’;
3   let imageName = path + imageNameShort;
4   function preload() {
5       image = loadImage(imageName);
6   }

       In the online editor, the p5.js canvas is automatically attached to a HTML element. Outside of the
    editor, this has to be done manually, therefor it is recommended to use the following with the setup()
    area:
1   canvas = createCanvas(sketchWidth, sketchHeight);
2   if (!onP5Editor()) {
3       canvas.parent(’p5sketch’);
4   }

    where
1   function onP5Editor() {
2       return document
3               .location
4               .ancestorOrigins[0]
5               .includes(’editor.p5.js.org’)
6   }

       Now, the ‘p5sketch’ tag can be used in the HTML code, for example like

    Prepared using sagej.cls
15
1
For data collection it is convenient to use a p5.js table with a manually defined header:
1 let header = [’x’, ’y’, ’r’, ’imageName’];
2 data = new p5.Table();
3 for (let i = 0; i < header.length; i++) {
4 data.addColumn(header[i]);
5 }
To save the collected data, either locally or via MTurk, we used:
1 function finished() {
2 if (onP5Editor()) {
3 saveTable(outputData, ’data.csv’);
4 } else {
5 experimentOutput = document.getElementById(’experimentOutput’);
6 experimentOutput.value = table2csv();
7 }
8 }
Which assumes the following HTML element exists:
1
2
The finished function automatically called when the experiment is finished (e.g. when number of trials
or total time is reached). As can be seen, we use the on P5Editor function defined previously. If the sketch
runs in the online editor, the p5.js function saveTable is used to convert the p5.js Table object to a .csv
file. If the sketch runs on MTurk, the p5.js Table is converted to csv text using our custom table2csv
function. The csv text is then inserted into an MTurk crowd-input HTML element, which saves the data
on the MTurk platform.
References
Brainard, D. H. (1997), ‘The Psychophysics Toolbox’, Spatial Vision 10, 433–436.
Buhrmester, M., Kwang, T. and Gosling, S. D. (2011), ‘Amazon’s mechanical Turk: A new source of inexpensive,
yet high-quality, data?’, Perspectives on Psychological Science 6(1), 3–5.
Cater, K., Chalmers, A. and Dalton, C. (2003), ‘Varying rendering fidelity by exploiting human change blindness’,
Proceedings of the 1st International Conference on Computer Graphics and Interactive Techniques in
Australasia and South East Asia, GRAPHITE ’03 pp. 39–46.
Cohen, M. A., Dennett, D. C. and Kanwisher, N. (2016), ‘What is the Bandwidth of Perceptual Experience?’, Trends
in Cognitive Sciences 20(5), 324–335.
Cole, F., Sanik, K., DeCarlo, D., Finkelstein, A., Funkhouser, T., Rusinkiewics, S. and Sing, M. (2009), ‘How Well
Do Line Drawings Depict Shape?’, ACM Transactions on Graphics (proc. SIGGRAPH) 28(3).
Collaboration, O. S. (2015), ‘PSYCHOLOGY. Estimating the reproducibility of psychological science’, Science
(New York, N.Y.) 349(6251), aac4716.
Crump, M. J., McDonnell, J. V. and Gureckis, T. M. (2013), ‘Evaluating Amazon’s Mechanical Turk as a Tool for
Experimental Behavioral Research’, PLoS ONE 8(3).
Prepared using sagej.cls16 Journal Title XX(X)
de Leeuw, J. R. and Motz, B. A. (2016), ‘Psychophysics in a Web browser? Comparing response times collected
with JavaScript and Psychophysics Toolbox in a visual search task’, Behavior Research Methods 48(1), 1–12.
Freeman, J. and Simoncelli, E. P. (2011), ‘Metamers of the ventral stream.’, Nature neuroscience 14(9), 1195–1201.
Goodman, J. K., Cryder, C. E. and Cheema, A. (2013), ‘Data Collection in a Flat World: The Strengths and
Weaknesses of Mechanical Turk Samples’, Journal of Behavioral Decision Making 26(3), 213–224.
Gureckis, T. M., Martin, J., McDonnell, J., Rich, A. S., Markant, D., Coenen, A., Halpern, D., Hamrick, J. B. and
Chan, P. (2016), ‘psiTurk: An open-source framework for conducting replicable behavioral experiments online’,
Behavior Research Methods 48(3), 829–842.
Haghiri, S., Wichmann, F. and von Luxburg, U. (2019), ‘Comparison-Based Framework for Psychophysics: Lab
versus Crowdsourcing’, pp. 1–19.
Kim, N. W., Bylinskii, Z., Borkin, M. A., Gajos, K. Z., Oliva, A., Durand, F. and Pfister, H. (2017), ‘BubbleView:
An interface for crowdsourcing image importance maps and tracking visual attention’, ACM Transactions on
Computer-Human Interaction 24(5).
Kleiner, M., Brainard, D., Pelli, D., Ingling, A., Murray, R. and Broussard, C. (n.d.), ‘What ’ s new in Psychtoolbox-3
? Foreword ; - )’, What’s New .
Koenderink, J. J., van Doorn, A. J. and Kappers, A. M. L. (1992), ‘Surface perception in pictures’, Perception &
Psychophysics 52, 487–496.
Koenderink, J. J., van Doorn, A. J., Kappers, A. M. L. and Todd, J. T. (2001), ‘Ambiguity and the ‘mental eye’ in
pictorial relief’, Perception 30(4), 431–448.
Litman, L., Robinson, J. and Abberbock, T. (2017), ‘TurkPrime.com: A versatile crowdsourcing data acquisition
platform for the behavioral sciences’, Behavior Research Methods 49(2), 433–442.
Ma, L.-Q., Xu, K., Wong, T.-t., Jiang, B.-y. and Hu, S.-m. (2013), ‘Change Blindness Images’, IEEE Transactions
on Visualization and Computer Graphics 19(11), 1808–1819.
McCarthy, L., Reas, C. and Fry, B. (2015), Getting Started with P5. js: Making Interactive Graphics in JavaScript
and Processing., Maker Media, Inc.
Newman, A., Mcnamara, B., Fosco, C., Zhang, Y. B., Sukhum, P., Tancik, M., Kim, N. W. and Bylinskii, Z. (2020),
‘TurkEyes : A Web-Based Toolbox for Crowdsourcing Attention Data’.
O’Regan, J. K. (1992), ‘Solving the” real” mysteries of visual perception: the world as an outside memory.’,
Canadian Journal of Psychology/Revue canadienne de psychologie 46(3), 461.
Paolacci, G., Chandler, J. and Ipeirotis, P. G. (2010), ‘Running experiments on Amazon Mechanical Turk’, Judgment
and Decision Making 5(5), 411–419.
Pashler, H. and Wagenmakers, E. J. (2012), ‘Editors’ Introduction to the Special Section on Replicability in
Psychological Science: A Crisis of Confidence?’, Perspectives on Psychological Science 7(6), 528–530.
Peirce, J., Gray, J. R., Simpson, S., MacAskill, M., Höchenberger, R., Sogo, H., Kastman, E. and Lindeløv, J. K.
(2019), ‘PsychoPy2: Experiments in behavior made easy’, Behavior Research Methods 51(1), 195–203.
Reas, C. and Fry, B. (2007), Processing (A Programming Handbook for Visual Designers and Artists), The MIT
Press.
Rensink, R. A., O’Regan, J. K. and Clark, J. J. (1996), ‘To see or not to see: The need for attention to perceive
changes in scenes’, Investigative Ophthalmology and Visual Science 37(3).
Rosenholtz, R. (2016), ‘Capabilities and Limitations of Peripheral Vision’, Annual Review of Vision Science
2(1), 437–457.
Prepared using sagej.cls17
Todd, J. T. (2004), ‘The visual perception of 3D shape’, Trends in Cognitive Sciences 8(3), 115–121.
Van Schendel, A. (1956), ‘De schimmen van de Staalmeesters: Een r\”ontgenologisch onderzoek’, Oud Holland
71(1), 1–23.
Varakin, D. A., Levin, D. T. and Fidler, R. (2004), ‘Unseen and unaware: Implications of recent research on failures
of visual awareness for human-computer interface design’, Human-Computer Interaction 19(4), 389–422.
Wijntjes, M. (2012), ‘Probing pictorial relief: from experimental design to surface reconstruction’, Behavior research
methods 44(1), 135–143.
Wijntjes, M., Doerschner, K., Kucukoglu, G. and Pont, S. C. (2012), ‘Relative flattening between velvet and matte
3D shapes: evidence for similar shape-from-shading computations.’, Journal of vision 12(1), 1–11.
Wijntjes, M. W. A. (2018), ‘Annotating shadows, highlights and faces: the contribution of a ’human in the loop’ for
digital art history’, ArXiv abs/1809.03539.
Prepared using sagej.clsYou can also read