Surface-based analysis increases the specificity of cortical activation patterns and connectivity results
←
→
Page content transcription
If your browser does not render page correctly, please read the page content below
www.nature.com/scientificreports

            OPEN           Surface-based analysis increases
                           the specificity of cortical activation
                           patterns and connectivity results
                           Stefan Brodoehl1,2*, Christian Gaser1,3, Robert Dahnke1, Otto W. Witte1 &
                           Carsten M. Klingner1,2
                           Spatial smoothing of functional magnetic resonance imaging (fMRI) data can be performed on
                           volumetric images and on the extracted surface of the brain. Smoothing on the unfolded cortex should
                           theoretically improve the ability to separate signals between brain areas that are near together in the
                           folded cortex but are more distant in the unfolded cortex. However, surface-based method approaches
                           (SBA) are currently not utilized as standard procedure in the preprocessing of neuroimaging data.
                           Recent improvements in the quality of cortical surface modeling and improvements in its usability
                           nevertheless advocate this method. In the current study, we evaluated the benefits of an up-to-date
                           surface-based smoothing in comparison to volume-based smoothing. We focused on the effect of
                           signal contamination between different functional systems using the primary motor and primary
                           somatosensory cortex as an example. We were particularly interested in how this signal contamination
                           influences the results of activity and connectivity analyses for these brain regions. We addressed
                           this question by performing fMRI on 19 subjects during a tactile stimulation paradigm and by using
                           simulated BOLD responses. We demonstrated that volume-based smoothing causes contamination
                           of the primary motor cortex by somatosensory cortical responses, leading to false positive motor
                           activation. These false positive motor activations were not found by using surface-based smoothing for
                           reasonable kernel sizes. Accordingly, volume-based smoothing caused an exaggeration of connectivity
                           estimates between these regions. In conclusion, this study showed that surface-based smoothing
                           decreases signal contamination considerably between neighboring functional brain regions and
                           improves the validity of activity and connectivity results.

                           Over the past decades, functional brain imaging has become the leading tool to localize brain functions and to
                           decode the interactive relationship between specific brain areas. Both tasks require data analyses that assume we
                           can distinguish the signal time course between different brain areas. However, a common problem is the contam-
                           ination of the signal time course of one area with that of another. This remains a major challenge, particularly in
                           the analysis of MEG and EEG data where this problem has received much attention1. Although functional mag-
                           netic resonance imaging (fMRI) data are considered to be less affected by this problem, spatial smoothing can
                           induce the same signal contamination in brain areas that are close together. Spatial smoothing is a standard pre-
                           processing step in fMRI data analyses. It is usually performed using volumetric smoothing by a three-dimensional
                           Gaussian filter with a full width at half maximum (FWHM) size of several millimeters, denoted as “kernel” size2.
                           Clearly, smoothing leads to a mixture of the signal time courses of voxels captured by this filter. This signal aver-
                           aging can be beneficial if the voxels belong to the same functional region and increase the signal-to-noise ratio for
                           information about larger-scale brain areas. However, due to the folding of the brain, the spatial 3D distance from
                           one functional brain area to another could be small. Figure 1 shows an example of two localizations within the
                           pre- and postcentral gyrus that were only 4 mm apart but belonged to different functional systems (primary motor
                           and primary somatosensory cortex). Therefore, even small spatial filters with kernels of 3 to 9 mm might cause
                           contamination of somatosensory brain areas by motor signals and vice versa. Studies have estimated a smoothing
                           kernel size of ~8 mm to optimize cortical activation strength in robust experiments while even greater smoothing

                           1
                            Hans Berger Department of Neurology, Friedrich Schiller University Jena, Jena, Germany. 2Biomagnetic Center,
                           Friedrich Schiller University Jena, Jena, Germany. 3Department of Psychiatry, Friedrich Schiller University Jena, Jena,
                           Germany. *email: stefan.brodoehl@med.uni-jena.de

Scientific Reports |   (2020) 10:5737 | https://doi.org/10.1038/s41598-020-62832-z                                                              1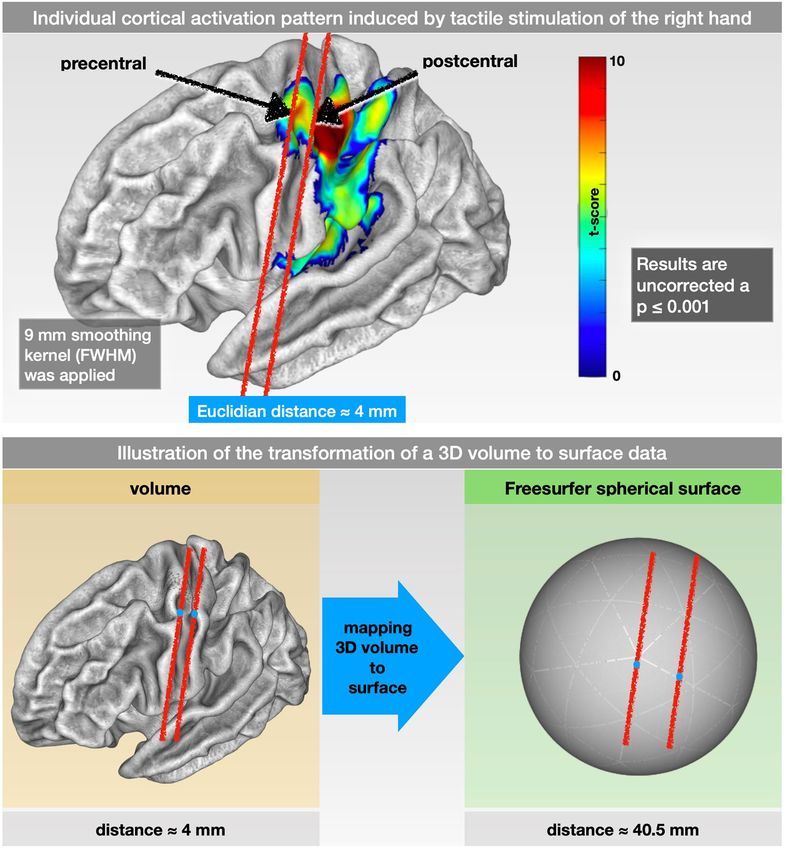
www.nature.com/scientificreports/                                                             www.nature.com/scientificreports

                           Figure 1. Individual cortical activation pattern (SPM maps) due to tactile stimulation and illustration of
                           the transformation of a 3D volume to surface data. (Upper row) Individual cortical activation pattern (SPM
                           maps) induced by tactile stimulation of the fingers of the right hand using a 9 mm FWHM (full width at half
                           maximum) Gaussian smoothing kernel. The arrows point to 2 exemplary locations within the primary motor
                           and the primary somatosensory cortex. However, being located in 2 different functional (motor vs. sensor)
                           and anatomical (pre- vs. postcentral gyrus) structures, their Euclidean distance within the 3D space was
                           only approximately 4 mm. (Lower) Illustration of the transformation of a 3D volume to surface data. The 2
                           exemplary locations within the pre- and postcentral gyrus in the original 3D volume are approximately 4 mm
                           apart. By mapping the 3D volume to the surface space (FreeSurfer spherical template), the same 2 points were
                           approximately 40 mm apart.

                           kernels are suggested for less robust experiments3. The chosen smoothing kernel did not only affect the size and
                           strength of the modeled brain activity but also causes changes in the localization of functional activations4.
                               The problem of a mixture of signals induced by smoothing is also important for analyses of the connectedness
                           between brain areas. Currently, measures of functional connectivity estimated by correlation analyses are the
                           most popular approach, and it is particularly sensitive to any mixture of signals. Therefore, volume-based spatial
                           smoothing can severely affect the results of connectivity analyses of neighboring brain regions.
                               A proposed improvement is the use of two-dimensional smoothing on the unfolded cortex (see Fig. 1 for
                           an illustration). This might be particularly helpful for the analysis of brain areas that are close together in the
                           folded brain but are more distant in the unfolded brain, such as the primary motor and primary somatosensory
                           cortex. Moreover, the restriction of smoothing to the cortical surface might provide more sensitive results for
                           cortical activations due to the exclusion of white matter and cerebrospinal fluid. The method of surface-based
                           smoothing has been proposed previously 5–8 but is currently not utilized as a standard procedure in the

Scientific Reports |   (2020) 10:5737 | https://doi.org/10.1038/s41598-020-62832-z                                                          2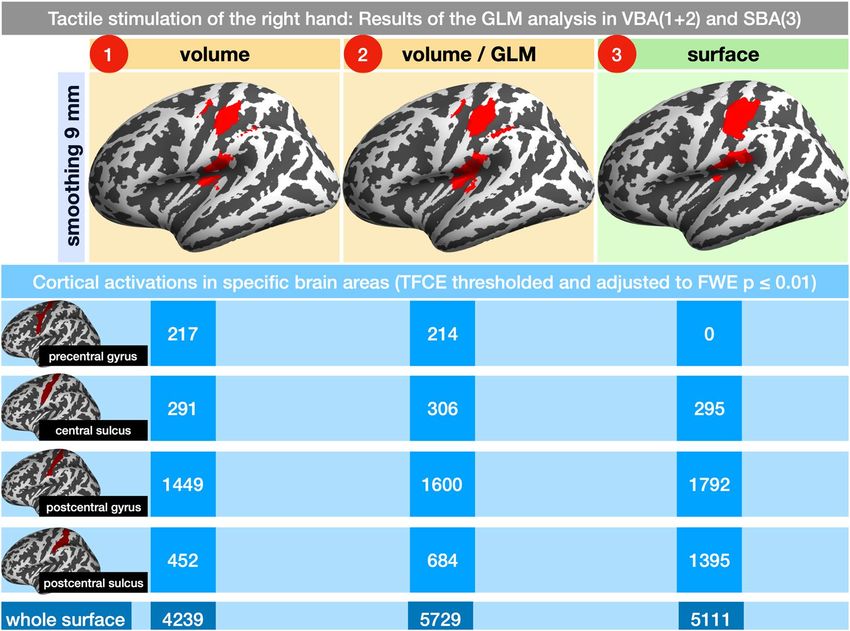
www.nature.com/scientificreports/                                                               www.nature.com/scientificreports

                           preprocessing of neuroimaging data. Although there are standardized pipelines (i.e., FreeSurfer fs-fast stream
                           or Human Connectome Project) to perform functional fMRI analysis on the cortical surface, this method is
                           currently not utilized as a standard procedure in the preprocessing of neuroimaging data8,9. Reasons for the reluc-
                           tance to use SBAs (SBA) might be problems with its usability and variations in the quality of the underlying sur-
                           face modeling. However, the modeling of the cortical surface, as well as its usability, has evolved and improved in
                           recent years10,11. Recent approaches have even employed resolutions of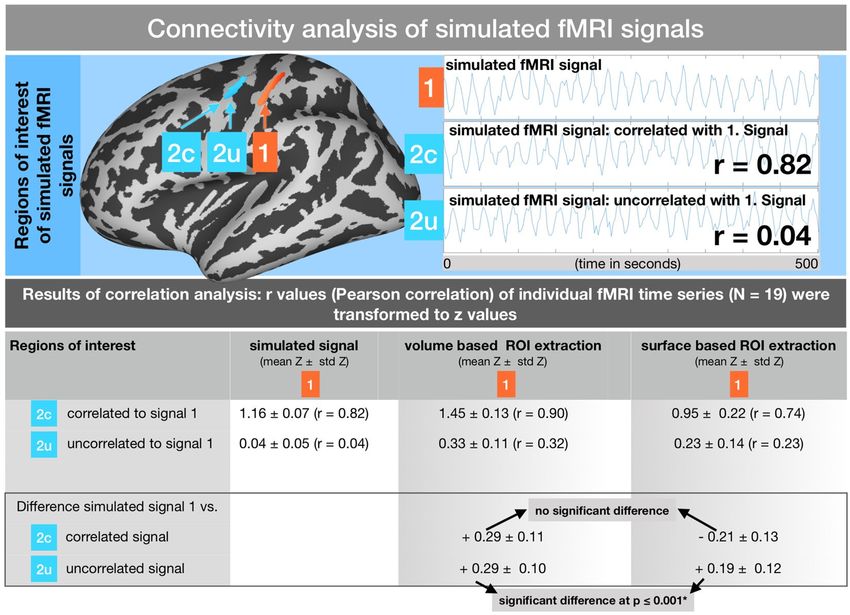
www.nature.com/scientificreports/                                                               www.nature.com/scientificreports

                           Figure 2. Schematic of different GLM analysis approaches. All approaches started from the same fMRI data.
                           Consequently, a slice time correction, a realignment and a co-registration to the corresponding structural
                           T1 image were performed. (1) In the first approach, the functional images were normalized and smoothed
                           (to 6, 9 and 12 mm) before applying the GLM. (2) In the second approach, the GLM was performed before
                           normalization and smoothing. (3) In the third approach, the GLM was performed in the individual space (as
                           in approach 2). Afterwards, the results were mapped to the individual surface and normalized to a standard
                           surface. The smoothing occurred on the normalized surface. Group analyses for all 3 approaches were
                           performed using a 1 sample t-test.

                           http://mialab.mrn.org/software), we created individual hemodynamic response function (HRF) signals for each
                           subject (signals occurred every 10 s and lasted 1 s) within the primary somatosensory cortex of each individual
                           fMRI time series14. For a detailed description, please view Fig. 3.
                              Analogously, in a second simulation, we added two different signals to the same rs-fMRIs within the primary
                           somatosensory cortex. According to the study of Martuzzi and colleagues15, we used the MNI coordinates of
                           the centers of the cortical representation of fingers D1 (−48.4 × −19.0 × 52.7) and D3 (−44.2 × −21.3 × 56).
                           Individual simulated HRF signals occurred in a randomized alternating order (every 10 s for 1 s).
                              Afterwards, the volume-based and surface-based GLM analyses were performed.

                           Multiple comparison correction. To overcome the problem of multiple comparisons, for all results from the
                           second-level analysis, we calculated the threshold-free cluster enhancement (TFCE) and adjusted it to a threshold
                           of p ≤ 0.01 familywise error (FWE) as provided in the CAT12 toolbox12,16.
                               For comparison, the results of the VBAs were consequently mapped to the normalized template surface. The
                           activations upon the surface were assessed using neuroanatomical labels provided by Destrieux and colleagues17.

                           Functional connectivity analysis of simulated fMRI signals. To evaluate the effect of a surface-based
                           analysis of functional connectivity, we created artificial fMRI signals (signal 1 in Fig. 4) with a frequency of
                           0.05 Hz and a random white noise portion of 20%, as well as corresponding signals that were correlated (signal
                           2c in Fig. 4) and uncorrelated (signal 2 u) to the first signal. For 19 individual rs-fMRI time series (210 images,
                           duration approximately 10 minutes), these signals were created separately and consequently added to regions
                           within the somatosensory (postcentral) and motor (precentral) cortices, as shown in Fig. 4. The amplitude of the
                           simulated signal for each region of interest (ROI) was incrementally increased until the final combined signal
                           (original local fMRI signal and added simulated signal) reached a correlation of at least 95% to the simulated
                           signal. For each individual fMRI time series, the final signal in the postcentral gyrus (1) was correlated between
                           r = 0.80 and r = 0.84 to the correlated signal (2c) and between r = 0.02 and r = 0.06 to the uncorrelated signal (2 u)
                           within the precentral gyrus.
                               Again, the regions-of-interest (ROIs) within the pre- and postcentral gyrus were created in a normalized
                           DARTEL template, and for each subject, individual ROIs within the individual volume space were made via
                           inverse transformation of the normalized ROI data. After adding the simulated signal to the individual fMRI data
                           in the individual space, we performed functional connectivity analysis between these regions using the following
                           VBA and SBA.

Scientific Reports |   (2020) 10:5737 | https://doi.org/10.1038/s41598-020-62832-z                                                             4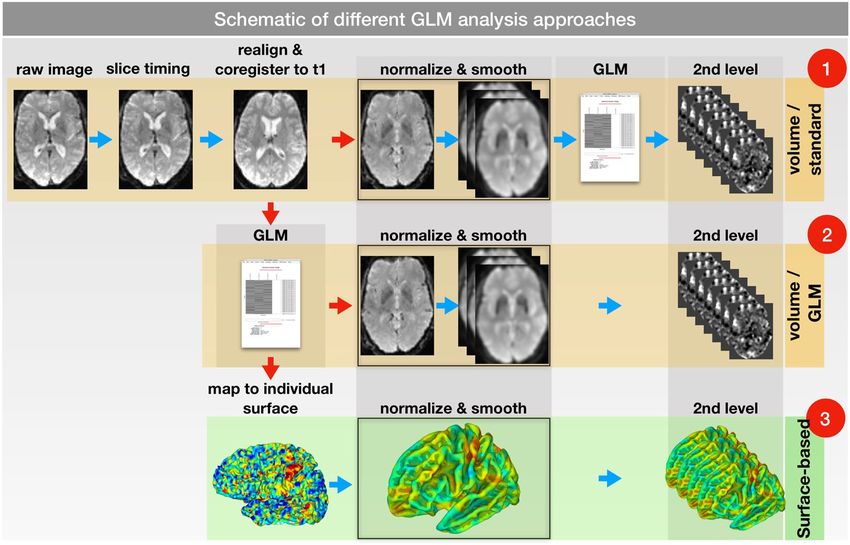
www.nature.com/scientificreports/                                                               www.nature.com/scientificreports

                           Figure 3. Schematic of HRF simulation. rs-fMRI data were co-registered to their corresponding structural
                           t1 image. Using a DARTEL template in normalized space, a region of interest (ROI) was defined within the
                           primary somatosensory cortex (S1); values of the ROI ranged from 1 (center) to 0 (6 mm distance) to modify
                           the amplitude of the simulated HRF. For each subject an individual HRF signal was created using the simTB-
                           Toolbox. After mapping the ROI to the individual space, the simulated HRF signals were added to individual rs-
                           fMRI time series. Afterwards, the GLM analysis was performed within the individual space; consequently, the
                           volume (2) and surface-based (3) group analyses were carried out.

                               The VBA consisted of the following steps: (1) normalization, (2) smoothing to 9 mm, (3) temporal filtering
                           between 0.01 and 0.1 Hz, (4) removal of the mean cerebrospinal-fluid (CSF) signal by linear regression, and (5)
                           extraction of the ROIs using the defined ROIs in normalized space.
                               For the SBA, the steps were as follows: (1) temporal filtering between 0.01 and 0.1 Hz and (2) removing the mean
                           CSF signal by linear regression. (3) Eventually, the 3D volumes (210 images) for each subject were mapped to the
                           surface, and normalization (including smoothing to 9 mm within the surface space) was performed upon the surface
                           space. For the surface mapping of the fMRI data, we applied a weighted-mean method that uses a Gaussian kernel
                           for mapping along the normals (weighted from 50% at the boundaries up to 100% at the center); this method is pro-
                           vided by the CAT12 toolbox. (4) Finally, ROI extraction was performed within the surface space.
                               For connectivity analysis, we performed a pairwise (Pearson) correlation of the mean time-series signals
                           within the postcentral (1) and precentral (2c/2 u) gyrus. For group analysis, a Fisher’s R/Z transformation was
                           performed (z = atanh(r)).

                           Statement of human rights. All procedures performed in studies involving human participants were in
                           accordance with the ethical standards of the institutional and/or national research committee (local ethics com-
                           mittee FSU Jena/reference number 4301-01/15) and with the 1964 Helsinki declaration and its later amendments
                           or comparable ethical standards.

                           Informed consent. Informed consent was obtained from all individual participants included in the study.
                           Results
                           GLM analysis of the cortical activation induced by tactile stimulation of the right hand. Both
                           VBA and the SBA returned robust activation patterns within the primary and secondary somatosensory cortices.
                           An overview of all cortical activations in the pre- and postcentral region for the VBA and SBA with different
                           smoothing sizes is provided in Table 1. Figure 5 summarizes a comparison of the activations within the pre- and
                           postcentral cortex between the VBA and the SBA with 9 mm FWHM smoothing. In Fig. S1, a comparison for
                           different smoothing sizes (0–12 mm) is provided.

                           Comparing both VBAs. Performing the GLM analysis prior to the spatial transformation resulted in more significant
                           activations within the primary and secondary somatosensory cortices (S1: 1472 vs. 1293 at 6 mm smoothing, 1600
                           vs. 1449 at 9 mm smoothing and 1679 vs. 1528 at 12 mm smoothing). However, this was accompanied by an increase
                           in activated brain areas outside the somatosensory cortex. Especially activations within the motor cortex (precentral
                           gyrus: 183 vs. 24 at 6 mm smoothing, 214 vs. 217 at 9 mm smoothing and 313 vs. 326 at 12 mm smoothing), the associ-
                           ation cortex (superior parietal lobule: 32 vs. 3 at 12 mm smoothing) and the temporal cortex (superior temporal lobule:
                           93 vs. 0 at 6 mm smoothing, 229 vs. 48 at 9 mm smoothing and 297 vs. 73 at 12 mm smoothing) were more pronounced.

Scientific Reports |   (2020) 10:5737 | https://doi.org/10.1038/s41598-020-62832-z                                                              5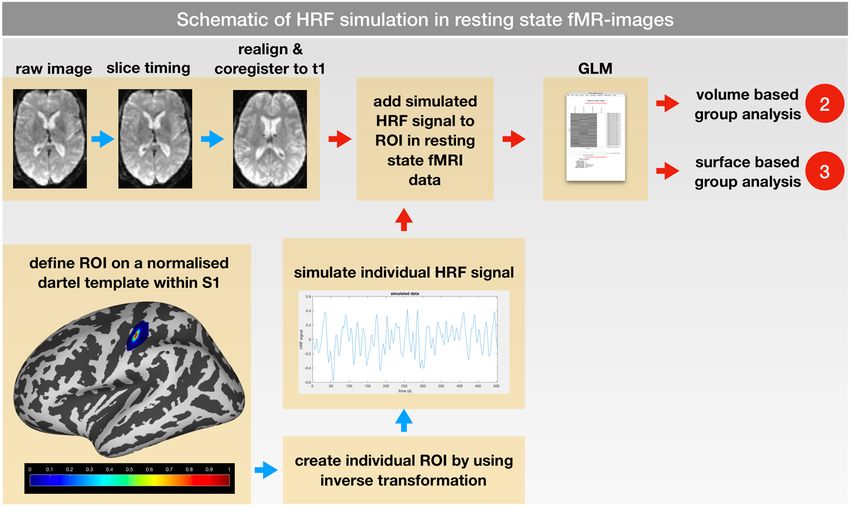
www.nature.com/scientificreports/                                                                            www.nature.com/scientificreports

                           Figure 4. Functional connectivity analysis of simulated fMRI signals within the pre- and postcentral gyri.
                           Upper part: Schematic of the creation of a simulated 0.05 Hz signal (signal 1) in the postcentral region.
                           Correlated (2c) and uncorrelated (2 u) signals placed into the precentral region. Lower part: Results of the
                           functional connectivity analysis between signal 1 and the correlated (2c) as well as the uncorrelated (2 u) signal
                           using the VBA and SBA. The difference between the designed correlation (r = 0.82 for 1~2c and r = 0.04 for
                           1~2 u) and the actual measured correlation is shown in the lower row. Significant differences between the VBA
                           and SBA are indicated.

                                                                                    volume/                     volume/                    volume/
                                                                           volume   GLM     surface   volume    GLM     surface   volume   GLM     surface
                            brain localization     atlas description       smoothing 6 mm FWHM        smoothing 9 mm FWHM         smoothing 12 mm FWHM
                            M1                     precentral gyrus        24       183     0         217       214     0         326      313     0
                            central sulcus         central sulcus          208      266     348       291       306     295       519      495     160
                            S1                     postcentral gyrus       1293     1472    1830      1449      1600    1792      1528     1679    1702
                            postcentral sulcus     postcentral sulcus      655      1130    1564      452       684     1395      452      859     913
                            parietal association   superior parietal
                                                                           0        0       0         0         0       0         3        32      0
                            cortex                 lobule
                                                   subcentral gyrus
                                                   and sulcus, insular
                            S2 / operculum         gyrus, circular and     193      1049    678       1051      1321    730       1136     1516    401
                                                   central sulcus of the
                                                   insula
                                                   anterior transverse
                            temporal lobule                                0        93      0         48        229     0         73       297     0
                                                   temporal gyrus

                           Table 1. SPM activations in brain areas (atlas: Destrieux 2009). Cortical activations in response to tactile
                           stimulation of fingers 2 and 4 were found in the primary (S1) and secondary (S2) somatosensory cortices, the
                           primary motor (M1) cortex and neighboring anatomical structures such as the central and postcentral sulci, the
                           parietal association cortex and the superior temporal lobule. The results are grouped according to the applied
                           smoothing strength of 6, 9 and 12 mm FWHM. Categories for each data column refer to the applied analysis
                           approach: volume - VBA (normalization and smoothing was performed prior to the estimation of the general
                           linear model [GLM]), volume/GLM - VBA (the GLM was estimated prior to the normalization and smoothing),
                           surface - SBA (normalization and smoothing of the GLM results on the mapped surface).

                           Comparing volume and SBAs. The surface-based GLM analysis revealed cortical activations within the primary
                           and secondary somatosensory cortices (S1: 1830 at 6 mm smoothing, 1792 at 9 mm smoothing, 1702 at 12 mm
                           smoothing; S2: 678 at 6 mm smoothing, 730 at 9 mm smoothing, 401 at 12 mm smoothing).

Scientific Reports |   (2020) 10:5737 | https://doi.org/10.1038/s41598-020-62832-z                                                                           6
www.nature.com/scientificreports/ www.nature.com/scientificreports
Figure 5. Comparing cortical activation patterns in specific brain regions of volume and SBAs induced by
tactile stimulation of the right hand. Cortical activations were counted in 4 brain regions (rows): precentral
gyrus, central sulcus, postcentral gyrus and sulcus and results for the 3 different approaches (aligned in
columns: 1–2 volume-based, 3 surface-based) were compared. Again, the results of the left cortex are shown
(corrected for multiple comparisons using TFCE and adjusted at p ≤ 0.01 FWE).
Brain areas outside the somatosensory cortex, such as the motor cortex (precentral gyrus), the parietal asso-
ciation cortex (superior parietal lobule) and the temporal lobe (anterior transverse temporal gyrus) did not pro-
vide any significant activation patterns. However, the structures directly neighboring the primary somatosensory
cortex (namely, the central and postcentral sulci) showed very similar activation patterns (central sulcus: 208
(volume) vs. 266 (volume / GLM) vs. 348 (surface) at 6 mm smoothing, 291 vs. 306 vs. 295 at 9 mm smoothing
and 519 vs. 495 vs. 160 at 12 mm smoothing; postcentral sulcus: 655 vs. 1130 vs. 1564 at 6 mm smoothing, 452 vs.
684 vs. 1395 at 9 mm smoothing and 452 vs. 859 vs. 913 at 12 mm smoothing)(Fig. 5).
Effect of the smoothing strength. As a general trend, we observed that with an increasing smoothing kernel, the
amount of activated regions in the VBAs increased, whereas the amount in the SBA decreased (i.e., S1: VBAs
24/183 at 6 mm, 217/214 at 9 mm and 326/313 at 12 mm smoothing, for the SBA: 1830 at 6 mm, 1792 at 9 mm and
1702 at 12 mm smoothing). To test for significance of this observation, we created a GLM where the amount of
clusters in the brain areas, described in Table 1, for each approach were the dependent factors and the strength of
the kernel (FWHM) and the brain localization were the independent factors. In all 3 approaches the strength of
the smoothing filter (6, 9 and 12 mm) was a significant factor to explain the model at p ≤ 0.05.
Figure S1 in the supplementary material shows the effect of the smoothing strength from 0 (no smoothing) up
to 12 mm with the VBA and the SBA.
Somatotopic finger representation in simulated brain activity. The results of the comparison of the VBA and
SBA in GLM analysis with simulated brain activity in the somatotopic regions for fingers D1 and D3 are shown
in Fig. S2. The best segregation of individual fingers D1 and D3 was achieved with 3 mm smoothing size in both
the VBA and the SBA; the accuracy of the overlap of simulated voxels and activated voxels was 83% in the VBA
and 97% in the SBA. With increasing smoothing factor, the activation patterns of D1 and D3 were blurred. In all
VBA results, there were false-positive activation patterns within the precentral cortex. Overall, there were more
activated voxels in the postcentral region in the VBA (smoothing 0 mm: 16; 3 mm: 27; 6 mm: 81) than in the SBA
(0 mm: 11; 3 mm: 23; 6 mm: 44).
GLM analysis of simulated HRF signals within the primary somatosensory cortex. Since
co-activation within the precentral cortex due to somatosensory stimuli is commonly observed and might be
connected to real physiological brain activity, we intended to evaluate the effect of the volume and surface-based
Scientific Reports | (2020) 10:5737 | https://doi.org/10.1038/s41598-020-62832-z 7www.nature.com/scientificreports/ www.nature.com/scientificreports
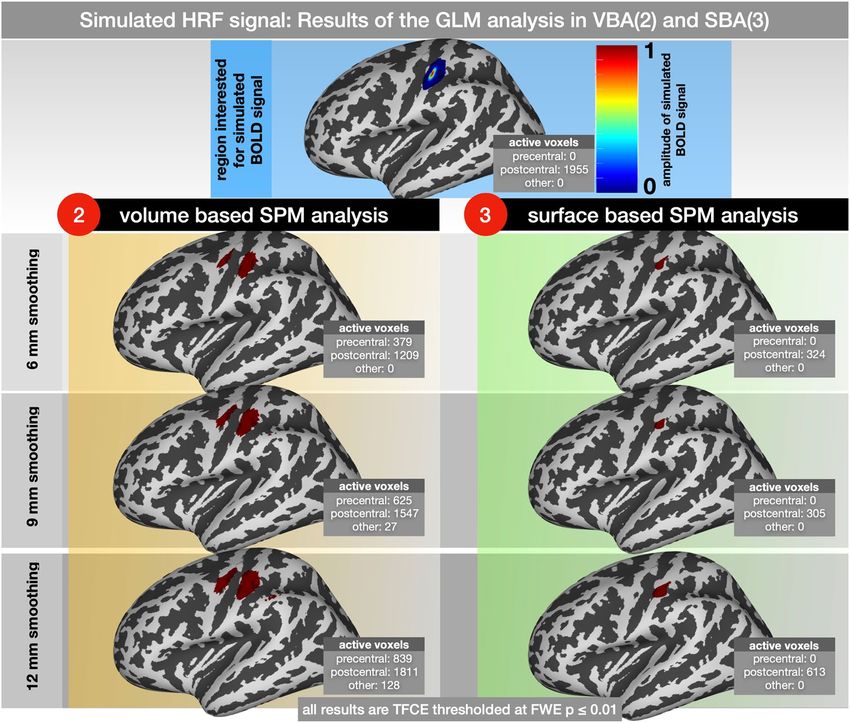
Figure 6. Results of the SPM analysis of a simulated HRF signal. The simulated BOLD signal occurred every
10 s and lasted 1 s. GLM-results were smoothed using 6, 9 and 12 mm; 2nd level results were corrected for
multiple comparisons and adjusted at p ≤ 0.05 FWE. The number of active voxels within the precentral and
postcentral gyri are displayed for each separate analysis.
GLM analysis on a pre-known cortical signal limited to the postcentral cortex. The results of the volume and
surface-based GLM analysis are summarized in Fig. 6.
Volume and SBAs could identify the simulated HRF signal within the primary somatosensory cortex. While
using the VBA, the size of the activated brain area increased (1209 at 6 mm, 1547 at 9 mm and 1811 at 12 mm
smoothing), and the brain activation pattern identified with the SBA remained more focalized (324 at 6 mm, 305
at 9 mm and 613 at 12 mm smoothing). Using the SBA, no activation patterns were found outside the simulated
area in the postcentral cortex. On the contrary, using the VBA, cortical activations were observed in nearby
regions in the volume, such as the precentral cortex (379 at 6 mm, 625 at 9 mm and 839 at 12 mm smoothing) and
more caudal parietal cortex (0 at 6 mm, 27 at 9 mm and 128 at 12 mm smoothing).
Connectivity analysis of simulated signals within the primary motor and somatosensory cor-
tices. Connectivity of pairs of correlated (1~2c in Fig. 4) and uncorrelated (1~2 u in Fig. 4) simulated fMRI
signals within the pre- and postcentral cortices were analyzed in 19 individual rs-fMRI time series.
Functional connectivity of two correlated signals in nearby brain regions. High signal correlations within the
pre- and postcentral cortices could be detected using both the volume and surface-based time series extraction
approaches. However, while the original correlation between the two signals was designed to have a Pearson
correlation coefficient of about r = 0.82, the VBA revealed an increased correlation coefficient of r = 0.90 and the
SBA revealed a decreased coefficient of r = 0.74. Within the group analysis, the difference between the volume
and SBA did not significantly vary from the original correlation coefficient of r = 0.82 (using a 2-sample t-test on
the transformed z values).
Functional connectivity in two uncorrelated signals in nearby brain regions. Both methods using surface and
volume-based time series extraction showed a considerably increased correlation coefficient for the two uncorre-
lated signals (simulated signal correlation: r = 0.04, VBA: r = 0.33, SBA: r = 0.23). Comparing the deviation of the
average r/z transformed coefficients for each different approach and the original simulated signal, the difference
between both approaches was significant in a 2-sample t-test (at p ≤ 0.01). Thus, the deviation of the correlation
coefficient was less pronounced with the SBA.
Scientific Reports | (2020) 10:5737 | https://doi.org/10.1038/s41598-020-62832-z 8www.nature.com/scientificreports/ www.nature.com/scientificreports
Discussion
In the present study, we compared the effects of volume-based and surface-based smoothing on activity patterns
and functional connectivity of neighboring brain regions. Taking the primary somatosensory and motor cortices
as a typical example, we were particularly interested in the effects of signal contamination between these regions.
Tactile stimulation of fingers 2 and 4, as used in the current experiment, produced robust activation pat-
terns in the contralateral primary somatosensory cortex by both the standard volume-based and surface-based
smoothing approaches. The spatial location of the maximum activity was in line with previous fMRI studies18–21
and showed only slight divergences between volume- and surface-based smoothing.
A main objective of the present study is the comparison of the VBA and SBA regarding brain activity around
the central sulcus, namely, the motor (precentral) and somatosensory (postcentral) cortices. By implication, dif-
ferent scientific questions involve different techniques, and this is especially true for fMR imaging22–24. We think
that our approach and argumentation concerning brain activity using standard 3 T fMR imaging is appropriate for
many recent studies investigating the pre- and postcentral regions. However, any kind of applied filter, whether in
the spatial or the temporal domain, must be reviewed critically25,26. Especially in single-case studies or in special
settings such as high-resolution imaging, common spatial filtering can be considered counterproductive27. On
the other hand, the SBA can potentially improve scenarios where smaller spatial scales (than pre- and central
cortex) and functional heterogeneity, i.e., somatotopic, retinotopic or tonotopic representation, are involved28.
The registration of individual MR data on the surface can improve accuracy and therefore the localization of small
cortical structures29,30.
Task-fMRI: GLM. We applied two different pipelines for the VBA (Fig. 2, rows 1 and 2). While the first
approach (normalize & smooth > GLM > 2nd-level analysis) resembles the standard SPM pipeline, the sec-
ond (GLM in native space > normalize & smooth > 2nd-level analysis) is more similar to the FSL pathway31.
The main purpose of using the second volume approach was to use the same individual 1st-level results for
the volume- and surface-based group analyses and therefore make the effects of volume and surface smoothing
comparable. The results of the two VBAs slightly differed (Table 1 and Fig. 5) and illustrate the effects of pre- and
poststatistics normalization31.
The most common approach to compare brain activity using fMR imaging is by comparing time-series data
in a voxel-by-voxelwise manner. For group analyses, a spatial normalization to a normalized space has to be
performed at some point of the analysis procedure. Volume-based registration includes the whole brain volume,
including different tissue types (for a review see Klein32). Surface-based methods approach spatial normalization
from another perspective. SBAs use surface parameters such as sulci to match corresponding brain regions across
individuals (for a review, see Klein33). In general, SBAs are based on more accurate coregistration and reduce the
brain volume to the cortex itself34.
For VBA and SBA, an essential step for the precise anatomical representation of the functional individual data
is the precise registration of structural and functional images. Since DARTEL and nonlinear registration increase
the accuracy, we applied both methods to register the functional to the structural images35.
GLM: somatosensory cortex activations. Within the primary somatosensory cortex, we found more activations
using surface-based smoothing for each tested kernel size. The extent of the activated brain volume increased
with the kernel size of volume-based smoothing, while the activated brain volume stayed relatively stable under
different kernel sizes of surface-based smoothing. These findings were in agreement with previous studies that
investigated simulated BOLD responses5 and experimental fMRI data36. The reduced influence of noise outside
the gray matter in surface-based smoothing was suggested as a main cause of these differences37,38.
Even without spatial smoothing, there was significant brain activation in the somatosensory cortex using the
SBA (Fig. S1). With the VBA, no activation survived the correction threshold. This is most likely due to the supe-
rior spatial registration and alignment across subjects, especially at the location of the central sulcus34,39,40; this
matter will be further discussed in the study’s limitations below.
At a smoothing size of 3 mm, the best somatotopic segregation of fingers 1 and 3 was achieved with the VBA
and SBA. A similar smoothing size was found to be adequate for finger somatotopy with similar fMRI parame-
ters41–43. With the SBA, the overlap of activated and previously stimulated voxels was higher (83% vs 97%) and
the overall occurrence of false-positive activations was lower than with the VBA. It is conclusive to assume that
the superior registration of the postcentral structures in the SBA is the reason for the better finger segregation in
the cortical activation pattern29. Although surface mapping of functional MR data has recently been used in other
brain regions, such as the visual and auditive44–46 systems, to our knowledge, there is no systematic comparison
between the VBA and SBA available.
GLM: false positive motor cortex activation. The primary research question of the current study was to delineate
the effect of volume and surface based smoothing methods on brain areas that are near the activated brain region
but not engaged in the experimental task. For our exemplary investigation of the primary motor- and somatosen-
sory cortices, we were interested in the effects of brain responses within the primary somatosensory cortex on the
primary motor cortex. Using volume-based smoothing, we found false positive activations within the primary
motor cortex for all kernel sizes. In our study, we chose kernel sizes of 6, 9, and 12 mm to cover the most common
kernels in recent imaging literature47; however, the most common kernel size is the 8-mm FWHM, which is the
default value in SPM39. The activated part of the primary motor cortex was located in direct (volumetric) prox-
imity to the activated part of the primary somatosensory cortex. From the experimental data alone, one could
formally argue that tactile stimulation might also activate the motor cortex. However, this is not supported by
previous studies19,48,49. More importantly, the similarity of the motor activation pattern between the experimental
Scientific Reports | (2020) 10:5737 | https://doi.org/10.1038/s41598-020-62832-z 9www.nature.com/scientificreports/ www.nature.com/scientificreports
(Fig. 5) and simulated (Fig. 6) data did not support this argument. Accordingly, no significant activation of the
primary motor cortex was found using the surface-based smoothing approach in simulated and experimental
data.
The activation of the primary motor cortex can therefore be interpreted as false positive activation caused by
an artificial signal contamination across the neighboring sulcal border induced by volume-based smoothing. This
interpretation is further strengthened by the finding that the activity in the motor cortex increased with the size
of the volume-based smoothing kernel, suggesting a simple blurring effect across the border of the central sulcus.
Although the interpretation of motor activation as artifacts might be straightforward in the current study,
such interpretations can be far more difficult in other experimental designs. To stay with the example of the pri-
mary somatosensory cortex, one of the most often used stimuli is electrical stimulation of the median nerve due
to its simple use, exact controllability in time and strength as well as its associated reliable cortical activations49–51.
However, the median nerve is a mixed sensory/motor nerve, and it could be argued that electrical activation of
this nerve might also provide feedback information that is processed in the primary motor cortex. Because it is
currently an unanswered question, any activation of the primary motor cortex due to a median nerve stimulus
cannot be definitively differentiated between a blurring effect of the volume-based smoothing and true activa-
tion. Similar ambiguities are known for a multitude of spatially adjacent functional systems. Separating cortical
responses between neighboring areas using fMRI is particularly important for the interpretation of data obtained
by other methods, such as MEG and EEG, which address lower spatial resolution52–54. Therefore, surface-based
smoothing approaches are important and well suited for answering questions about co-activations of neighboring
brain regions.
GLM: false negative somatosensory cortex activation in simulated data. We demonstrated that surface-based
smoothing can reduce the rate of false-positive activations in the primary motor cortex. Thus, it increases spec-
ificity and precision (positive predictive value) in both real and simulated brain activity37. At first glance, the
opposite is true for the sensitivity of cortical activation within the somatosensory cortex. As shown in Fig. 6,
surface-based SPM analysis could identify only 1/6 to 1/3 of the simulated HRF signals in the postcentral region.
Instead, the VBA could positively identify more than 90% of the simulated 1955 voxels.
To further investigate this issue, we considered different smoothing sizes (0–12 mm) from the GLM analysis
of real brain activity induced by tactile stimulation of fingers 2 and 4 of the right hand (Fig. S1). We observed that
the activated brain region within the somatosensory cortex is less significantly influenced by the smoothing size
in the SBA than in the VBA. More importantly, the amount of activations in the somatosensory cortex detected
by the SBA is slightly above the amount detected by the VBA.
Our results suggest that the loss of sensitivity in the SBA is exclusive to the simulated data. Accordingly, in
Fig. S2 (here, we simulated local brain activity of different fingers in the somatosensory cortex), the activated
brain regions are less abundant in the SBA. It is plausible to assume that the reason for this discrepancy is the
methodological approach here. Simulated HRF is added to resting-state brain activity of each subject in the indi-
vidual space and is based on an ROI defined in volume space (please see Fig. S3 in the supplementary fur further
illustration). Most likely, some SPM activation patterns in the volume are not mapped to the surface, because they
are not registered as grey matter. In general this might represent one of the mayor advantages of SBA, because
only signals that originate from the cortex are processed in the SBA55. This is particularly useful when dealing
with artifacts, mislocalizations or superficial vascular artifacts56,57.
Nonetheless, we have to acknowledge, that the SBA might trade a reduction of false positive activation pat-
terns with an increase of false negatives as well.
rs-FMRI: connectivity analysis. Signal contamination between adjacent areas should also affect the anal-
ysis of their connectedness. By estimating the functional connectivity between the primary somatosensory and
primary motor cortices, we demonstrated increased estimates for the connectedness by using volume-based
smoothing. This finding is well in agreement with the blurring effect of the volume-based smoothing kernel that
causes a mixture between somatosensory- and motor signals and leading to increased signal correlation. This
result is not only of theoretical interest as it might affect results of studies that estimated the functional connec-
tivity between the primary somatosensory and primary motor cortex58–60, but it is also generalizable to other
studies investigating the functional connectedness of neighboring brain regions. Regarding two signals located
in the pre- and postcentral gyrus that were explicitly designed to be uncorrelated, we found inflated functional
connectivity in both the VBA and the SBA. Although less pronounced in the SBA, this finding demonstrates that
smoothing creates false-positive correlations. Speaking in terms of connectivity, spatial smoothing might fake
connectivity where none is present61,62. Surface-based smoothing can be considered to improve the validity of
these analyses63–65.
With respect to the problems induced by spatial smoothing, some studies have renounced smoothing com-
pletely for high-field fMRI and specific questions about very restricted brain areas8,66,67. However, for most exper-
imental designs, smoothing is a necessary tool as it improves the signal to noise ratio, increases the validity of
statistical assumptions underlying the random field theory and decreases statistical effects of inter-individual ana-
tomical differences2. Therefore, volume-based smoothing is nevertheless a valuable tool in the analysis of fMRI
data. Surface-based smoothing can improve fMRI results compared to volume-based smoothing for certain ques-
tions and avoid ambiguity in the interpretation activity and connectivity of spatially neighboring areas. However,
surface-based smoothing requires precise surface modeling, which limits its usability. Particularly, surface-based
smoothing is only of limited use for subcortical structures and is not applicable for the cerebellar cortex today.
Using the CAT12 toolbox, the SBA described in this study can easily be employed for recent fMRI stud-
ies. Thus, the group analysis is performed on a normalized surface, and the standard SPM pathways for the
Scientific Reports | (2020) 10:5737 | https://doi.org/10.1038/s41598-020-62832-z 10www.nature.com/scientificreports/ www.nature.com/scientificreports
second-level analysis are supported. Furthermore, using the cross-platform file format GIFTI as provided in
CAT12, the results can be compared with other systems (i.e., FreeSurfer).
Study limitations. The main concern of our study was to emphasize the benefits of a SBA in the analysis of
fMRI data. However, due to the availability of a vast spectrum of different techniques for both 3D volume- and
SBAs, we had to restrict the applied methods to a selection of what we think is a good overview over most recently
applied methods68,69.
For the anatomical localization and comparisons, we analyzed the activation patterns on the surface with
both the 3D volume- and the SBA. Here, we used the Destrieux2009 surface atlas as provided within the CAT12
toolbox17. This atlas focuses on sulco-gyral structures, and it is well suited to visualize the effect of volume/surface
smoothing upon neighboring gyri in the central region. However, there are many recent atlases that derive from
functional network parcellations8,70; for instance, the multimodal parcellation of the Human Connectome Project
by Glasser and colleagues71 is directly available within the CAT12 toolbox.
To compare the results of the volume- and SBAs, we mapped the results of the volume-based analysis onto a
standard template surface (32k-mesh HCP compatible) as provided within the CAT12 toolbox. Since we mapped
smoothed and group-averaged volume data to the surface, a biased representation has to be taken into account.
However, since the target anatomical structures of this study were localized around the central sulcus, which is
strongly consistent across subjects, we think that this bias is less impactful39,40.
The application of spatial smoothing in neuroimaging has been questioned by many recent studies40,72. In
general, smoothing can improve the signal-to-noise ratio, compensate for imprecise registration, and help to
fulfil statistical conditions. On the downside, spatial smoothing blurs data between tissue compartments and
between cortical regions. In addition, smoothing can affect results in task- and rs-fMRI data in single-subject
and multisubject experiments61,62. Recent approaches circumventing the pitfalls of spatial smoothing include
more accurate alignment of the data on the surface73, parcellating data71, and removing structured noise from
the data74.
To evaluate the effect of the VBA and the SBA in GLM and connectivity analysis, we used experimental fMRI
data and rs-fMRI data with artificial signals to simulate brain activity and connectivity in certain brain regions.
The method of using empirical rs-fMRI data and generating simulated images is a common approach for eval-
uating different strategies of imaging analysis (The Impact of Spatial Normalization Strategies on the Temporal
Features of the Resting-State Functional MRI: Spatial Normalization Before rs-fMRI Features Calculation May
Reduce the Reliability.). Our main objective was to investigate the effects of the VBA and SBA on brain activ-
ity originating from the postcentral cortex. Therefore, defining the ROIs in a volume-based DARTEL template
using atlas definitions provided by the CAT12 toolbox is appropriate. However, in different research questions,
the ROI acquisition strategy must differ. In addition to different spatial scales (i.e. much larger or much smaller
regions), different imaging parameters (i.e. high-resolution fMRI), there are also different surface parcellations
to consider8,22,70,71.
Furthermore, there is, of course, the problem of multiple comparisons in group comparisons. Here, we applied
the method of threshold-free cluster enhancement (TFCE), which can be considered an improvement compared
to cluster-based thresholding because it makes the prior definition of a cluster threshold redundant16. However,
while cluster-based methods can enhance spatial clusters, these methods also appear to be more vulnerable to
spatial autocorrelation functions that violate the assumption of a Gaussian distribution in random field theory75,76.
Since the underlying presumption in the random field theory of uniformly distributed data is not completely ade-
quate in fMRI statistics, nonparametric permutation methods might present an alternative approach75,77.
Conclusion
We demonstrated that surface-based smoothing provides increased spatial acuity of cortical activation compared
with volume-based smoothing. The advantages of surface-based smoothing are most pronounced for regions
that are close together in the folded areas in the 3D volume because unfolding the brain to the surface space spa-
tially segregates these regions. For these neighboring brain regions, we demonstrated that surface-based smooth-
ing also improved the reliability of analyses of their connectedness, especially by removing artificially increased
connectivity of spatial nearby regions. More general benefits are derived from the improved image registration,
especially in intersubject analysis.
Data availability
Anonymized fMRI data and simulated data will be available upon request by the author: stefan.brodoehl@med.
uni-med.uni-jena.de.
Received: 4 July 2019; Accepted: 11 March 2020;
Published: xx xx xxxx
References
1. Puce, A. & Hämäläinen, M. S. A Review of Issues Related to Data Acquisition and Analysis in EEG/MEG Studies. Brain sciences 7
(2017).
2. Friston, K., Ashburner, J., Kiebel, S., Nichols, T. & William, P. Statistical Parametric Mapping: The Analysis of Functional Brain Images.
(Academic Press, 2007).
3. Mikl, M. et al. Effects of spatial smoothing on fMRI group inferences. Magnetic resonance imaging 26, 490–503 (2008).
4. Sacchet, M. D. & Knutson, B. Spatial smoothing systematically biases the localization of reward-related brain activity. NeuroImage
66, 270–277 (2013).
5. Andrade, A. et al. Detection of fMRI activation using cortical surface mapping. Human brain mapping 12, 79–93 (2001).
6. Lerch, J. P. & Evans, A. C. Cortical thickness analysis examined through power analysis and a population simulation. NeuroImage
24, 163–173 (2005).
Scientific Reports | (2020) 10:5737 | https://doi.org/10.1038/s41598-020-62832-z 11www.nature.com/scientificreports/ www.nature.com/scientificreports
7. Hagler, D. J., Saygin, A. P. & Sereno, M. I. Smoothing and cluster thresholding for cortical surface-based group analysis of fMRI data.
NeuroImage 33, 1093–1103 (2006).
8. Glasser, M. F. et al. The minimal preprocessing pipelines for the Human Connectome Project. NeuroImage 80, 105–124 (2013).
9. Fischl, B. FreeSurfer. NeuroImage 62, 774–781 (2012).
10. Dahnke, R., Yotter, R. A. & Gaser, C. Cortical thickness and central surface estimation. NeuroImage 65, 336–348 (2013).
11. Yotter, R. A., Dahnke, R., Thompson, P. M. & Gaser, C. Topological correction of brain surface meshes using spherical harmonics.
Human brain mapping 32, 1109–1124 (2011).
12. Gaser, C., Volz, H. P., Kiebel, S., Riehemann, S. & Sauer, H. Detecting structural changes in whole brain based on nonlinear
deformations-application to schizophrenia research. NeuroImage 10, 107–113 (1999).
13. Kiebel, S. J., Ashburner, J., Poline, J. B., Friston, K. J. & MRI, P. E. T. coregistration–a cross validation of statistical parametric
mapping and automated image registration. NeuroImage 5, 271–279 (1997).
14. Erhardt, E. B., Allen, E. A., Wei, Y., Eichele, T. & Calhoun, V. D. SimTB, a simulation toolbox for fMRI data under a model of
spatiotemporal separability. NeuroImage 59, 4160–4167 (2012).
15. Martuzzi, R., van der Zwaag, W., Farthouat, J., Gruetter, R. & Blanke, O. Human finger somatotopy in areas 3b, 1, and 2: a 7T fMRI
study using a natural stimulus. Human brain mapping 35, 213–226 (2014).
16. Smith, S. M. & Nichols, T. E. Threshold-free cluster enhancement: addressing problems of smoothing, threshold dependence and
localisation in cluster inference. NeuroImage 44, 83–98 (2009).
17. Destrieux, C., Fischl, B., Dale, A. & Halgren, E. Automatic parcellation of human cortical gyri and sulci using standard anatomical
nomenclature. NeuroImage 53, 1–15 (2010).
18. Ann Stringer, E. et al. Distinct fine-scale fMRI activation patterns of contra- and ipsilateral somatosensory areas 3b and 1 in humans.
Human brain mapping 35, 4841–4857 (2014).
19. Klingner, C. M. et al. Functional deactivations: multiple ipsilateral brain areas engaged in the processing of somatosensory
information. Human brain mapping 32, 127–140 (2011).
20. Ruben, J. et al. Sub-area-specific Suppressive Interaction in the BOLD responses to simultaneous finger stimulation in human
primary somatosensory cortex: evidence for increasing rostral-to-caudal convergence. Cerebral cortex (New York, N.Y.: 1991) 16,
819–826 (2006).
21. Tal, Z., Geva, R. & Amedi, A. Positive and Negative Somatotopic BOLD Responses in Contralateral Versus Ipsilateral Penfield
Homunculus. Cerebral cortex (New York, N.Y.: 1991) 27, 962–980 (2017).
22. Eickhoff, S. B., Yeo, B. T. T. & Genon, S. Imaging-based parcellations of the human brain. Nature reviews. Neuroscience 19, 672–686.
23. Poldrack, R. A. & Farah, M. J. Progress and challenges in probing the human brain. Nature 526, 371–379.
24. Soares, J. M. et al. A Hitchhiker’s Guide to Functional Magnetic Resonance Imaging. Frontiers in neuroscience 10, 515 (2016).
25. Friston, K. J. et al. To smooth or not to smooth? Bias and efficiency in fMRI time-series analysis. NeuroImage 12, 196–208.
26. Caballero-Gaudes, C. & Reynolds, R. C. Methods for cleaning the BOLD fMRI signal. NeuroImage 154, 128–149 (2017).
27. Khan, R. et al. Surface-based analysis methods for high-resolution functional magnetic resonance imaging. Graphical models 73,
313–322.
28. Van Essen, D. C. Surface-based approaches to spatial localization and registration in primate cerebral cortex. NeuroImage 23(Suppl
1), S97–107 (2004).
29. Pfannmöller, J. P., Greiner, M., Balasubramanian, M. & Lotze, M. High-resolution fMRI investigations of the fingertip somatotopy
and variability in BA3b and BA1 of the primary somatosensory cortex. Neuroscience 339, 667–677.
30. Henriksson, L., Karvonen, J., Salminen-Vaparanta, N., Railo, H. & Vanni, S. Retinotopic maps, spatial tuning, and locations of
human visual areas in surface coordinates characterized with multifocal and blocked FMRI designs. PloS one 7, e36859 (2012).
31. Poldrack, R. A., Nichols, T. & Mumford, J. Handbook of Functional MRI Data Analysis. (Cambridge University Press, 2011).
32. Klein, A. et al. Evaluation of 14 nonlinear deformation algorithms applied to human brain MRI registration. NeuroImage 46,
786–802 (2009).
33. Klein, A. et al. Evaluation of volume-based and surface-based brain image registration methods. NeuroImage 51, 214–220 (2010).
34. Tucholka, A., Fritsch, V., Poline, J.-B. & Thirion, B. An empirical comparison of surface-based and volume-based group studies in
neuroimaging. NeuroImage 63, 1443–1453 (2012).
35. Pizzagalli, F., Auzias, G., Delon-Martin, C. & Dojat, M. Local landmark alignment for high-resolution fMRI group studies: toward a
fine cortical investigation of hand movements in human. Journal of neuroscience methods 218, 83–95 (2013).
36. Anticevic, A. et al. Comparing surface-based and volume-based analyses of functional neuroimaging data in patients with
schizophrenia. NeuroImage 41, 835–848 (2008).
37. Jo, H. J. et al. Spatial accuracy of fMRI activation influenced by volume- and surface-based spatial smoothing techniques.
NeuroImage 34, 550–564 (2007).
38. Kiebel, S. J., Goebel, R. & Friston, K. J. Anatomically informed basis functions. NeuroImage 11, 656–667 (2000).
39. Coalson, T. S., Essen, D. C. V. & Glasser, M. F. Lost in Space: The Impact of Traditional Neuroimaging Methods on the Spatial
Localization of Cortical Areas. bioRxiv (2018).
40. Glasser, M. F. et al. The Human Connectome Project’s neuroimaging approach. Nature neuroscience 19, 1175–1187 (2016).
41. van Westen, D. et al. Fingersomatotopy in area 3b: an fMRI-study. BMC neuroscience 5, 28.
42. Nelson, A. J. & Chen, R. Digit somatotopy within cortical areas of the postcentral gyrus in humans. Cerebral cortex 18, 2341–2351
(New York, N.Y.: 1991).
43. Schweizer, R., Voit, D. & Frahm, J. Finger representations in human primary somatosensory cortex as revealed by high-resolution
functional MRI of tactile stimulation. NeuroImage 42, 28–35.
44. Arcaro, M. J., McMains, S. A., Singer, B. D. & Kastner, S. Retinotopic organization of human ventral visual cortex. The Journal of
neuroscience: the official journal of the Society for Neuroscience 29, 10638–10652.
45. Humphries, C., Liebenthal, E. & Binder, J. R. Tonotopic organization of human auditory cortex. NeuroImage 50, 1202–1211.
46. Ahveninen, J. et al. Intracortical depth analyses of frequency-sensitive regions of human auditory cortex using 7TfMRI. NeuroImage
143, 116–127.
47. Carp, J. The secret lives of experiments: methods reporting in the fMRI literature. NeuroImage 63, 289–300 (2012).
48. Hlushchuk, Y. & Hari, R. Transient suppression of ipsilateral primary somatosensory cortex during tactile finger stimulation. The
Journal of neuroscience: the official journal of the Society for Neuroscience 26, 5819–5824 (2006).
49. Nihashi, T. et al. Contralateral and ipsilateral responses in primary somatosensory cortex following electrical median nerve
stimulation–an fMRI study. Clinical neurophysiology: official journal of the International Federation of Clinical Neurophysiology 116,
842–848 (2005).
50. Backes, W. H., Mess, W. H., van Kranen-Mastenbroek, V. & Reulen, J. P. Somatosensory cortex responses to median nerve
stimulation: fMRI effects of current amplitude and selective attention. Clinical neurophysiology: official journal of the International
Federation of Clinical Neurophysiology 111, 1738–1744 (2000).
51. Klingner, C. M., Hasler, C., Brodoehl, S. & Witte, O. W. Dependence of the negative BOLD response on somatosensory stimulus
intensity. NeuroImage 53, 189–195 (2010).
52. Karhu, J. & Tesche, C. D. Simultaneous early processing of sensory input in human primary (SI) and secondary (SII) somatosensory
cortices. Journal of neurophysiology 81, 2017–2025 (1999).
Scientific Reports | (2020) 10:5737 | https://doi.org/10.1038/s41598-020-62832-z 12www.nature.com/scientificreports/ www.nature.com/scientificreports
53. Klingner, C. M. et al. Parallel processing of somatosensory information: Evidence from dynamic causal modeling of MEG data.
NeuroImage 118, 193–198 (2015).
54. Mideksa, K. G. et al. Source analysis of median nerve stimulated somatosensory evoked potentials and fields using simultaneously
measured EEG and MEG signals. Conference proceedings:… Annual International Conference of the IEEE Engineering in Medicine
and Biology Society. IEEE Engineering in Medicine and Biology Society. Annual Conference 2012, 4903–4906 (2012).
55. Jo, H. J. et al. Surface-based functional magnetic resonance imaging analysis of partial brain echo planar imaging data at 1.5 T.
Magnetic resonance imaging 27, 691–700.
56. Ress, D., Glover, G. H., Liu, J. & Wandell, B. Laminar profiles of functional activity in the human brain. NeuroImage 34, 74–84.
57. Moon, C.-H., Fukuda, M., Park, S.-H. & Kim, S.-G. Neural interpretation of blood oxygenation level-dependent fMRI maps at
submillimeter columnar resolution. The Journal of neuroscience: the official journal of the Society for Neuroscience 27, 6892–6902.
58. Fang, X. et al. Disrupted effective connectivity of the sensorimotor network in amyotrophic lateral sclerosis. Journal of neurology
263, 508–516 (2016).
59. McGregor, H. R. & Gribble, P. L. Functional connectivity between somatosensory and motor brain areas predicts individual
differences in motor learning by observing. Journal of neurophysiology 118, 1235–1243 (2017).
60. Zhou, F. Q. et al. Intrinsic functional plasticity of the sensory-motor network in patients with cervical spondylotic myelopathy.
Scientific reports 5, 9975 (2015).
61. Liu, P., Calhoun, V. & Chen, Z. Functional overestimation due to spatial smoothing of fMRI data. Journal of neuroscience methods
291, 1–12 (2017).
62. Chen, Z. & Calhoun, V. Effect of Spatial Smoothing on Task fMRI ICA and Functional Connectivity. Frontiers in neuroscience 12, 15 (2018).
63. Zuo, X.-N. et al. Toward reliable characterization of functional homogeneity in the human brain: preprocessing, scan duration,
imaging resolution and computational space. NeuroImage 65, 374–386.
64. Yeo, B. T. T. et al. The organization of the human cerebral cortex estimated by intrinsic functional connectivity. Journal of
neurophysiology 106, 1125–1165.
65. Seibert, T. M. & Brewer, J. B. Default network correlations analyzed on native surfaces. Journal of neuroscience methods 198, 301–311.
66. Sladky, R. et al. Unsmoothed functional MRI of the human amygdala and bed nucleus of the stria terminalis during processing of
emotional faces. NeuroImage 168, 383–391 (2018).
67. Gazzola, V. & Keysers, C. The observation and execution of actions share motor and somatosensory voxels in all tested subjects:
single-subject analyses of unsmoothed fMRI data. Cerebral cortex (New York, N.Y.: 1991) 19, 1239–1255 (2009).
68. Morgan, V. L., Dawant, B. M., Li, Y. & Pickens, D. R. Comparison of fMRI statistical software packages and strategies for analysis of
images containing random and stimulus-correlated motion.
69. Calhoun, V. D. et al. The impact of T1 versus EPI spatial normalization templates for fMRI data analyses.
70. Gordon, E. M. et al. Generation and Evaluation of a Cortical Area Parcellation from Resting-State Correlations. Cerebral cortex 26,
288–303 (New York, N.Y.: 1991).
71. Glasser, M. F. et al. A multi-modal parcellation of human cerebral cortex. Nature 536, 171–178 (2016).
72. Turner, R. & Geyer, S. Comparing like with like: the power of knowing where you are. Brain connectivity 4, 547–557.
73. Robinson, E. C. et al. Multimodal surface matching with higher-order smoothness constraints. NeuroImage 167, 453–465 (2018).
74. Glasser, M. F. et al. Using temporal ICA to selectively remove global noise while preserving global signal in functional MRI data.
undefined.
75. Eklund, A., Nichols, T. E. & Knutsson, H. Cluster failure: Why fMRI inferences for spatial extent have inflated false-positive rates.
Proceedings of the National Academy of Sciences of the United States of America 113, 7900–7905 (2016).
76. Bansal, R. & Peterson, B. S. Cluster-level statistical inference in fMRI datasets: The unexpected behavior of random fields in high
dimensions. Magnetic resonance imaging 49, 101–115 (2018).
77. Hayasaka, S. & Nichols, T. E. Validating cluster size inference: random field and permutation methods. NeuroImage 20, 2343–2356.
Acknowledgements
The authors received support from: DFG for 1738 B2; BMBF Bernstein Fokus (FKZ 01GQ0923); BMBF
Gerontosys JenAge (FKZ 031 5581B); EU BrainAge (FP 7/HEALTH.2011.2.22-2 GA No. 2798219); and BMBF
Irestra (FKZ 16SV7209).
Author contributions
S.B. and C.K. performed the measurements, S.B., R.D. and C.G. performed the analysis, S.B., C.K. and O.W. wrote
the manuscript, R.D. and C.G. developed the theoretical background.
Competing interests
The authors declare no competing interests.
Additional information
Supplementary information is available for this paper at https://doi.org/10.1038/s41598-020-62832-z.
Correspondence and requests for materials should be addressed to S.B.
Reprints and permissions information is available at www.nature.com/reprints.
Publisher’s note Springer Nature remains neutral with regard to jurisdictional claims in published maps and
institutional affiliations.
Open Access This article is licensed under a Creative Commons Attribution 4.0 International
License, which permits use, sharing, adaptation, distribution and reproduction in any medium or
format, as long as you give appropriate credit to the original author(s) and the source, provide a link to the Cre-
ative Commons license, and indicate if changes were made. The images or other third party material in this
article are included in the article’s Creative Commons license, unless indicated otherwise in a credit line to the
material. If material is not included in the article’s Creative Commons license and your intended use is not per-
mitted by statutory regulation or exceeds the permitted use, you will need to obtain permission directly from the
copyright holder. To view a copy of this license, visit http://creativecommons.org/licenses/by/4.0/.
© The Author(s) 2020
Scientific Reports | (2020) 10:5737 | https://doi.org/10.1038/s41598-020-62832-z 13You can also read