Automated detection of critical findings in multi parametric brain MRI using a system of 3D neural networks - Nature
←
→
Page content transcription
If your browser does not render page correctly, please read the page content below
www.nature.com/scientificreports
OPEN Automated detection of critical
findings in multi‑parametric brain
MRI using a system of 3D neural
networks
Kambiz Nael1,2*, Eli Gibson3, Chen Yang2, Pascal Ceccaldi3, Youngjin Yoo3,
Jyotipriya Das3, Amish Doshi2, Bogdan Georgescu3, Nirmal Janardhanan3,
Benjamin Odry4, Mariappan Nadar3, Michael Bush5, Thomas J. Re3, Stefan Huwer6,
Sonal Josan7, Heinrich von Busch7, Heiko Meyer6, David Mendelson2, Burton P. Drayer2,
Dorin Comaniciu3 & Zahi A. Fayad2
With the rapid growth and increasing use of brain MRI, there is an interest in automated image
classification to aid human interpretation and improve workflow. We aimed to train a deep
convolutional neural network and assess its performance in identifying abnormal brain MRIs and
critical intracranial findings including acute infarction, acute hemorrhage and mass effect. A total of
13,215 clinical brain MRI studies were categorized to training (74%), validation (9%), internal testing
(8%) and external testing (8%) datasets. Up to eight contrasts were included from each brain MRI
and each image volume was reformatted to common resolution to accommodate for differences
between scanners. Following reviewing the radiology reports, three neuroradiologists assigned
each study to abnormal vs normal, and identified three critical findings including acute infarction,
acute hemorrhage, and mass effect. A deep convolutional neural network was constructed by a
combination of localization feature extraction (LFE) modules and global classifiers to identify the
presence of 4 variables in brain MRIs including abnormal, acute infarction, acute hemorrhage and
mass effect. Training, validation and testing sets were randomly defined on a patient basis. Training
was performed on 9845 studies using balanced sampling to address class imbalance. Receiver
operating characteristic (ROC) analysis was performed. The ROC analysis of our models for 1050
studies within our internal test data showed AUC/sensitivity/specificity of 0.91/83%/86% for normal
versus abnormal brain MRI, 0.95/92%/88% for acute infarction, 0.90/89%/81% for acute hemorrhage,
and 0.93/93%/85% for mass effect. For 1072 studies within our external test data, it showed AUC/
sensitivity/specificity of 0.88/80%/80% for normal versus abnormal brain MRI, 0.97/90%/97% for acute
infarction, 0.83/72%/88% for acute hemorrhage, and 0.87/79%/81% for mass effect. Our proposed
deep convolutional network can accurately identify abnormal and critical intracranial findings on
individual brain MRIs, while addressing the fact that some MR contrasts might not be available in
individual studies.
Brain MRI has been established as a powerful and safe diagnostic modality for the majority of neurological
disorders by providing detailed evaluation of brain tissue owing to its high soft-tissue contrast. In fact, the
Appropriateness Criteria of the American College of Radiology list MR imaging as the desired imaging modal-
ity for most neurologic symptoms, including headache, focal neurologic deficits, altered mental status, ataxia,
seizure, and vision loss1.
1
Department of Radiological Sciences, David Geffen School of Medicine at University of California Los Angeles,
757 Westwood Plaza, Suite 1621, Los Angeles, CA 90095‑7532, USA. 2Department of Diagnostic, Molecular
and Interventional Radiology, Icahn School of Medicine at Mount Sinai, New York, USA. 3Digital Technology
and Innovation, Siemens Healthineers, Princeton, USA. 4AI for Clinical Analytics, Covera Health, New York, NY,
USA. 5Magnetic Resonance, Siemens Healthineers, New York, USA. 6Magnetic Resonance, Siemens Healthineers,
Erlangen, Germany. 7Digital Health, Siemens Healthineers, Erlangen, Germany. *email: kambiznael@gmail.com
Scientific Reports | (2021) 11:6876 | https://doi.org/10.1038/s41598-021-86022-7 1
Vol.:(0123456789)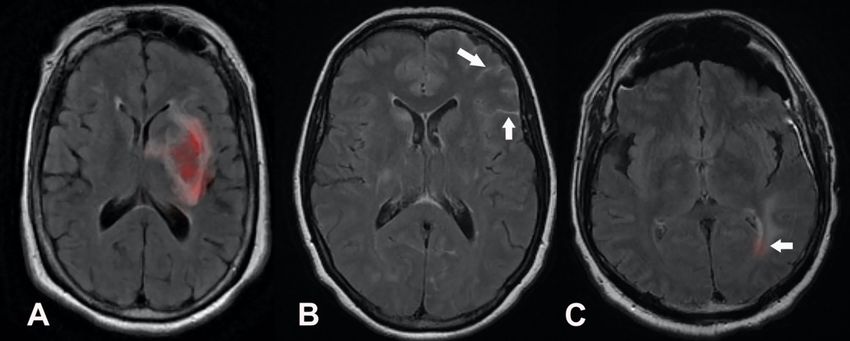
www.nature.com/scientificreports/
A conventional brain MRI study consists of several weightings and is often constructed with at least 5 contrasts
including T1-weighted (T1W), T2-weighted (T2W), fluid-attenuated inversion recovery (FLAIR), T2*-weighted
(T2*) by using a gradient-recall-echo based sequence, and diffusion-weighted imaging (DWI)2. Advances in
technology have increased our ability to scan faster, obtaining thousands of high resolution MR images in the
order of minutes. Therefore, healthcare providers who own even a few MRI scanners are required to provide
interpretation of hundreds of brain MRIs and tens or hundreds of thousands of images on a daily basis. Some of
the challenges associated with this increased workload are timely interpretation and triage of scans with acute
findings, radiologists’ burnout, and the subjectivity and variability related to the complex nature of modern day
large-volume high resolution MR i maging3.
One solution to address these challenges is the use of artificial intelligence for automated image classifica-
tion. It is plausible that an automated and accurate algorithm can provide rapid triage of brain MRIs for critical
intracranial findings such as stroke, hemorrhage and mass effect. For large organizations, such triage offers
improved radiologist workflow with the potential to reduce the time between acquisition and interpretation for
critical cases with presumably positive effects on patient outcome. If the potential of such algorithms is real-
ized, these systems can prioritize radiologic review of cases with critical findings, even if they were not initially
ordered for urgent interpretation.
While image interpretation and classification has been a target of computer-aided diagnosis and machine
learning techniques for quite some t ime4–9, algorithms have been limited by data set size constraints and reli-
ance on experts’ feature selection, resulting in limited ability to handle image diversity and complexity. In recent
years, increased access to large data and computational capabilities have enabled deep-learning (DL)-based
algorithms in the field of medical imaging that are capable of learning complex patterns from large image data
sets at multiple levels of abstraction, representation and information, without the need for predefined feature
extraction, and with promising performance and s peed10–14. Although progress has been made in automated
triage of non-contrast head CT15,16, applications for triaging multiple critical findings on brain MRI are sparse.
The contributions of this paper lie in applying DL concepts to automate the classification of patients’ brain
MRI studies. Specifically, we developed and measured the performance of the first DL-based prototype to both
differentiate between normal brain and abnormal brain MRI studies and identify critical intracranial findings
including acute infarction, acute hemorrhage and mass effect using brain MRI. The proposed methodology
uses a custom DCNN architecture that accommodates variable sets of image contrasts and combines localiza-
tion feature extraction (LFE) modules with a global classifier that handles images from multiple orientations.
Methods
Data. This study was compliant with the health insurance portability and accountability act (HIPAA). Mount
Sinai institutional review board approved this study for human research with waiver of informed consent. All
methods were performed in accordance with the relevant guidelines and regulations.
A total of 15,811 brain MRI studies were used in this study: an internal data set of 14,080 studies used for
training and internal testing, and an external data set of 1731 studies used for external testing. The internal data
set was accumulated from a combination of inpatient and outpatient scanners from our institution’s HIPAA
compliant imaging research warehouse, including data from 19 scanners produced by two manufacturers (GE
and Siemens Healthcare). The external data was accumulated from two external centers, including data from
scanners produced by three manufacturers (GE, Philips, and Siemens Healthcare). Studies were filtered based on
MR contrasts available, spatial characteristics and label ambiguity (inclusion/exclusion flowchart in Fig. 1; filter
details in Supplementary materials), yielding 12,143 internal studies that were randomly assigned to training
(74%), validation (9%) and internal testing (8%) sets using a single patient-wise split of data from all scanners
and 1072 external studies for further testing (8%).
Each of the studies was labeled based on a re-analysis of each radiology report by one of two board-certified
neuroradiologists (AD and KN with at least 10 years of experience each) for internal studies and by a third
radiologist (TR) for the external studies to denote the following:
a) presence of any intracranial abnormality (any intracranial findings even minor or of doubtful clinical sig-
nificance were considered as abnormal, i.e. any white matter signal change, developmental venous anomaly,
pineal cyst, …). Therefore, a normal brain MRI was considered as one with absolutely no parenchymal signal
change and no incidental findings.
b) acute infarction: any areas of infarction reported as having reduced diffusion were included. Chronic infarc-
tion description was excluded from this label class.
c) acute hemorrhage: subarachnoid, intraparenchymal or extra-axial hemorrhages were included. Any descrip-
tion of chronic hemorrhage was excluded from this label class.
d) mass effect: mass effect worthy of notification with any description of mid-line shift, effacement of basal or
suprasellar cisterns, or uncal herniation was included. Localized mass effect surrounding a mass without
causing midline shift or effacement of sulci was not included in this category.
To assess the interobserver variability in labeling the critical findings from radiology reports, a set of reports
from 200 patients were reviewed independently by both neuroradiologists.
The 3D boundaries of critical findings were delineated by a radiologist (TR). For acute infarction, reduced
diffusion was delineated on TraceW images, defined by its hyperintense signal. For acute hemorrhage, hemor-
rhage excluding surrounding edema was delineated on FLAIR images, using both hyperintensity on FLAIR and
hypointensity on T2* images to assess hemorrhage extent. For mass effect, the regions of tissue that were visibly
displaced were delineated on FLAIR images, excluding any mass causing the displacement.
Scientific Reports | (2021) 11:6876 | https://doi.org/10.1038/s41598-021-86022-7 2
Vol:.(1234567890)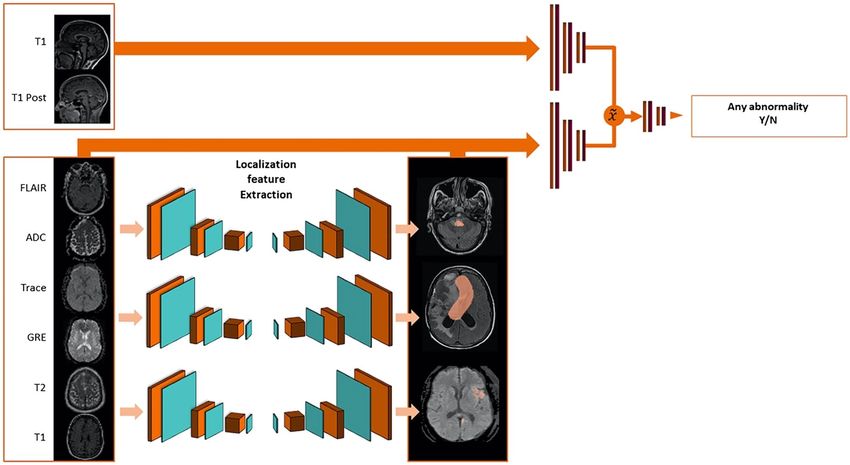
www.nature.com/scientificreports/
Figure 1. Study flowchart. Non-definitive labels denote reports where the neuroradiologists deemed that
classifying the study as positive or negative for one or more of the labels would be acceptable.
Contrast Any abnormality Hemorrhage Infarct Mass effect
Axial T2 FLAIR Required Required Required
Axial ADC Required Required Required
Axial Trace-weighted Required Required Required
Axial T2*-weighted Optional Optional
Axial T1-weighted Optional Optional Optional Optional
Sagittal T1-weighted Optional
Sagittal T1-weighted post-contrast Optional
Axial T2-weighted Optional Optional Optional Optional
Table 1. Contrasts used for each classification.
Image analysis. Images were preprocessed by resampling them to the coordinate grid of a reference con-
trast (axial ADC and sagittal T1w for abnormality, axial FLAIR for hemorrhage and mass effect models, and axial
ADC for the infarct model) based on scanner coordinates, and resizing them to a fixed dimension [256 × 256
in-plane and 32 out-of-plane]. Image intensities of each contrast were normalized using a linear transformation
of minimum and maximum values to 0–1).
Network architecture. The classification of each study is performed by 4 networks: one to detect the presence
of any abnormality and three to detect the three acute abnormalities. Each network was trained on a network-
specific set of images (detailed in Table 1). The overall architectures for the abnormality and critical finding
networks are shown in Figs. 2 and 3, respectively and summarized below. Architecture implementation details
and training hardware are detailed in the Supplementary materials.
The network comprises three components: (1) localization feature extraction (LFE) modules that create a
pixel-wise map of the findings on the axially oriented volumes; (2) orientation-specific feature-combination
layers and (3) a global classifier that generates a study-wise score for the presence of the finding.
The localization feature extraction modules are deep image-to-image networks17 comprised of a series of
convolution and pooling layers generating successively lower resolution feature maps, followed by a series of
convolution and up-sampling layers successively restoring the original resolution, with skip connections con-
necting the two sections to transmit higher resolution information.
The orientation-specific feature combination layer is designed to make our algorithm compatible with differ-
ent clinical protocols that may vary between sites. For the detection of any abnormality, for example, only FLAIR,
ADC and TraceW are required contrasts, while the others are considered as optional. The orientation-specific
feature combination layer uses a separate in-plane convolution for each contrast present, and then averages
the resulting features within each orientation, excluding those from missing contrasts. This averaging makes
the network robust to distributional shifts caused by missing contrasts, and induces the features from different
contrasts to encode information in a common space.
Scientific Reports | (2021) 11:6876 | https://doi.org/10.1038/s41598-021-86022-7 3
Vol.:(0123456789)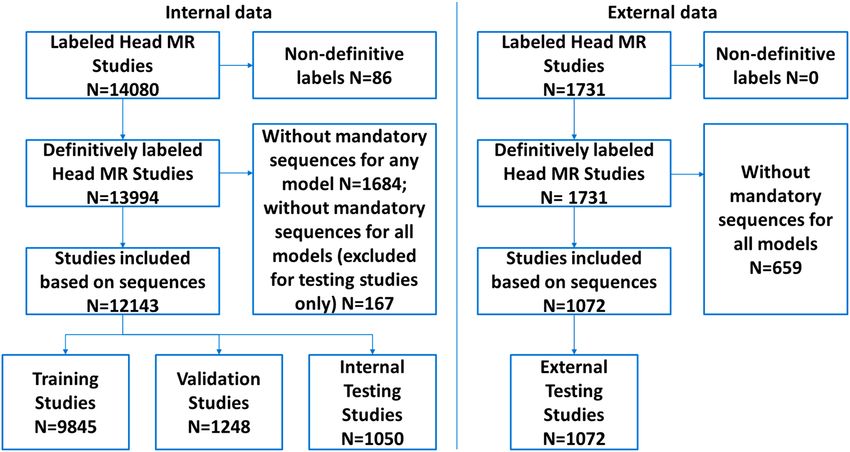
www.nature.com/scientificreports/
Figure 2. Abnormality network architecture.
Figure 3. Critical network architecture. The same architecture is used for acute hemorrhage, mass effect and
acute infarct, but is trained using different inputs. The network for infarct is shown above; the corresponding
network for mass effect used axial FLAIR, T1W and T2W contrasts, and the network for hemorrhage used
all axial contrasts. Note that for all three critical findings, the input contrast selection (see ‘training’ section)
resulted in sagittal images not being used, simplifying the architecture compared to Fig. 2.
Then, the classifier uses a series of in-plane strided convolutions for each orientation to yield isotropic outputs.
In the abnormality network, which uses both sagittal and axial images (see Table 1), the orientation-specific
outputs are averaged when sagittal images are present. The resulting outputs are inputted into a final series of
convolution and pooling layers. This is followed by a global pooling layer with softmax to score a finding from
0 to 1 as present or absent. The operating point of this classifier can be tuned to prioritize fewer false positives
or fewer false negatives; for the analysis reported in this paper, the operating point was tuned on the validation
set to minimize the sum of sensitivity and specificity.
Training. The networks were trained in two stages. First, the LFE networks were trained in isolation; then,
the full network was trained end-to-end to generate a study-wise prediction. The LFE networks were trained
minimizing the pixel-wise cross-entropy loss compared to manual annotations of the critical findings. The clas-
sifier networks were trained minimizing the cross-entropy loss compared to the study-wise manual label. Both
types of networks were trained with an Adam-type o ptimizer18 for up to 500 epochs with early stopping based
on the loss on the validation set, actually stopping after 7–42 epochs. The training algorithm used balanced posi-
tive/negative data sampling to mitigate class imbalance, and the data was augmented using randomized spatial
Scientific Reports | (2021) 11:6876 | https://doi.org/10.1038/s41598-021-86022-7 4
Vol:.(1234567890)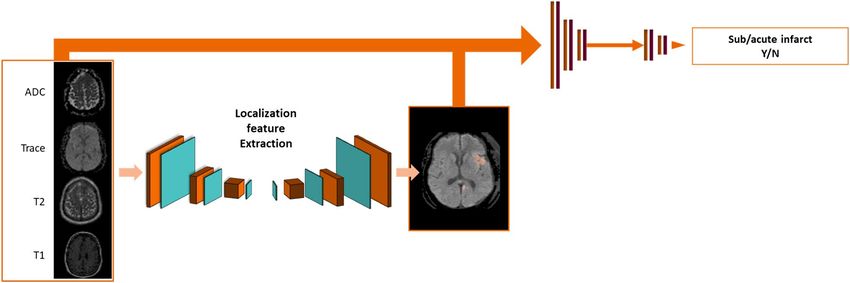
www.nature.com/scientificreports/
transformations (translation and left–right flipping) and intensity transformations (additive uniform noise19) to
mitigate overfitting. Dropout was used in each convolution layer to mitigate overfitting.
The network architecture, hyperparameters and input contrasts were iteratively optimized based on the ROC-
AUC on the validation set using the single original split. The validation set was also used to set the operating
point for the classifiers as the threshold that maximizes the sum of sensitivity and specificity.
Network interpretability. To give insight into the network’s predictions, heat maps are generated for each con-
trast to indicate the importance of the input pixel. For the critical finding models, the localization feature extrac-
tion module generates this directly. For the abnormality model, the importance is computed in latent feature
space by taking a gradient of the network’s output signal, and then this is scaled to each input contrast dimension
to provide the pixel-wise importance in input space20. Examples of network output are shown in Fig. 4.
Statistical analysis. Identification on brain MRI of any abnormality, acute hemorrhage, acute infarction
and mass effect on a per-study basis were considered as primary end points of this study. A given MRI study was
considered positive for a finding if the classification score exceeded the corresponding operating point. Receiver
operative characteristic analysis was performed to calculate the network performance including the area under
the curve, sensitivity, specificity, negative and positive predictive value and diagnostic accuracy in both inter-
nal and external test groups. Interobserver agreement for labeling the critical findings was measured by using
Cohen’s kappa score.
Result
From a total of 14,080 brain MRI studies, 12,143 met our inclusion criteria (Fig. 1). Among these studies, 10,140
(84%) were abnormal, 1219 (10%) had acute infarction, 533 (4.4%) had acute hemorrhage and 550 (4.5%) had
intracranial mass effect. There were 404 studies with multiple findings (59 with mass effect and infarct, 195 with
hemorrhage and infarct, 88 with hemorrhage and mass effect, and 62 with all three); as the findings were classi-
fied independently, these cases were treated as positive for each of the respective findings.
Interobserver agreement for labeling critical findings was excellent for acute infarct (k = 0.93); excellent for
acute hemorrhage (k = 0.84); and very good for mass effect (k = 0.77).
Among the internal testing group (1050 brain MRIs), 879 (84%) were abnormal, 118 (11%) had acute infarc-
tion, 65 (6.2%) had acute hemorrhage, and 56 (5.3%) had intracranial mass effect. Among the external testing
group (1072 brain MRIs), 867 (81%) were abnormal, 287 (27%) had acute infarction, 78 (7.3%) had acute hemor-
rhage and 31 (2.9%) had intracranial mass effect.
The diagnostic performance of our deep neural network for the internal and external test sets are summarized
in Tables 2 and 3, respectively.
The full spectrum and amplitude of acute findings were not available through the radiology reports for
consistent labeling and testing via our classifiers. However, for the size of infarction, we were able to perform a
sub-analysis between the impact of infarct volume (obtained from manual contours in the testing group) and
the performance of our model. This analysis did show a downward trend in diagnostic performance with the
smaller size of infarction with calculated sensitivity of 84% for infarction volume < 1 mL, 79% for infarction
volume < 0.5 mL, and 72% for infarction volume < 0.25 mL.
Figure 5 shows examples of true positive, false negative and false positive in acute hemorrhage detection by
our network.
To assess the contributions of the optional contrasts, we additionally measured the performance of the mod-
els when given only the mandatory sequences. The change in performance of these models are summarized in
Table 4. Overall, with only the mandatory contrasts (chosen for their clinical value) the models achieved per-
formance close to that with all available contrast, with the difference much less pronounced for the external data
set. Most notably, the inclusion of T1w, T2w and T2* made the hemorrhage model substantially more specific,
though less sensitive.
Discussion
Our results showed that the proposed automated DCNN-based tool can identify normal versus abnormal brain
MRIs and flag critical findings including acute infarction, hemorrhage and mass effect with acceptable diagnostic
accuracy on routine brain MRI scans from multivendor imaging systems.
In this work, we designed a DCNN architecture that integrates global classification of pathology with auto-
matic localization feature extraction in the form of pixel-level maps denoting the locations of critical findings.
This architecture enables the training process to inject additional complex clinical understanding of the MR
images through deep supervision with clinical contours. Through a later combination of these maps with the
original images, they also act as an attention mechanism on the relevant image information that determines the
final decision that is not only used by the classification, but also can be visualized to understand the workings
of the network.
Although DL methods have been used to identify multiple critical intracranial findings on C T21,22, avail-
able solutions to triage multiple acute intracranial findings on brain MRIs have been relatively limited to a few
applications23,24. Below we discuss our specific results as they relate to acute infarction, acute hemorrhage, and
mass effect.
Timely diagnosis of acute stroke is crucial, since reducing the time to treatment by 15 min has resulted in
significant improvement in final outcome in patients with acute stroke25. It is therefore critical for institutions to
rapidly and accurately interpret neuroimaging data in the presence of acute ischemic stroke. While MRI (DWI)
is the most accurate imaging modality for detection of acute infarction26, CT has been the major workhorse for
Scientific Reports | (2021) 11:6876 | https://doi.org/10.1038/s41598-021-86022-7 5
Vol.:(0123456789)www.nature.com/scientificreports/
Figure 4. Network interpretability. For the abnormality classification, a heat map can be generated
retrospectively denoting regions that strongly influenced the decision: (A). For critical findings, the network
directly generates heat maps of denoting the region identified by the AI: acute infarction on a trace-weighted
contrast (B), subdural hemorrhage on a FLAIR contrast (C) and mass effect on a FLAIR contrast (D).
acute stroke imaging due to its broad availability. Therefore, there has been a paucity of data on prior work for
automated detection of acute stroke on MRI using DL techniques. Though not intended for detection of acute
infarction, Chen et al.27 used a framework with two CNNs to segment stroke lesions in known stroke patients
using DWI with a reported mean Dice coefficient of 0.67.
Scientific Reports | (2021) 11:6876 | https://doi.org/10.1038/s41598-021-86022-7 6
Vol:.(1234567890)www.nature.com/scientificreports/
Detection type AUC Sensitivity (%) Specificity (%) ACC (%) PPV (%)* NPV (%)*
Abnormality 0.91 83 86 84 97 50
Acute hemorrhage 0.90 89 81 81 24 99
Acute infarct 0.95 92 88 88 49 99
Mass effect 0.93 93 85 85 26 100
Table 2. Performances of the classifiers on the internal test set. *Note that positive predictive value (PPV) and
negative predictive value (NPV) are highly dependent on the prevalence of the finding in a given population.
Detection type AUC Sensitivity (%) Specificity (%) ACC (%) PPV (%)* NPV (%)*
Abnormality 0.88 80 80 80 94 48
Acute hemorrhage 0.83 72 88 87 32 98
Acute infarct 0.97 90 97 95 92 96
Mass effect 0.87 79 81 81 12 99
Table 3. Performances of the classifiers on the external test set. *Note that positive predictive value (PPV) and
negative predictive value (NPV) are highly dependent on the prevalence of the finding in a given population.
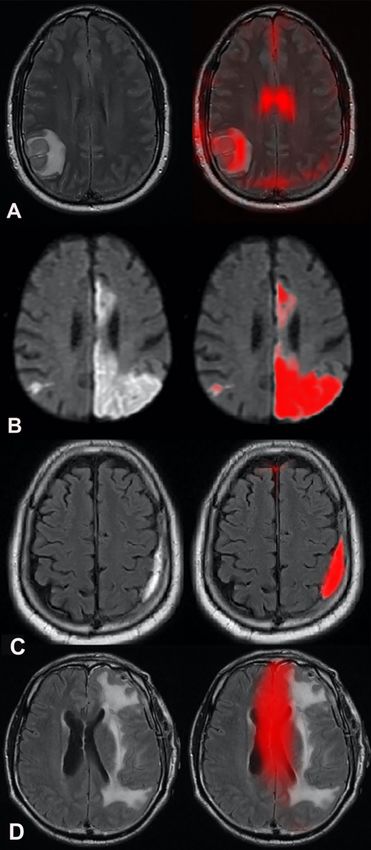
Figure 5. Examples of heat maps provided by the network for detection of acute intracranial hemorrhage. (A)
Heatmap on axial FLAIR shows correct identification of intraparenchymal hemorrhage (true positive). (B)
Subarachnoid hemorrhage seen as sulcal hyperintense signal on axial FLAIR image (arrows) was not detected by
the network (false negative). (C) Heatmap on axial FLAIR points to periventricular leukomalacia (arrow) (false
positive).
Data set Detection type Δ AUC Δ Sensitivity (%) Δ Specificity (%)
Abnormality 0.01 2 1
Acute hemorrhage 0.01 −2 6
Internal
Acute infarct 0.00 0 0
Mass effect 0.01 3 1
Abnormality 0.00 0 0
Acute hemorrhage 0.01 −2 3
External
Acute infarct 0.00 0 0
Mass effect 0.01 2 −2
Table 4. Contribution of optional contrasts to classifier performance. Positive values denote that the model
performance was higher with all available contrasts than with only mandatory contrasts.
Scientific Reports | (2021) 11:6876 | https://doi.org/10.1038/s41598-021-86022-7 7
Vol.:(0123456789)www.nature.com/scientificreports/
Intracranial hemorrhage (ICH) is another critical medical event with reported mortality of up to 40%28 which
can occur both within the brain parenchyma (intra-axial) or external to the brain parenchyma (extra-axial
including epidural, subdural and subarachnoid). Although automated detection of ICH has been investigated
with deep learning algorithms on CT with promising r esults15,16, automated detection of ICH on MRI has been
limited to small series for detection of parenchymal m icrobleeds29. To our knowledge, no prior studies looked
at automated detection of all categories of acute ICH on MRI via deep learning. Our DL algorithm was able to
detect acute ICH successfully with an AUC of 0.90 comparable to reported results of DL algorithms applied on
CT with AUCs of 0.9121 and 0.9422.
Intracranial mass effect is also a serious condition that can cause brain shift, followed by herniation, brainstem
compression, and death. In the NIH Traumatic Coma Data Bank, midline shift and compression or obliteration
of the perimesencephalic cisterns were among the most important imaging characteristics associated with poor
outcome and death30. Early recognition can prompt therapeutic interventions and improve outcome. Recently,
DL methods have been applied for detection of intracranial mass effects on head CT with reported AUCs in the
range of 0.86–0.9121,22. Our DL approach was able to identify intracranial mass effect with an AUC of 0.93 and
is the first of its kind for detection of mass effect using MRI.
In testing our single-center model on external data from multiple centers, we observed a shift in perfor-
mance but no consistent trend across the models. For mass effect, the sensitivity and specificity each decreased
by ~ 10%, while for acute infarct, the specificity increased by the same margin with little change in sensitivity.
For acute hemorrhage, there was a shift in operating point to lower sensitivity and higher specificity. This sug-
gests two strategies might be applied for developing such systems: training multi-center models for more stable
multi-center generalization, or training single-center models optimized for the characteristics of a given center.
Accurate and timely diagnosis of critical intracranial findings such as stroke, ICH and mass effect is crucial
for proper management. Increased use of neuroimaging in large clinical practices and interruptions from nonin-
terpretive tasks common in academia can result in delayed diagnosis of these critical findings. The turn-around
time for simple non-contrast head CT has been reported in the range of 1.5–4 h in the emergency d epartments31.
The turn-around time for outpatient non-urgent studies have been set and accepted within 24 h across many
institutions such as ours due to shortage of human resources. These delays however can impact patients’ care
and negatively impact the patient’s outcome.
An automated screening tool such as our DL algorithm may therefore have the potential for efficient and
accurate diagnosis of acute intracranial findings to facilitate a prompt therapeutic response. The most salient
use case of our algorithm is a screening system that can alert physicians about MRI examinations with positive
critical findings for expedited interpretation and reduced turn-around time, which has been rated as one of the
highest priorities in a recent survey of > 80 imaging i nstitutions32.
Several variables can determine the urgency of any given study in radiology workflow. Some of these are (1)
location of ordering physician (Emergency department, inpatient, outpatient clinic); (2) priority level assigned by
ordering physicians (high priority, routine); and (3) information obtained based on patients symptoms (stroke,
trauma, intracranial hemorrhage). Although this style of prioritization serves as a guide to determine the urgency
and order by which the studies can be interpreted, AI algorithm such as ours can provide a different insight and
reprioritize the list based on actual findings contained in the images for more realistic and less assuming model.
For example, a patient with headache and confusion may be assigned a routine brain MRI with potential waiting
time-to-interpretation of several hours. However, if this patient has a stroke, using our classifier this study will
be prioritized despite having a routine order and will be read at the top of the worklist by next available radiolo-
gist. Although this process was not tested systematically in our work (due to retrospective design), our results
support the potential of such an algorithm/model.
Another potential use case for our classifiers is for institutions with multiple imaging centers such as ours
that function across a large urban area and well beyond routine working hours. We envision that in such practice
setting, the classifiers described in our work can be in place to screen and flag MRI scans with critical intracranial
findings as they are being obtained so a notification can be sent to a central reading rooms that function 24/7
for timely interpretation of these studies rather than waiting until the next morning for day-time radiologist.
Depending on the prevalence of acute findings and clinical preference in a given practice, the operating point
of the system can be tuned, without retraining, to optimize for different clinical priorities, such as prioritizing
sensitivity to catch all serious findings. The potential benefits of this system are to improve work-flow during
working hours to tailor available human expertise in interpreting abnormal cases in a timely manner, and identify
patients with critical intracranial findings during off hours to notify emergency and on-call personnel, so no
urgent MRI studies will go untriaged.
One of the advantages of the model described in this work is that the combination of FLAIR and diffusion
imaging is an integral part of all of our modules. This supports the broadly accepted concept of having diffusion
MRI as the most accurate diagnostic modality for acute infarction26 and FLAIR as the most versatile contrast
for detection of the majority of all intracranial pathologies33. Having a system that can classify MR images with
only these contrasts or with additional ones provides much needed flexibility for extending our model to data
sets generated at most neuroimaging institutions, as these contrasts are almost universally included in all brain
MRI studies.
Our study has several limitations. First, its retrospective nature introduces unknown bias. Second, despite
our promising results that was tested both internally and on an external test group, a larger validation study is
required. Finally, the study was limited to analyzing the performance of the system in isolation. While fully-
automatic image-based classification has the potential to improve patient outcomes and radiology workflow
through improving the triage of acute findings and treatment, it is the authors’ collective opinion that such an
algorithm can ultimately be developed to provide decision support combining imaging data, clinical data and
interactive input from physicians and radiologists.
Scientific Reports | (2021) 11:6876 | https://doi.org/10.1038/s41598-021-86022-7 8
Vol:.(1234567890)www.nature.com/scientificreports/
Conclusion
Our proposed deep learning 3D neural network can accurately identify critical findings on individual brain MRIs
from a flexible selection of MR contrasts. If its potential is realized it can be used to flag abnormal brain MRIs,
improving triage and timely interpretation of abnormal scans in a busy clinical practice.
Data availability
The datasets used in this study are not publicly available because the IRB of the study limits access to the data.
Derived and supporting data are available from the corresponding author upon reasonable request. We are
willing to validate other people’s models as part of collaborations. The code used for training the models has a
large number of dependencies on internal tooling, infrastructure and hardware, and its release is therefore not
feasible. However, an independent library to construct the network architectures and to load data as used in this
study have been made available to support replication with non-proprietary libraries.
Received: 18 October 2020; Accepted: 8 March 2021
References
1. Subramaniam, R. M., Kurth, D. A., Waldrip, C. A. & Rybicki, F. J. American college of radiology appropriateness criteria: advancing
evidence-based imaging practice. Semin. Nucl. Med. 49, 161–165 (2019).
2. Edelstein, W. A., Mahesh, M. & Carrino, J. A. MRI: time is dose–and money and versatility. J. Am. Coll. Radiol. 7, 650–652 (2010).
3. Mayo, R. C. & Leung, J. Artificial intelligence and deep learning—Radiology’s next frontier?. Clin. Imaging 49, 87–88 (2018).
4. Chaplot, S., Patnaik, L. M. & Jagannathan, N. R. Classification of magnetic resonance brain images using wavelets as input to
support vector machine and neural network. Biomed. Signal Process. Control 1, 86–92 (2006).
5. El-Dahshan, E.-S.A., Hosny, T. & Salem, A.-B.M. Hybrid intelligent techniques for MRI brain images classification. Digit. Signal
Process. 20, 433–441 (2010).
6. Zhang, Y. & Wu, L. An MR brain images classifier via principal component analysis and kernel support vector machine. Prog.
Electromagn. Res. 130, 369–388 (2012).
7. Das, S., Chowdhury, M. & Kundu, M. K. Brain MR image classification using multiscale geometric analysis of ripplet. Prog. Elec-
tromagn. Res. 137, 1–17 (2013).
8. Raghava, G. P. S., Siddiqui, M. F., Reza, A. W. & Kanesan, J. An automated and intelligent medical decision support system for
brain MRI scans classification. PLoS ONE 10, e0135875 (2015).
9. Natteshan, N. V. S. & Angel Arul Jothi, J. Automatic classification of brain MRI images using SVM and neural network classifiers.
In Advances in Intelligent Informatics (eds El-Alfy, E. S. M. et al.) 19–30 (Springer, Berlin, 2015).
10. Razzak, M. I., Naz, S. & Zaib, A. Deep learning for medical image processing: overview, challenges and the future. In Classification
in BioApps (eds Thanki, R. et al.) 323–350 (Springer, Cham, 2018).
11. Mohsen, H., El-Dahshan, E.-S.A., El-Horbaty, E.-S.M. & Salem, A.-B.M. Classification using deep learning neural networks for
brain tumors. Future Comput. Inform. J. 3, 68–71 (2018).
12. Ravi, D. et al. Deep learning for health informatics. IEEE J. Biomed. Health Inform. 21, 4–21 (2017).
13. Litjens, G. et al. A survey on deep learning in medical image analysis. Med. Image Anal. 42, 60–88 (2017).
14. Anuse, A. & Vyas, V. A novel training algorithm for convolutional neural network. Complex Intell. Syst. 2, 221–234 (2016).
15. Arbabshirani, M. R. et al. Advanced machine learning in action: identification of intracranial hemorrhage on computed tomography
scans of the head with clinical workflow integration. NPJ Digit. Med. 1, 1–7 (2018).
16. Chang, P. D. et al. Hybrid 3D/2D convolutional neural network for hemorrhage evaluation on head CT. Am. J. Neuroradiol. 39,
1609–1616 (2018).
17. Yang, D., et al. Automatic liver segmentation using an adversarial image-to-image network. In Medical Image Computing and
Computer Assisted Intervention—MICCAI 2017 507–515 (2017).
18. Kingma, D., & Ba, J. (2014) Adam: a method for stochastic optimization. In International Conference on Learning Representations.
19. Toth, D. et al. Training deep networks on domain randomized synthetic X-ray data for cardiac interventions. Proc. Mach. Learn.
Res. 102, 468–482 (2019).
20. Zhao, G., Zhou, B., Wang, K., Jiang, R., & Xu, M. Respond-CAM: analyzing deep models for 3D imaging data by visualizations.
In Medical Image Computing and Computer Assisted Intervention—MICCAI 2018 485–492 (2018).
21. Prevedello, L. M. et al. Automated critical test findings identification and online notification system using artificial intelligence in
imaging. Radiology 285, 923–931 (2017).
22. Chilamkurthy, S. et al. Deep learning algorithms for detection of critical findings in head CT scans: a retrospective study. Lancet
392, 2388–2396 (2018).
23. Talo, M., Yildirim, O., Baloglu, U. B., Aydin, G. & Acharya, U. R. Convolutional neural networks for multi-class brain disease
detection using MRI images. Comput. Med. Imaging Graph. 78, 101673 (2019).
24. Talo, M., Baloglu, U. B., Yıldırım, Ö. & Rajendra Acharya, U. Application of deep transfer learning for automated brain abnormality
classification using MR images. Cognit. Syst. Res. 54, 176–188 (2019).
25. Saver, J. L. et al. Time to treatment with intravenous tissue plasminogen activator and outcome from acute ischemic stroke. JAMA
309, 2480–2488 (2013).
26. Hjort, N. et al. Ischemic injury detected by diffusion imaging 11 minutes after stroke. Ann. Neurol. 58, 462–465 (2005).
27. Chen, L., Bentley, P. & Rueckert, D. Fully automatic acute ischemic lesion segmentation in DWI using convolutional neural net-
works. Neuroimage Clin. 15, 633–643 (2017).
28. van Asch, C. J. et al. Incidence, case fatality, and functional outcome of intracerebral haemorrhage over time, according to age,
sex, and ethnic origin: a systematic review and meta-analysis. Lancet Neurol. 9, 167–176 (2010).
29. van den Heuvel, T. L. A. et al. Automated detection of cerebral microbleeds in patients with traumatic brain injury. NeuroImage
Clin. 12, 241–251 (2016).
30. Eisenberg, H. M. et al. Initial CT findings in 753 patients with severe head injury. A report from the NIH Traumatic Coma Data
Bank. J. Neurosurg. 73, 688–698 (1990).
31. Davis, S. M. et al. Hematoma growth is a determinant of mortality and poor outcome after intracerebral hemorrhage. Neurology
66, 1175–1181 (2006).
32. Nataraj, S. 2013 Imaging Turnaround Times Survey Results (2013)
33. Saleh, A. et al. Exclusion of brain lesions: is MR contrast medium required after a negative fluid-attenuated inversion recovery
sequence?. Br. J. Radiol. 77, 183–188 (2004).
Scientific Reports | (2021) 11:6876 | https://doi.org/10.1038/s41598-021-86022-7 9
Vol.:(0123456789)www.nature.com/scientificreports/
Acknowledgements
This work was supported, in part, by Siemens Medical Solutions USA, Inc. Patients’ imaging data was provided
via Mount Sinai BMEII Imaging Research Warehouse partially supported by NIH/NCRR CTSA UL1TR001433.
Author contributions
K.N.: Study design, literature search, data interpretation and analysis, clinical input, writing manuscript; E.G.:
Data curation/analysis components, study design, AI model development, writing manuscript; C.Y.: Data col-
lection, revising manuscript; P.C.: Data analysis, AI model development, writing manuscript; Y.Y. Data inter-
pretation, revising manuscript, AI model development, revising manuscript; J.D.: Data curation, data analysis,
revising manuscript; A.D.: Clinical input, data curation, revising manuscript; B.G.: Study conception, AI model
development, revising manuscript; N.J.: Study conception, study design, AI model development, revising manu-
script; B.O.: Study design, study conception, data curation, AI model development, revising manuscript; M.N.:
Directed R&D of data curation/analysis components, AI model development, revising manuscript; M.B.: Data
curation, revising manuscript; T.R.: Data analysis, data interpretation, image segmentation, revising manuscript;
S.H.: Data analysis, data interpretation, revising manuscript; S.J.: Data analysis, data interpretation, revising
manuscript; H.v.B.: Data analysis, data interpretation, revising manuscript; H.M.: Study design, securing fund-
ing, revising manuscript; D.M.: Study design, data collection, revising manuscript; B.P.D.: Study design, clinical
input, revising manuscript; D.C.: Study conception, study design, securing funding, literature search, revising
manuscript; Z.F.: Study design, secure funding, revising and writing manuscript; All authors read and approved
the final manuscript.
Competing interests
KN Consultant to Olea Medical (outside of the manuscript work); EG Employed by Siemens Medical Solutions
USA, Inc (Siemens Healthineers AG); Siemens Healthineers AG stocks; CY None; PC Employed by Siemens
Medical Solutions USA, Inc (Siemens Healthineers AG); Siemens Healthineers AG stocks; YY Employed by
Siemens Medical Solutions USA, Inc (Siemens Healthineers AG); Previously employed by University of British
Columbia (within 3 years); Received scholarship from Multiple Sclerosis Society of Canada.; JD Employed by
Siemens Medical Solutions USA, Inc (Siemens Healthineers AG); AD None; BG Employed by Siemens Medical
Solutions USA, Inc (Siemens Healthineers AG); NJ Employed by Siemens Medical Solutions USA, Inc (Siemens
Healthineers AG); Spouse works as data engineer for Abbott Labs.; BO Previously employed by Siemens Medi-
cal Solutions USA, Inc (Siemens Healthineers AG) (within 3 years); Siemens Stock; MN Employed by Siemens
Medical Solutions USA, Inc (Siemens Healthineers AG); Siemens AG stocks; MB Employed by Siemens Medi-
cal Solutions USA, Inc (Siemens Healthineers AG); TR Paid consultant to Siemens Medical Solutions USA, Inc
(Siemens Healthineers AG); SH Employed by Siemens Healthcare GmbH (Siemens Healthineers AG); Siemens
Healthineers AG stocks; SJ Employed by Siemens Healthcare GmbH (Siemens Healthineers AG); HvB Employed
by Siemens Healthcare GmbH (Siemens Healthineers AG); Siemens, Philips, and GE Stock; HM Employed by
Siemens Healthcare GmbH (Siemens Healthineers AG); Siemens Healthineers AG stocks; DM Equity in Nines,
Inc. and Maverick Medical AI, Ltd. (outside of the manuscript work); BPD None; DC Employed by Siemens
Medical Solutions USA, Inc (Siemens Healthineers AG); Multiple patents in AI, ML for Medical Imaging issued;
ZF Siemens (research grant); Trained Therapeutix Discovery (founder, board member).
Additional information
Supplementary Information The online version contains supplementary material available at https://doi.org/
10.1038/s41598-021-86022-7.
Correspondence and requests for materials should be addressed to K.N.
Reprints and permissions information is available at www.nature.com/reprints.
Publisher’s note Springer Nature remains neutral with regard to jurisdictional claims in published maps and
institutional affiliations.
Open Access This article is licensed under a Creative Commons Attribution 4.0 International
License, which permits use, sharing, adaptation, distribution and reproduction in any medium or
format, as long as you give appropriate credit to the original author(s) and the source, provide a link to the
Creative Commons licence, and indicate if changes were made. The images or other third party material in this
article are included in the article’s Creative Commons licence, unless indicated otherwise in a credit line to the
material. If material is not included in the article’s Creative Commons licence and your intended use is not
permitted by statutory regulation or exceeds the permitted use, you will need to obtain permission directly from
the copyright holder. To view a copy of this licence, visit http://creativecommons.org/licenses/by/4.0/.
© The Author(s) 2021
Scientific Reports | (2021) 11:6876 | https://doi.org/10.1038/s41598-021-86022-7 10
Vol:.(1234567890)You can also read