GazeBase, a large-scale, multi-stimulus, longitudinal eye movement dataset
←
→
Page content transcription
If your browser does not render page correctly, please read the page content below
www.nature.com/scientificdata
OPEN GazeBase, a large-scale,
Data Descriptor multi-stimulus, longitudinal
eye movement dataset
Henry Griffith ✉, Dillon Lohr, Evgeny Abdulin & Oleg Komogortsev
This manuscript presents GazeBase, a large-scale longitudinal dataset containing 12,334 monocular
eye-movement recordings captured from 322 college-aged participants. Participants completed a
battery of seven tasks in two contiguous sessions during each round of recording, including a – (1)
fixation task, (2) horizontal saccade task, (3) random oblique saccade task, (4) reading task, (5/6)
free viewing of cinematic video task, and (7) gaze-driven gaming task. Nine rounds of recording were
conducted over a 37 month period, with participants in each subsequent round recruited exclusively
from prior rounds. All data was collected using an EyeLink 1000 eye tracker at a 1,000 Hz sampling rate,
with a calibration and validation protocol performed before each task to ensure data quality. Due to
its large number of participants and longitudinal nature, GazeBase is well suited for exploring research
hypotheses in eye movement biometrics, along with other applications applying machine learning to
eye movement signal analysis. Classification labels produced by the instrument’s real-time parser are
provided for a subset of GazeBase, along with pupil area.
Background & Summary
Due to their demonstrated uniqueness and persistence1, human eye movements are a desirable modality for
biometric applications2. Since their original consideration in the early 2000s3, eye movement biometrics have
received substantial attention within the security literature4. Recent interest in this domain is accelerating, due to
the proliferation of gaze tracking sensors throughout modern consumer products, including automotive inter-
faces, traditional computing platforms, and head-mounted devices for virtual and augmented reality applications.
Beyond this increase in sensor ubiquity, eye movements are an advantageous modality for emerging biometric
systems due to their ability to support continuous authentication5 and liveliness detection6, along with their ease
of fusion with other appearance-based traits in both the eye7 and periocular region8.
Despite considerable research progress in eye movement biometrics over the past two decades, several open
research areas remain. Namely, ensuring performance robustness with respect to data quality, and further inves-
tigating both task dependency and requisite recording duration is necessary to transition this technology to
widespread commercial adoption. Moreover, the exploration of emerging deep learning techniques, which have
proven successful for more traditional biometric modalities9, has been limited for eye movement biometrics. This
investigation is impeded by the challenges associated with the large-scale collection of eye movement data, along
with the lack of task-diverse, publicly-available, large-scale data repositories.
To promote further development in eye movement biometrics research, this manuscript describes a
newly-released dataset consisting of 12,334 monocular eye movement recordings captured from 322 individuals
while performing seven discrete tasks. The considered task battery includes guided stimuli intended to induce
specific eye movements of interest, along with multiple objective-oriented and free-viewing tasks, such as reading,
movie viewing, and game playing. Hereby denoted as GazeBase, this data were captured over a 37 month period
during nine rounds of recording, with two contiguous sessions completed during each recording period. The data
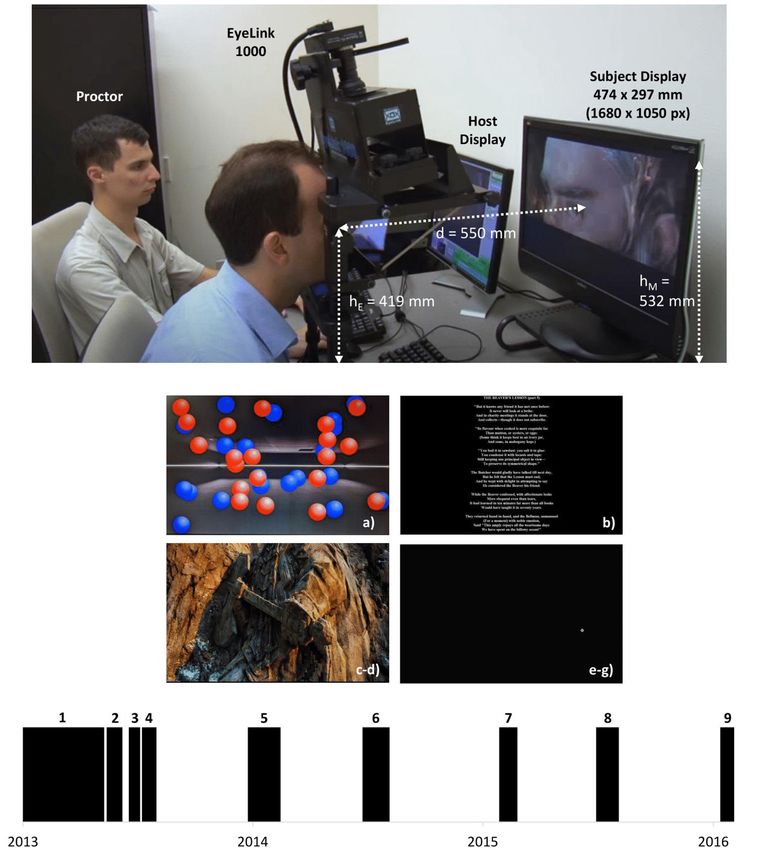
collection workflow is summarized in Fig. 1.
Although subsets of this data have been utilized in prior work10–21, this recent dissemination is the first release
of the entire set of gaze recordings and corresponding target locations for applicable stimuli. In addition, this
distribution includes uncalibrated pupil area measurements, along with eye movement classification labels pro-
duced by the instrument’s real-time parser for a relevant subset of the data. As the experimental parameters of
the data collection were chosen to maximize the utility of the resulting data for biometric applications, GazeBase
Texas State University, Department of Computer Science, San Marcos, TX, 78666, USA. ✉e-mail: h_169@txstate.edu
Scientific Data | (2021) 8:184 | https://doi.org/10.1038/s41597-021-00959-y 1www.nature.com/scientificdata/ www.nature.com/scientificdata
Fig. 1 Summary of the GazeBase dataset collection. Top: Experimental set-up. Middle: Screenshots of the
stimuli from four of the seven tasks. (a) is a screenshot of the gaze-driven gaming task, (b) is a screenshot of the
reading task, (c,d) is a single screenshot from one of the two video viewing tasks. (e–g) shows the stationary
bull’s-eye target utilized in the calibration and validation process, along with the fixation and two saccade
tasks. The screenshot is obtained during the random saccade task. Bottom: A timeline of the multiple recording
rounds (round identifiers are labeled on top of each rectangle). Informed consent was obtained from the
participants depicted within this figure prior to publication of the image.
is well suited for supporting further investigation of emerging machine learning biometric techniques to the eye
movement domain, such as metric learning22,23. Beyond this target application, the resulting dataset is also useful
for exploring numerous additional research hypotheses in various areas of interest, including eye movement clas-
sification and prediction. Applications employing machine learning techniques will benefit both from the scale of
available data, along with the diversity in tasks considered and participants recorded. Moreover, this dissemina-
tion will help improve quality in subsequent research by providing a diverse set of recordings for benchmarking
across the community2.
Methods
Participants. Participants were initially recruited from the undergraduate student population at Texas State
University through email and targeted in-class announcements. A total of 322 participants (151 self-identifying
as female, 171 self-identifying as male) were enrolled in the study and completed the Round 1 collection in its
entirety. Participants for Rounds 2–9 were recruited exclusively from the prior round’s participant pool. The
only exception to this protocol occurred in Round 4, where Participant ID 76 was recorded in spite of not being
Scientific Data | (2021) 8:184 | https://doi.org/10.1038/s41597-021-00959-y 2www.nature.com/scientificdata/ www.nature.com/scientificdata
Ethnicity: Asian Black Caucasian Hispanic Mixed
Num. of Participants: 10 32 178 76 27
Table 1. Self-reported ethnicity of participants.
Round ID Num. of participants Date Range
1 322 09/13–02/14
2 136 02/14–03/14
3 105 03/14–04/14
4 101 04/14–04/14
5 78 09/14–11/14
6 59 03/15–05/15
7 35 10/15–11/15
8 31 03/16–05/16
9 14 10/16–11/16
Table 2. Total number of participants and recording date range of each round.
60
50
Number of Participants (N=322)
40
30
20
10
0
20 25 30 35 40 45
Participant Age Upon Enrollment in Study (Years)
Fig. 2 Distribution of participants’ ages at the time of enrollment.
included in Round 3 recordings. All participants had normal or corrected to normal visual acuity. Aggregate
participant demographic information is presented in Table 1. The distribution of participants’ age at the time of
the Round 1 collection is shown in Fig. 2. The number of participants completing the entire task battery in each
round is summarized in Table 2, along with the recording dates for each round of collection.
All participants provided informed consent under a protocol approved by the Institutional Research Board
at Texas State University prior to each round of recording. This IRB review process was guided by the ethical
principles specified in the Belmont Report and by regulations of the U.S. Department of Health and Human
Services. As part of the consent process, participants acknowledged that the resulting data may be disseminated
in a de-identified form.
Data acquisition overview. Data was captured under the supervision of a trained experimental proctor.
Before initiating the recording process, the proctor provided a general overview of the experiment to the partic-
ipant, along with a summary of best practices for maximizing the quality of the captured data. Namely, partic-
ipants were instructed to maintain a stable head and body position, and to attempt to avoid excessive blinking.
Based upon initial recording experiences, it was ultimately suggested that participants avoid wearing mascara to
the recording session as part of the appointment confirmation email. This suggestion was initiated during the first
round of recording and maintained throughout the remainder of the collection.
Participants wearing eyeglasses were asked to attempt the experiment with glasses removed. This protocol
was chosen due to the known challenges associated with recording individuals wearing eyeglasses using the tar-
get capture modality. If participants were unable to complete the experimental protocol with glasses removed,
an attempt was made to complete the experiment while wearing eyeglasses. Participants that could not be suc-
cessfully calibrated or recorded after multiple attempts were withdrawn from the study. Participants could also
self-withdrawal at any point during the recording process. A total of 13 participants were withdrawn from the
initial round of the study. GazeBase contains only data from participants completing the entire recording protocol
for a given round.
Scientific Data | (2021) 8:184 | https://doi.org/10.1038/s41597-021-00959-y 3www.nature.com/scientificdata/ www.nature.com/scientificdata
Monocular (left) eye movements were captured at a 1,000 Hz sampling rate using an EyeLink 1000 eye tracker
(SR Research, Ottawa, Ontario, Canada) in a desktop mount configuration. The EyeLink 1000 is a video ocu-
lography device which operates using the pupil-corneal reflection principle, where gaze locations are estimated
from pupil-corneal reflection vectors using a polynomial mapping developed during calibration24. Stimuli were
presented to the participant on a 1680 × 1050 pixel (474 × 297 mm) ViewSonic (ViewSonic Corporation, Brea,
California, USA) monitor. Instrumentation control and recording monitoring were performed by the proctor
using a dedicated host computer as shown in Fig. 1. Recordings were performed in a quiet laboratory environ-
ment without windows. Consistent ambient lighting was provided by ceiling-mounted fluorescent light fixtures.
Participants were seated 550 mm in front of the display monitor. Participants’ heads were stabilized using a
chin and forehead rest. Once the participant was initially seated, the chin rest was adjusted to level the partici-
pants’ left eye at the primary gaze position, located 36 mm above the center of the monitor. This vertical offset
from the monitor center was chosen to ensure the comfort of taller participants given restrictions on adjusting the
chair and monitor height. Chair height was initially adjusted as necessary to ensure the comfort of the participant,
followed by additional fine tuning of the chin rest as required to align the left eye with the primary gaze position.
The lens focus was manually tuned as necessary in order to ensure the sharpness of the eye image as viewed by
the proctor on the host display.
Participants completed two sessions of recording for each round of collection. While the proctor suggested
that participants take a five-minute break between sessions if needed, participants were free to decline the break
if desired. Participants could also request breaks at any time during the recording process as noted during the
consent process. During each recording, the gaze location was monitored by the proctor to ensure compliance
with the individual task protocols.
The gaze position and corresponding stimuli were innately expressed in terms of pixel display coordinates.
These values were converted to degrees of the visual angle (dva) according to the geometry of the recording setup.
Although iris images were also captured as part of this collection before the initiation of eye movement record-
ings, they are not distributed as part of GazeBase. Prior collections including both gaze traces and matching iris
images may be found at the following link - http://userweb.cs.txstate.edu/~ok11/etpad_v2.html.
Calibration and validation. A calibration and validation procedure were performed before the recording
of each task to ensure data quality. To initiate the calibration process, pupil and corneal reflection thresholds
were established. While manual tuning was exclusively used for some initial recordings, the automatic threshold-
ing function of the instrumentation software was ultimately employed to develop initial estimates, with manual
fine-tuning performed as required.
Once threshold parameter values were tuned to ensure successful tracking of the pupil and corneal reflection,
a nine-point rectangular grid calibration was performed. During this process, participants were instructed to
fixate at the center of bulls-eye calibration target positioned on a black background. The bulls-eye target con-
sisted of a larger white circle with an approximate diameter of one dva enclosing a small black dot as shown in
Fig. 1. The stability of target fixations was monitored by the proctor on the host monitor using a vendor-provided
software interface. If necessary, the proctor provided additional instructions to improve image capture quality
(i.e.: increase eye opening, etc.). Once the software determined that the participant had successfully fixated on a
target, the calibration process advanced to the next target. Calibration was terminated when a stable fixation had
been captured for all nine points in the grid, thereby producing the aforementioned mapping for estimating gaze
location.
A nine-point validation process was subsequently performed to ensure calibration accuracy. Validation points
outside of the primary position were disjoint from those utilized in the calibration grid. Validation for each tar-
get was manually terminated by the proctor (contrasting from the calibration procedure, which used automatic
termination) upon the determination of a stable target fixation. The spatial accuracy of each fixation on the cor-
responding validation target, hereby referred to as the validation error, was computed after completion of the val-
idation process. Validation error was determined by computing the Euclidean distance between each target and
the estimated gaze location. A maximum and average validation error of less than 1.5 and 1.0 dva, respectively,
was established as a guideline accuracy criteria for accepting the calibration. However, acceptance of the calibra-
tion was ultimately determined by the proctor based upon visual inspection of the discrepancy between the esti-
mated and true target location for each validation point, with additional discretion applied to calibrations failing
to meet this quantitative accuracy goal. The calibration protocol was repeated before the recording of each task.
Task battery overview. A battery of seven tasks were performed during each session of the recording. Tasks
were performed in the numbered order described in the following subsections. Acronyms utilized to describe
each task within the distributed dataset are defined within each subsection title.
Task 1: Horizontal Saccade Task (HSS). The HSS task was designed to elicit visually-guided horizontal saccades
of constant amplitude through the periodic displacement of a peripheral target. Participants were instructed
to fixate on the center of the bull’s-eye target utilized during calibration. The target was displayed on a black
background and was initially placed at the primary gaze position. The target was regularly displaced between
two positions located ±15 dva horizontally from the center of the screen, thereby ideally eliciting a 30 degree
horizontal saccade upon each jump displacement. The target’s position was maintained for one second between
displacements, with 100 transitions occurring during each recording. The proctor informed participants of the
time remaining at 20 second intervals throughout the task. An identical stimulus was used for the HSS task across
participants, sessions, and rounds.
Scientific Data | (2021) 8:184 | https://doi.org/10.1038/s41597-021-00959-y 4www.nature.com/scientificdata/ www.nature.com/scientificdata
Task 2: Video Viewing Task 1 (VD1). The VD1 task was designed to elicit natural eye movements occurring
during the free-viewing of a cinematic video. Participants were instructed to watch the first 60 seconds of a trailer
for the movie “The Hobbit: The Desolation of Smaug”. No audio was played during the video clip. The same video
segment was used for the VD1 task across participants and rounds. Due to variability in instrumentation settings,
the video stimulus was only displayed for the initial 57 seconds during the second session of each recording.
Task 3: Fixation Task (FXS). The FXS task was designed to elicit fixational eye movements through the static
presentation of a central fixation target located at the primary gaze position. Participants were instructed to fixate
on the previously described bull’s-eye target which was maintained at the center of the display for 15 seconds.
The proctor asked that participants avoid blinking if possible during the duration of the task before initiating the
recording. An identical stimulus was used for the FXS task across participants, sessions, and rounds.
Task 4: Random Saccade Task (RAN). The RAN task was designed to elicit visually-guided oblique saccades of
variable amplitude through the periodic displacement of a peripheral target. Similar to the HSS task, participants
were instructed to follow the bull’s-eye target by fixating at its center. The target was displaced at random locations
across the display monitor, ranging from ±15 and ±9 dva in the horizontal and vertical directions, respectively.
The minimum amplitude between adjacent target displacements was two degrees of the visual angle. Similar to
the HSS task, the target was displayed on a black background, with each position maintained for one second. As
the trajectory of the target was randomized for each recording iteration, the stimulus varied across participants,
sessions, and rounds. The distribution of target locations was chosen to ensure uniform coverage across the dis-
play. A sample screen capture video recorded during the RAN task is also included within the data repository.
Task 5: Reading Task (TEX). The TEX task was designed to capture participants’ eye movements during read-
ing. Participants were instructed to silently read a passage from the poem “The Hunting of the Snark” by Lewis
Carroll. The task was automatically terminated after 60 seconds irrespective of the participants’ reading progress.
Participants did not receive explicit instructions of what to do if they finished reading before the end of the 60 sec-
ond period. Instead, several possible actions were suggested, including rereading the passage. Because of this
ambiguity in instructions, the gaze position towards the end of the recording may vary from the expected per-line
pattern typically encountered during reading. A unique passage of the poem was displayed as the stimulus for
each session across the entire experiment (i.e.: 18 total passages), with the same pair of passages utilized for all
participants within a round. An image of each TEX stimulus employed within the experiment is provided within
the data repository at full screen resolution. In addition, the method used to convert from screen pixels to dva is
also provided within the repository.
Task 6: Balura Game (BLG). The BLG task was designed to capture participants’ eye movements while inter-
acting with a gaze-driven gaming environment. During the game, blue and red balls moving at a slow fixed
speed were presented on a black background. Participants were instructed to attempt to remove all red balls from
the display area as quickly as possible. Red balls were eliminated when the participant fixated on them, while
blue balls could not be eliminated. Visual feedback was provided to participants by placing a highlighted border
around each ball upon the detected onset of a fixation on the ball. The game was terminated when no additional
red balls were remaining. Further details regarding the game may be found at the following link - https://digital.
library.txstate.edu/handle/10877/4158. In addition, a sample screen capture video recorded during the BLG task
is also included within the data repository.
In some instances, steady fixations on red balls did not produce the desired elimination behavior. Based upon
this limitation, the proctor instructed participants to not maintain elongated fixations if the red balls were not
eliminating as intended. Instead, participants were instructed to move their gaze away from the ball, and subse-
quently re-fixate on the non-eliminating ball. As the initial position and trajectory of each ball was set randomly
for each recording, the stimulus varied across participants, sessions, and rounds.
Task 7: Video Viewing Task 2 (VD2). Participants were instructed to watch the subsequent 60 seconds of the
trailer used in the VD1 task. Similar to the VD1 task, no audio was presented to the participants. The same video
was used for the VD2 task across participants and rounds. Similar to the VD1 task, the duration of the VD2 stim-
ulus in Session 2 was truncated to 57 seconds due to variability in instrumentation settings.
Data Records
GazeBase is available for download on figshare25. GazeBase is distributed under a Creative Commons Attribution
4.0 International (CC BY 4.0) license. All data have been de-identified in accordance with the informed consent
provided by participants.
GazeBase is organized in a hierarchical directory structure by round, participant, session, and task, respec-
tively. Data records are compressed at the participant folder level. Each task folder contains a single csv file with
the following naming convention - ‘S_rxxx_Sy_tsk’, with the relevant parameters for each field summarized in
Table 3. The first line of each file contains the variable identifiers for each column, which are summarized in
Table 4.
Missing samples within each file are denoted by a non-zero value in the val field, with the corresponding gaze
position specified as NaNs. Missing samples result from the failure to extract either the pupil or corneal reflection
from the captured image, which may occur under scenarios of blinks or partial occlusions of the eye. For tasks
not employing a target (i.e.: VD1, TEX, BLG, VD2), target entries (i.e.: columns xT and yT) are populated with
NaNs at each sample.
Scientific Data | (2021) 8:184 | https://doi.org/10.1038/s41597-021-00959-y 5www.nature.com/scientificdata/ www.nature.com/scientificdata
Naming
Parameter Definition Valid Values
r Round Number 1–9
xxx Participant ID 1–335 (excluding incomplete participants)
y Session Number 1–2
tsk Task Description ‘HSS’, ‘VD1’, ‘FXS’, ‘RAN’, ‘TEX’, ‘BLG’, ‘VD2’
Table 3. Description of file naming convention.
Variable Identifier Definition
n Timestamp (ms)
x Horizontal gaze position (dva)
y Vertical gaze position (dva)
val Sample validity (binary indicator)
xT Horizontal target position (dva) (where applicable)
yT Vertical target position (dva) (where applicable)
dP Uncalibrated pupil area (arbitrary units)
lab EyeLink online parser classification labels (where applicable)
Table 4. Description of file variables.
Event Label
Fixation 1
Saccade 2
Blink −1
Table 5. Numbering convention for classification labels.
1.6
1.4
Average Validation Error (dva)
1.2
1
0.8
0.6
0.4
0.2
R1 R2 R3 R4 R5 R6 R7 R8 R9
Round ID
Fig. 3 Distribution of mean validation error across recordings versus round. The central mark in each box
corresponds to the median value, with the lower and upper edges of the box corresponding to the 25th and 75th
percentiles of the distribution, respectively. The whiskers extend to the outlier boundaries for each round, which
are set at 1.5 times the interquartile range of the distribution above and below the box boundaries. Outliers are
marked using the + symbol.
The provided pupil area for each sample is an uncalibrated area value in arbitrary units produced by the meas-
urement system. These values are reported as integers typically ranging from 100 to 10,000 units24. The accuracy
of pupil area measurements varies as a function of gaze position due to pupil foreshortening error26.
The provided classification labels are produced by the real-time EyeLink Parser software included with the test
instrument24. The parser labels each sample as belonging to a fixation, saccade, or blink event. As the parser does
not label smooth pursuit events, no labels are provided for tasks which are hypothesized to induce such move-
ments (i.e.: VD1, VD2, BLG). For files corresponding to these stimuli, the label field is populated with NaNs. The
mapping between event class and corresponding sample labels is specified in Table 5.
Scientific Data | (2021) 8:184 | https://doi.org/10.1038/s41597-021-00959-y 6www.nature.com/scientificdata/ www.nature.com/scientificdata
8
7
Maximum Validation Error (dva)
6
5
4
3
2
1
0
R1 R2 R3 R4 R5 R6 R7 R8 R9
Round ID
Fig. 4 Distribution of the maximum validation error across recordings versus round. See Fig. 3 for an
explanation of box plot parameters.
Each blink event labeled by the real-time parser is proceeded and followed by a saccadic event due the rapid
changes in pupil position associated with blinks. As noted within the operating manual of the instrument, users
may wish to treat contiguous sequences of saccade-blink-saccade events as a single blink event24. Furthermore,
users should note that fixations surrounding blink events may be truncated to atypical durations (typically less
than 100 ms)24.
Users of GazeBase may also be interested in classifying the data using the Modified Nyström & Holmqvist
(MNH) classification algorithm. This algorithm was designed and validated on a subset of GazeBase, with classi-
fication performance bench-marked versus the EyeLink Parser labels by Friedman et al.11.
Technical Validation
Substantial efforts were undertaken to maintain data quality throughout the experimental design and collection
process, initiating with the selection of the recording instrument. Namely, the EyeLink 1000 was selected for data
collection due to its high spatial accuracy and precision characteristics, which have resulted in its widespread
adoption across the research community27. The EyeLink 1000 is routinely employed as a quality benchmark in the
research literature when evaluating emerging camera-based eye tracking sensors (i.e.14,28,29). To ensure adherence
to best practices throughout the data collection, all experimental proctors were trained by personnel with consid-
erable prior experience using the device. This expertise was developed during the lab’s previous data collections
using the EyeLink 1000 (e.g. https://userweb.cs.txstate.edu/~ok11/software.html).
The experimental protocol was also designed to maximize the quality of the captured data. Namely, partici-
pants were instructed to maintain a stable head position and sufficient opening of the eyelids due to the known
relationship between these factors and associated raw eye positional data quality30. A dedicated calibration and
validation process was also employed for each task to avoid calibration decay across the collection. Box plots of the
distributions of mean and maximum validation errors for each round of recording are presented in Figs. 3 and 4,
respectively. As shown, the median values of the mean validation errors in each round are less than the upper
bound of the specified typical spatial accuracy (0.5 dva) of the instrument. Moreover, the significant dispersion
of the two metrics, indicating considerable variability in calibration quality across individuals, is consistent with
prior observations in the literature31.
Code availability
The distributed csv files were generated by first converting the edf output files produced by the Eyelink 1000
to a text-based asc file format using a vendor-provided utility. These files were subsequently converted to csv
files of the specified format using a customized MATLAB script. All relevant MATLAB scripts for preparation
of the repository and figure generation may be found at the following link - https://github.com/griffihk/
GazeBaseCodeRepo. Data may be extracted from the repository into the target computing environment using
traditional csv import functions.
Received: 25 September 2020; Accepted: 20 May 2021;
Published: xx xx xxxx
References
1. Bargary, G. et al. Individual differences in human eye movements: An oculomotor signature? Vision Research 141, 157–169 (2017).
2. Jain, A., Klare, B. & Ross, A. Guidelines for best practices in biometrics research. In 2015 International Conference on Biometrics
(ICB), 541–545 (IEEE, 2015).
3. Kasprowski, P. & Ober, J. Eye movements in biometrics. In International Workshop on Biometric Authentication, 248–258 (Springer,
2004).
4. Katsini, C., Abdrabou, Y., Raptis, G. E., Khamis, M. & Alt, F. The role of eye gaze in security and privacy applications: Survey and
future hci research directions. In Proceedings of the 2020 CHI Conference on Human Factors in Computing Systems, 1–21 (2020).
Scientific Data | (2021) 8:184 | https://doi.org/10.1038/s41597-021-00959-y 7www.nature.com/scientificdata/ www.nature.com/scientificdata
5. Eberz, S., Rasmussen, K. B., Lenders, V. & Martinovic, I. Looks like eve: Exposing insider threats using eye movement biometrics.
ACM Transactions on Privacy and Security (TOPS) 19, 1–31 (2016).
6. Komogortsev, O. V., Karpov, A. & Holland, C. D. Attack of mechanical replicas: Liveness detection with eye movements. IEEE
Transactions on Information Forensics and Security 10, 716–725 (2015).
7. Winston, J. J. & Hemanth, D. J. A comprehensive review on iris image-based biometric system. Soft Computing 23, 9361–9384
(2019).
8. Woodard, D. L., Pundlik, S. J., Lyle, J. R. & Miller, P. E. Periocular region appearance cues for biometric identification. In 2010 IEEE
Computer Society Conference on Computer Vision and Pattern Recognition-Workshops, 162–169 (IEEE, 2010).
9. Sundararajan, K. & Woodard, D. L. Deep learning for biometrics: A survey. ACM Computing Surveys (CSUR) 51, 1–34 (2018).
10. Abdulin, E., Friedman, L. & Komogortsev, O. V. Method to detect eye position noise from video-oculography when detection of
pupil or corneal reflection position fails. arXiv preprint arXiv:1709.02700 (2017).
11. Friedman, L., Rigas, I., Abdulin, E. & Komogortsev, O. V. A novel evaluation of two related and two independent algorithms for eye
movement classification during reading. Behavior Research Methods 50, 1374–1397 (2018).
12. Rigas, I., Friedman, L. & Komogortsev, O. Study of an extensive set of eye movement features: Extraction methods and statistical
analysis. j. Eye Movement Research 11, 3 (2018).
13. Friedman, L. & Komogortsev, O. V. Assessment of the effectiveness of seven biometric feature normalization techniques. IEEE
Transactions on Information Forensics and Security 14, 2528–2536 (2019).
14. Lohr, D. J., Friedman, L. & Komogortsev, O. V. Evaluating the data quality of eye tracking signals from a virtual reality system: Case
study using smi’s eye-tracking htc vive. arXiv preprint arXiv:1912.02083 (2019).
15. Friedman, L., Stern, H. S., Price, L. R. & Komogortsev, O. V. Why temporal persistence of biometric features, as assessed by the
intraclass correlation coefficient, is so valuable for classification performance. Sensors 20, 4555 (2020).
16. Friedman, L., Nixon, M. S. & Komogortsev, O. V. Method to assess the temporal persistence of potential biometric features:
Application to oculomotor, gait, face and brain structure databases. PloS One 12, e0178501 (2017).
17. Griffith, H., Biswas, S. & Komogortsev, O. Towards reduced latency in saccade landing position prediction using velocity profile
methods. In Proceedings of the Future Technologies Conference, 79–91 (Springer, 2018).
18. Griffith, H., Aziz, S. & Komogortsev, O. Prediction of oblique saccade trajectories using learned velocity profile parameter mappings.
In 2020 10th Annual Computing and Communication Workshop and Conference (CCWC), 0018–0024 (IEEE, 2020).
19. Griffith, H., Biswas, S. & Komogortsev, O. Towards improved saccade landing position estimation using velocity profile methods. In
SoutheastCon 2018, 1–2 (IEEE, 2018).
20. Griffith, H. & Komogortsev, O. A shift-based data augmentation strategy for improving saccade landing point prediction. In ACM
Symposium on Eye Tracking Research and Applications, 1–6 (2020).
21. Griffith, H. K. & Komogortsev, O. V. Texture feature extraction from free-viewing scan paths using gabor filters with downsampling.
In ACM Symposium on Eye Tracking Research and Applications, 1–3 (2020).
22. Lohr, D., Griffith, H., Aziz, S. & Komogortsev, O. A metric learning approach to eye movement biometrics. In 2020 IEEE
International Joint Conference on Biometrics (IJCB), 1–7 (IEEE).
23. Abdelwahab, A. & Landwehr, N. Deep distributional sequence embeddings based on a wasserstein loss. arXiv preprint
arXiv:1912.01933 (2019).
24. Research, S. Eyelink 1000 user’s manual, version 1.5. 2 (2010).
25. Griffith, H., Lohr, D. & Komogortsev, O. V. GazeBase data repository. figshare https://doi.org/10.6084/m9.figshare.12912257 (2021).
26. Hayes, T. R. & Petrov, A. A. Mapping and correcting the influence of gaze position on pupil size measurements. Behavior Research
Methods 48, 510–527 (2016).
27. Nyström, M., Niehorster, D. C., Andersson, R. & Hooge, I. The tobii pro spectrum: A useful tool for studying microsaccades?
Behavior Research Methods 1–19 (2020).
28. Ehinger, B. V., Groß, K., Ibs, I. & König, P. A new comprehensive eye-tracking test battery concurrently evaluating the pupil labs
glasses and the eyelink 1000. PeerJ 7, e7086 (2019).
29. Raynowska, J. et al. Validity of low-resolution eye-tracking to assess eye movements during a rapid number naming task:
performance of the eyetribe eye tracker. Brain Injury 32, 200–208 (2018).
30. Nyström, M., Andersson, R., Holmqvist, K. & Van De Weijer, J. The influence of calibration method and eye physiology on
eyetracking data quality. Behavior Research Methods 45, 272–288 (2013).
31. Hornof, A. J. & Halverson, T. Cleaning up systematic error in eye-tracking data by using required fixation locations. Behavior
Research Methods, Instruments, & Computers 34, 592–604 (2002).
Acknowledgements
This work was supported by the National Science Foundation (Award CNS-1250718). Any opinions, findings,
conclusions or recommendations expressed in this material are those of the authors and do not necessarily reflect
the views of the National Science Foundation. We would also like to thank Alex Karpov and Ionannis Rigas for
help in designing the experiments, along with the numerous experimental proctors that contributed throughout
the data collection.
Author contributions
H.G. wrote the manuscript and assisted in data quality assurance, D.L. provided details regarding experimental
protocol based upon his experience as a proctor during later rounds of recording and led data quality assurance
efforts, E.A. served as the primary source of information regarding experimental protocol based upon his
experience as lead proctor during multiple rounds of recording, O.K. designed the experiments, secured funding,
and served as the project manager. All authors reviewed the manuscript.
Competing interests
The authors declare no competing interests.
Additional information
Correspondence and requests for materials should be addressed to H.G.
Reprints and permissions information is available at www.nature.com/reprints.
Publisher’s note Springer Nature remains neutral with regard to jurisdictional claims in published maps and
institutional affiliations.
Scientific Data | (2021) 8:184 | https://doi.org/10.1038/s41597-021-00959-y 8www.nature.com/scientificdata/ www.nature.com/scientificdata
Open Access This article is licensed under a Creative Commons Attribution 4.0 International
License, which permits use, sharing, adaptation, distribution and reproduction in any medium or
format, as long as you give appropriate credit to the original author(s) and the source, provide a link to the Cre-
ative Commons license, and indicate if changes were made. The images or other third party material in this
article are included in the article’s Creative Commons license, unless indicated otherwise in a credit line to the
material. If material is not included in the article’s Creative Commons license and your intended use is not per-
mitted by statutory regulation or exceeds the permitted use, you will need to obtain permission directly from the
copyright holder. To view a copy of this license, visit http://creativecommons.org/licenses/by/4.0/.
The Creative Commons Public Domain Dedication waiver http://creativecommons.org/publicdomain/zero/1.0/
applies to the metadata files associated with this article.
© The Author(s) 2021
Scientific Data | (2021) 8:184 | https://doi.org/10.1038/s41597-021-00959-y 9You can also read