Does Augmented Reality Affect Sociability, Entertainment, and Learning? A Field Experiment - MDPI
←
→
Page content transcription
If your browser does not render page correctly, please read the page content below
applied
           sciences
Article
Does Augmented Reality Affect Sociability,
Entertainment, and Learning? A Field Experiment
Nina Savela 1, * , Atte Oksanen 1 , Markus Kaakinen 2 , Marius Noreikis 3 and Yu Xiao 3
 1    Faculty of Social Sciences, Tampere University, 33100 Tampere, Finland; atte.oksanen@tuni.fi
 2    Institute of Criminology and Legal Policy, University of Helsinki, 00100 Helsinki, Finland;
      markus.kaakinen@helsinki.fi
 3    Department of Communications and Networking, Aalto University, 02150 Espoo, Finland;
      mnoreikis@yahoo.com (M.N.); yu.xiao@aalto.fi (Y.X.)
 *    Correspondence: nina.savela@tuni.fi

 Received: 14 January 2020; Accepted: 15 February 2020; Published: 19 February 2020

 Abstract: Augmented reality (AR) applications have recently emerged for entertainment and
 educational purposes and have been proposed to have positive effects on social interaction. In this
 study, we investigated the impact of a mobile, indoor AR feature on sociability, entertainment, and
 learning. We conducted a field experiment using a quiz game in a Finnish science center exhibition.
 We divided participants (N = 372) into an experimental group (AR app users) and two control groups
 (non-AR app users; pen-and-paper participants), including 28 AR users of follow-up interviews.
 We used Kruskal–Wallis rank test to compare the experimental groups and the content analysis
 method to explore AR users’ experiences. Although interviewed AR participants recognized the
 entertainment value and learning opportunities for AR, we did not detect an increase in perceived
 sociability, social behavior, positive affect, or learning performance when comparing the experimental
 groups. Instead, AR interviewees experienced a strong conflict between the two different realities.
 Despite the engaging novelty value of new technology, performance and other improvements do not
 automatically emerge. We also discuss potential conditional factors. Future research and development
 of AR and related technologies should note the possible negative effects of dividing attention to
 both realities.

 Keywords: augmented reality; sociability; social interaction; entertainment; learning

1. Introduction
     A new software technology combining physical and virtual realities by adding layers of digital
information onto the physical world using suitable devices, such as wearables, has enabled new
applications (e.g., Pokémon Go) and has introduced a novel way to communicate with others [1,2].
Changing the way people communicate and interact with each other, social media has been the most
recent technological revolution that has impacted social interaction, entertainment, and learning [3].
These aspects are also apparent in perceived benefits that motivate people to use social media [4–6].
As new technology has the potential to permanently change the way we behave, besides user studies
and product development, cutting-edge technology should be examined with regard to its implications
on social interaction, sociability, entertainment, and learning.
     Augmented reality (AR) applications enable people to interact with virtual objects overlaid in the
physical environment and visible through digital screens. AR or mixed reality (MR) can be located in a
continuum between real and virtual reality or seen as a combination of the two different elements [7,8].
As a result of the incoherent use of the terminology and commercial success of AR applications,
previous researchers and other stakeholders have often referred to MR as AR, even though only some

Appl. Sci. 2020, 10, 1392; doi:10.3390/app10041392                                 www.mdpi.com/journal/applsci
Appl. Sci. 2020, 10, 1392                                                                           2 of 15

of the experts in the field use them as synonyms [8]. The suggested definitions of MR summarized by
Speicher and colleagues [8] indicate that collaboration is one of the key aspects used in defining the
concept. Piumsomboon and colleagues [9,10], for example, studied the collaboration between the local
AR user and remote virtual reality (VR) user.
      Increasing amounts of AR and MR applications are being designed and introduced each year to
the public and to various industry fields, such as education, health care, and maintenance, to name
a few [11–13]. As an entertainment technology combined with a global positioning system, AR is
best known to the public thanks to Pokémon GO, but new games and applications emerge, including
Minecraft Earth and Harry Potter: Wizards Unite. Based on previous research, AR applications such
as AR games could potentially enhance social communication and social interaction between people.
Researchers have focused on the case of Pokémon Go and concluded that AR games have the potential
for positive behavioral effects such as socialization [14]. Some games, not just AR games, incorporate
more social and collaborative features to the gameplay than others, but even single-player games have
been argued to have inherent social aspects [15]. Thus, augmented reality games could potentially
foster sociability by gathering users together in a shared space and offering affordances for interacting
with other users via options to comment, read, and reply to others. Mäyrä and colleagues [16] describe
the single-player games in general, “knowledge of others playing the same game makes the game
more social”, which presumably concerns AR technology as well. Against this, it is interesting that a
sense of social presence in MR technology has been found to positively affect visitor experiences in
public places [17].
      Entertainment value is also an important factor in itself and becomes even more relevant when
investigating AR game outcomes in the context of recreational activities. More generally, gamification
has combined research of technology and game design, motivation, and human–computer interaction,
among others [18]. In a review of engagement in digital entertainment games, researchers categorized,
for example, subjective experience, physiological responses, motives for playing, and impact of game
on life satisfaction as aspects of engagement [19]. Recently, researchers studying AR identified hedonic
and utilitarian as important aspects in AR adoption and found that consumers regard AR to be useful in
tourism and education [20], and based on a literature review, AR had positive effects on engagement (e.g.,
in the museum context) [21]. Pervasive MR games are not without their challenges from hedonic and
emotional perspectives. Enjoyment and engagement could be disrupted by, for example, awkwardness of
playful behavior in public places [22]. Immersive games also impact the sense of presence [23], which
could result in conflict between realities in the case of MR, but research on this remains scarce.
      Based on a systematic literature review on the effects of computer games and serious games,
there exist evidence about the effectiveness of game-based learning [24]. The authors concluded
that “playing computer games is linked to a range of perceptual, cognitive, behavioral, affective and
motivational impacts and outcomes” [24] (p. 661). For example, they found evidence on knowledge
acquisition, motivational, and affective outcomes, but they noted the difficulties in defining learning
outcomes [24]. In previous studies on AR and similar technologies, researchers have indeed focused
heavily on their learning potential and have found similar findings than the aforementioned literature
on game-based learning e.g., [25,26].
      Wu and colleagues showed in their literature review on AR in education that research has
emphasized the potential of AR to improve learning and aid in learning difficulties, but some
challenges have also been noted regarding cognitive overload, lack of complex skills, and confusion
between reality and fantasy [27]. In another systematic review, Bacca and colleagues demonstrate that
the target group of most of the research on AR and learning has been students of bachelor level or
lower, with only a couple targeting informal learners [28]. According to the authors, learning gains,
motivation, and facilitated interaction and collaboration were the most reported advantages of AR [28].
Finally, in a more recent systematic literature review, researchers found mixed evidence about cognitive
overload and called for future research on the effects of informal and ubiquitous learning, motivation,
engagement, satisfaction, and interactions [25].
Appl. Sci. 2020, 10, 1392 3 of 15
Appl. Sci. 2020, 10, x FOR PEER REVIEW 3 of 18
Researchers
affordance have and
with social highlighted socialaffordances
entertaining aspects such
in as socialcalling
a paper presence, social space, and
for consideration sociability
of these three
in learning in other technology contexts as well [29]. Kreijns and Kirschner [30] coupled
perspectives on online collaborative learning. These aspects are also part of the uses and gratifications educational
affordance withseeks
approach that socialtoand entertaining
explain affordances
the reasons in a paperbehind
and motivations callingmedia
for consideration of these
use with social, three
affective,
perspectives on online collaborative learning. These aspects are also part of the uses
and cognitive needs, among others [31]. However, our interest lies not in the end results of these and gratifications
approach thatsuch
motivations, seeksasto explain
perceivedthe benefits
reasons andandmotivations
motivationsbehind
to use, media
but,usein with
the social,
spirit affective,
of mass
and cognitive needs,
communication theory among others
[32], in how[31]. However,
the new our interest
AR technology is lies not inable
actually the to
endaffect
results of these
sociability,
motivations, such as perceived benefits and motivations to use, but, in the spirit of
entertainment, and learning. This kind of research has not been done on AR technology before. mass communication
theory [32], in how the new AR technology is actually able to affect sociability, entertainment, and
learning.
This StudyThis kind of research has not been done on AR technology before.
In this experimental study, we investigated how indoor AR technology influences users’
This Study
sociability, entertainment, and learning in shared space. To test whether AR technology has an
In this experimental study, we investigated how indoor AR technology influences users’ sociability,
independent effect on the three aforementioned perspectives, we conducted a field experiment in a
entertainment, and learning in shared space. To test whether AR technology has an independent
science center exhibition and designed an experiment comparing AR application participants to non-
effect on the three aforementioned perspectives, we conducted a field experiment in a science center
AR (a mobile application without AR features) and pen-and-paper participants. Based on previous
exhibition and designed an experiment comparing AR application participants to non-AR (a mobile
research, AR technology could potentially have effects on sociability and communication with other
application without AR features) and pen-and-paper participants. Based on previous research, AR
players [14–16], as well as entertainment and learning-related consequences [20,21,25–28]. To
technology could potentially have effects on sociability and communication with other players [14–16],
investigate this further, this study has the following research questions:
as well as entertainment and learning-related consequences [20,21,25–28]. To investigate this further,
1. study
this Does augmented realityresearch
has the following have an questions:
effect from the social perspective on (a) perceived sociability or
social behavior of (b) leaving messages or (c) talking with others face-to-face?
1. Does augmented reality have an effect from the social perspective on (a) perceived sociability or
2. Does augmented reality have an effect from the entertainment perspective on (a) excitement, (b)
social behavior of (b) leaving messages or (c) talking with others face-to-face?
nervousness, (c) tiredness afterwards, (d) app satisfaction, or (e) exhibition enjoyment?
2. Does augmented reality have an effect from the entertainment perspective on (a) excitement, (b)
3. Does augmented reality have an effect from the educational perspective on learning
nervousness, (c) tiredness afterwards, (d) app satisfaction, or (e) exhibition enjoyment?
performance?
3. Does augmented reality have an effect from the educational perspective on learning performance?
More specifically, from the social perspective, we include aspects of perceived sociability and
actualMore specifically,
social behavior from
withthe social
other perspective,
people. From thewe include aspectspoint
entertainment of perceived
of view,sociability and
we examine
actual social behavior with other people. From the entertainment point of view, we
perceived satisfaction with the exhibition and application, reported affects of excitement and examine perceived
satisfaction
nervousnesswith the exhibition
during and application,
the experiment, reportedafter
and tiredness affects
theofexhibition.
excitement Lastly,
and nervousness during
the educational
the experiment, and tiredness after the exhibition. Lastly, the educational perspective
perspective encompasses learning performance during the experiment. We compared all these encompasses
learning performance
aspects among during the experiment.
three experimental groups thatWeprovided
comparedthree
all these aspects
different amongAR
stimuli: three experimental
application, an
groups that without
application providedAR three different and
technology, stimuli: AR application,
without smartphone an application
application without
using AR technology,
only pen and paper.
and
The without smartphone
experiment application
environment using
provides only pen
stimuli andand paper. The experiment
opportunities environment
for learning, provides
entertainment, and
stimuli and opportunities for learning, entertainment, and social behavior through
social behavior through shared social space. Figure 1 shows the detailed study design. shared social space.
Figure 1 shows the detailed study design.
Figure 1. The study design.
Figure 1. The study design.Appl. Sci. 2020, 10, 1392 4 of 15
2. Materials and Methods
2.1. Procedure
We conducted a field experiment in the Finnish Heureka Science Centre to investigate the effects
of AR technology on visitor experiences and behavior. Using the science center’s own quiz related to
biotechnology, we developed a quiz game for the AR app, app without AR feature (non-AR app), and
pen-and-paper questionnaire. We invited the participants to participate in our study, and then we
randomly assigned them to one of the three different conditions in the science center’s main exhibition
room, which presents multiple themes included in the quiz. All three conditions (AR, non-AR, and
pen-and-paper) were carried out simultaneously and there was some variation depending on the
day and number of visitors at the exhibition space. Participants received a small candy reward after
the experiment.
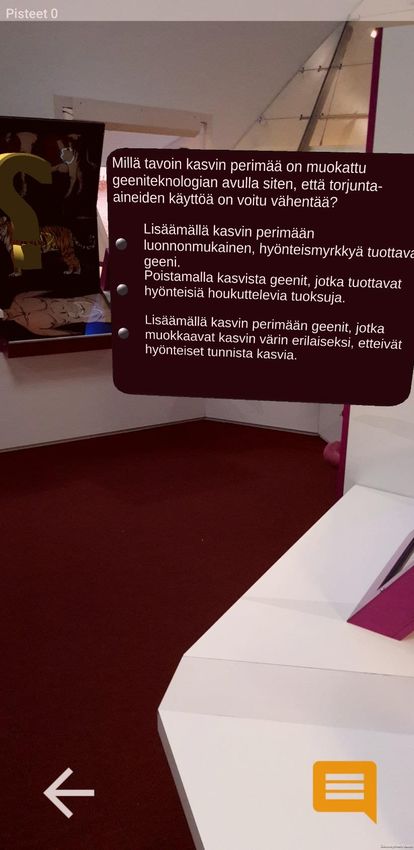
The key feature of the AR app was for the visitors to interact with the quiz using AR. As they start,
visitors look around the exhibition through their phone screens and discover the hidden quiz questions,
represented as virtual floating question marks, scattered around the exhibition (see Appendix A).
When a user approaches a question mark, the quiz questions are shown. Questions are placed near
exhibits that are related to the question contents. Altogether, 15 questions were located around the
room in eight different places. Therefore, one must tour the entire exhibition room to discover and
answer all the quiz questions. Questions can be answered by tapping on one of the four possible
answers. Once answered, the questions disappear, as well as the question mark hints. Users can keep
track of the number of remaining questions. After all the questions are answered or if the users decide
to quit the quiz, they are presented with a quiz score. Within the exhibition, users may also leave
comments that will appear as an augmented 3-D object, placed on the museum floor. Other users can
immediately see the comments left by others, read them, and post replies.
The non-AR app contains the same functionality as the AR app; however, a user solves a quiz on
the phone’s screen without AR interaction (see Appendix B). In contrast to the AR app, a non-AR app
user can immediately browse through and answer all the quiz questions without the need to explore
the exhibition. The quiz questions and scoring system are the same for both applications. Non-AR app
users can also write comments next to a selected question and reply to comments left by other non-AR
app users. They can also read the comments, but because opening the comments section immediately
shows all the comments, we did not have a reliable way of determining which comments were actually
read by a user and thus we have missing information about the read comments of non-AR app users.
Both applications were developed for the Android platform. To implement the AR feature in
the AR app, we utilized image-base localization, the ARCore library by Google, and the Unity game
engine by Unity Technologies. The non-AR app was developed using Google’s Android Software
Development Kit. The applications obtain questions and comments from a server and continuously
send users’ activity information to the server. The activity information indicates times when the quiz
was started and finished, quiz scores, and read (for AR app only) and written comments. Furthermore,
before and after the quiz, both applications ask users a series of questions that are also sent to the
server. We stored all collected data in the database for later analysis.
We gave the other control group a pen-and-paper questionnaire with the quiz in the middle and
questionnaire items before and after the quiz. We provided additional papers on a side desk next to
the starting point and informed them that they could leave comments for other visitors to read and
reply to. Similar to non-AR condition, we did not have a reliable way to detect if participants read
any comments and thus, we have missing information about the read comments of pen-and-paper
participants as well. All the experimental groups were offered two comments as a starting point: “You
can leave comments and reply to comments left by others!” and “When you stand in a certain point of
the room, you can see the Big Dipper.”Appl. Sci. 2020, 10, 1392 5 of 15
2.2. Participants
We collected the data in autumn 2018 from science center visitors (N = 372) who were aged 15–73
(M = 36.49, SD = 11.71), and 55.95% of them were female. Of all the participants, 231 were given AR
applications, 71 participated with an application without AR technology, and 70 were handed pen and
paper. Because our main interest was in the impact of AR technology, we recruited a larger number of
AR participants to ensure enough information about the key phenomena. To assess the success of our
randomization, we tested whether there were significant differences between our experimental groups
in terms of background factors. We found that there were no differences between experimental groups
in age, gender, extraversion trait, smartphone application self-efficacy, or previous experience with the
exhibition. This means that the randomization was successful and found differences cannot be due to
these background variables. In addition to the experiment, 28 users of AR application participated in a
follow-up interview. All subjects gave their informed consent for inclusion before they participated in
the study.
2.3. Measures
We measured the dependent variable of sociability with a same four-item instrument [33] before
and after the game. This instrument was chosen because of its validated design of before and after
measurement points. Participants answered statements on a scale from 1 (strongly disagree) to 7
(strongly agree): “Right now I feel social,” “Right now I feel unsocial,” “Right now I feel talkative,”
and “Right now I feel quiet.” The sum variable of the items had a Cronbach’s alpha of 0.86 before and
0.90 after the quiz. Average sum variable was used for the remainder after subtracting before from
after values of perceived sociability. We measured the dependent variable related to social behavior by
asking participants in the questionnaire whether they talked with other visitors and, if yes, whether
they were unknown to them from before. We used these measures as dummy variables. In addition
to the questionnaire items, we collected information about written comments and replies that were
collected for every AR and non-AR app participant via the applications. The AR app also collected
data about how many comments or replies were read by the users. After the field days, we collected
papers left for pen-and-paper participants on a side desk for commenting.
The second set of dependent variables is related to the entertainment value and affects. Considering
the reliable results of previous research in measuring immediate moment positive and negative
affects [34,35], we asked all participants two questions in the middle of the quiz—that is, how excited
or nervous they felt at the moment of filling the quiz. At the end of the questionnaire, participants
also scored one statement about feeling tired after the exhibition. In addition to measuring perceived
affects, we measured entertainment in the light of application and museum context. After the quiz, we
asked them about their app satisfaction using three items (e.g., “the application I tested was fun to
use”) with a Cronbach’s alpha of 0.83. They also answered to two items of exhibition satisfaction (e.g.,
“the exhibition was interesting”) with a Cronbach’s alpha of 0.80. We measured all items regarding
entertainment value and affects on a scale from 1 to 7. Average sum variable was used for the 3- and
2-item measures of app and exhibition satisfaction.
Thirdly, we measured participants’ performance in the quiz. Scoring was based on how the
science center scored its quizzes. If the correct answer to the question was “All of the above,” a user
received 3 points, and if only a single choice was selected when “All of the above” was a correct answer,
a user received 1 point. After the first question, a user received 1 point for a correct answer and 0
for incorrect ones. In the analysis, we excluded those participants who did not finish the quiz. This
information was collected with applications and calculated for pen-and-paper participants based on
whether they answered the last question of the quiz.
We used a semi-structured interview method to collect a more in-depth account of user perceptions.
The interview form contained 10 questions related to the experiences of the previous experiment (see
Appendix C). The answers to the questions allowed us to examine the underlying reasons for theAppl. Sci. 2020, 10, 1392 6 of 15
results of the experiment with the AR quiz application. Table 1 shows the descriptive statistics of all
measures used in this study.
Table 1. Summary of Descriptive Statistics of the Study Variables (N = 372): Frequency (n), Percent (%),
Mean (M), Standard Deviation (SD), Range, Number of Items in a Sum Variable, and Alpha (α).
n of
Measure n % M SD Range α
Items
Experimental groups 372
Experimental group (augmented reality [AR]
231 62.10
app participant)
Control group (non-AR app participant) 71 19.09
Control group (pen and paper participant) 70 18.82
Sociability before the experiment 370 4.76 1.19 1–7 4 0.86
Sociability after the experiment 370 4.44 1.30 1–7 4 0.90
Sociability after–before 368 −0.32 1.18 −6–3.25 8
Talked with other visitors 357 0–1 1
No 201 56.30
Yes 156 43.70
Talked with unfamiliar visitors 156 0–1 1
No 112 71.79
Yes 44 28.21
Left comments 372 0–1 1
No 346 93.01
Yes 26 6.99
Excitement during experiment 208 4.34 1.24 1–7 1
Nervousness during experiment 188 3.30 1.66 1–7 1
Tiredness after the exhibition 371 3.61 1.49 1–7 1
App satisfaction 302 3.88 1.42 1–7 3 0.83
Exhibition satisfaction 371 5.37 1.13 2–7 2 0.80
Quiz score (from those who finished) 155 10.54 2.67 3–16 1
2.4. Analysis
We used descriptive statistics, cross tabulation, χ2 test, Kruskal–Wallis equality of populations
rank test, and Dunn’s pairwise multiple comparison with Bonferroni corrections post hoc test to
compare the experimental groups in measures of social behavior, perceived sociability, entertainment,
and quiz performance. We chose non-parametric Kruskal–Wallis test by ranks over the ANOVA
analysis of variance, because of the unequal sizes of the experimental groups and unequal variances
based on Barlett’s test for equal variances. For additional analysis we used the ordinary least squares
(OLS) regression analysis and binary logistic regression methods, for which we report unstandardized
regression coefficient (B), odds ratio (OR), and p values. We performed all statistical analyses with Stata
12 and Stata 16. For Dunn’s pairwise multiple comparisons, we used a Stata package programmed by
Alexis Dinno [36].
We used the directed content analysis method [37] to explore AR application users’ experiences of
learning, entertainment, and social interaction, and also reasons for, for example, communicating (or
not) with others. With this approach, we could use the research findings from the quantitative analysis
to find relevant information related to the rationale of participants’ behaviors.
3. Results
3.1. Sociability and Social Behavior
The results of the change in sociability before and after the quiz show that participants in all
experimental groups felt, on average, less sociable after than before the quiz (M = −0.32, SD = 1.18; see
Table 2). Compared to AR users (M = −0.32, SD = 1.25), non-AR users felt even less sociable (M = −0.52,
SD = 1.09), but the negative effect was smaller for pen-and-paper participants (M = −0.08, SD = 0.95).
However, based on the Kruskal–Wallis rank test, the difference among the experimental groups wasAppl. Sci. 2020, 10, 1392 7 of 15
not statistically significant (χ2 [2, N = 368] = 5.64, p = 0.060, with ties), except between the two control
groups (χ2 [1, N = 137] = 5.99, p = 0.014, with ties).
Table 2. Means (M), Standard Deviations (SD), Frequencies (n), Rank Sum, and Dunn’s Multiple
Nonparametric Pairwise Post Hoc Test with Bonferroni Corrections for Differences in Dependent
Variable of Sociability (N = 372).
Sociability M SD n Rank Sum 1. AR App 2. Non-AR App
Sociability after–before −0.32 1.18 368
1. AR app −0.32 1.25 231 42,473.00
2. Non-AR app −0.52 1.09 71 11,707.00 1.32
3. Pen and paper −0.08 0.95 66 13,716.00 −1.62 −2.37 *
* p < 0.05. ** p < 0.01. *** p < 0.001. Note. The dependent variable: Perceived Sociability (After—Before the Quiz).
Table 3 shows the cross tabulation of talking with other visitors. We did not find statistically
significant differences in talking to other visitors between the experimental groups, but the χ2 test
result suggests that AR app users were slightly less likely to talk with others than the two control
groups put together (χ2 [1] = 5.97, p = 0.015). In addition, from those participants who talked with
someone, pen-and-paper participants were more likely to engage in a discussion with someone who
was unknown to them from before compared to AR app users (χ2 [1] = 14.41, p < 0.001) and, to some
extent, to non-AR app users (χ2 [1] = 4.35, p = 0.037).
Table 3. Cross Tabulation of Talking with Other Visitors by Experimental Groups (N = 372).
Measure All Participants AR App Non-AR App Pen and Paper
Talked with other
357 (100%) 231 (100%) 71 (100%) 55 (100%)
visitors
No 201 (56.3%) 141 (61.0%) 34 (47.9%) 26 (47.3%)
Yes 156 (43.7%) 90 (39.0%) 37 (52.1%) 29 (52.7%)
Talked with
156 (100%) 90 (100%) 37 (100%) 29 (100%)
unfamiliar visitors
No 112 (71.8%) 73 (81.1%) 26 (70.3%) 13 (44.8%)
Yes 44 (28.2%) 17 (18.9%) 11 (29.7%) 16 (55.2%)
Most participants did not leave any comments (see Appendix D). We provided pen-and-paper
participants additional papers on a side desk next to the starting point for leaving comments, but they
did not write anything down or reply to comments made by others. Non-AR app participants did not
reply to any comments, and only four of them (4/71, 5.6%) left comments with the non-AR application.
From the AR app participants, nearly every tenth left at least one comment (22/231, 9.5%) or reply
(27/231, 11.7%), and every other AR participant read at least one comment (114/231, 49.4%). Within the
limitations of missing information of read comments by pen-and-paper and non-AR participants, the
results show that AR users left more comments and replied more to other visitors’ comments than the
control groups.
In the follow-up interviews of AR users, some participants commented that AR could be suitable
for social interaction among introverted people. However, they also reported conflict and disorientation
in trying to pay attention to their surroundings and to other people while navigating the room and
advancing in the quiz. Some reported not paying any attention to other people, and some perceived
that other visitors were more of an annoyance because it was difficult to get close enough to the question
spots and to move around the room, as presented in this comment: “I feel like I don’t necessarily pay
attention to other people, that I could even walk over someone. I was in there at the phone, but still it
felt as if I wasn’t here in this space” (Interviewee 11). One interviewee explicitly expressed not feeling
sociable while participating in our experiment: “I definitely didn’t feel myself sociable. I would haveAppl. Sci. 2020, 10, 1392 8 of 15
been more social without [the phone or app]” (Interviewee 5). Another interviewee did not think
this app increases talking to other people because it was more of an individual task: “I feel that this
app does not help interacting with others, at least not the one I used now. This was private activity”
(Interviewee 9). Interviewees who reported having found comments and who talked about being
engaged with the game were excited about finding the comments and question marks. Some reported
not quite catching the point of them, and other times, people discussed the user interface of comments
and questions.
3.2. Entertainment
Table 4 shows the results for excitement and nervousness during the quiz. Excitement during
the quiz was moderately high for all participants (M = 4.28, SD = 1.17). However, AR app users
were less excited (M = 4.09, SD = 1.36) than pen-and-paper participants (M = 4.68, SD = 1.10), with
non-AR participants being somewhere in the middle (M = 4.28, SD = 1.17). The difference among
experimental groups was statistically significant (χ2 [2, N = 208] = 9.73, p = 0.008, with ties) based
on the Kruskal–Wallis rank test. We found significant pairwise difference between AR users and
pen-and-paper participants but not when comparing non-AR participants to other experimental
groups. During the quiz, participants using phone applications were more nervous than pen-and-paper
participants (M = 2.46, SD = 1.43), with non-AR app users feeling most nervous (M = 4.35, SD = 1.54)
and AR app users somewhere between (M = 3.32, SD = 1.48). The difference between the experimental
groups and among all groups was statistically significant (χ2 [2, N = 188] = 39.11, p < 0.001, with ties)
based on the Kruskal–Wallis rank test and Dunn’s pairwise comparison with Bonferroni corrections
post hoc test.
Table 4. Means (M), Standard Deviations (SD), Frequencies (n), Rank Sum, and Dunn’s Multiple
Nonparametric Pairwise Post Hoc Test with Bonferroni Corrections for Differences in Dependent
Variables of Entertainment (N = 372).
Entertainment M SD n Rank Sum 1. AR App 2. Non-AR App
Excitement during the quiz 4.34 1.24 208
1. AR app 4.09 1.36 80 7341.00
2. Non-AR app 4.28 1.17 60 6134.50 −1.06
3. Pen and paper 4.68 1.10 68 8260.50 −3.10 ** −1.87
Nervousness during the quiz 3.30 1.66 188
1. AR app 3.32 1.48 66 6307.00
2. Non-AR app 4.35 1.54 54 6905.00 −3.29 **
3. Pen and paper 2.46 1.43 68 4554.00 3.10 ** 6.25 ***
Tiredness after the exhibition 3.61 1.49 371
1. AR app 3.54 1.42 231 41,995.50
2. Non-AR app 3.34 1.52 71 11,905.50 0.99
3. Pen and paper 4.12 1.62 69 15,105.00 −2.58 * −2.89 **
App satisfaction 3.88 1.42 302
1. AR app 3.78 1.37 231 33,401.50
2. Non-AR app 4.20 1.56 71 12,351.50 −2.49 **
Exhibition satisfaction 5.37 1.13 371
1. AR app 5.33 1.11 231 41,776.50
2. Non-AR app 5.36 1.24 71 13,207.00 −0.36
3. Pen and paper 5.54 1.08 69 14,022.50 −1.53 −0.96
* p < 0.05. ** p < 0.01. *** p < 0.001. Note. The dependent variables: excitement and nervousness during the quiz,
app satisfaction, exhibition enjoyment, and tiredness after the exhibition.
Table 4 shows results also for tiredness after the exhibition, app satisfaction, and exhibition
satisfaction. The reported tiredness after the exhibition was close to neutral for all participants
(M = 3.61, SD = 1.49). Participants using the pen-and-paper questionnaire felt more tired (M = 4.12,
SD = 1.62) compared to participants using phone applications, namely AR app users (M = 3.54,Appl. Sci. 2020, 10, 1392 9 of 15
SD = 1.42) and non-AR app users (M = 3.34, SD = 1.52). The difference among the experimental groups
was statistically significant (χ2 [2, N = 371] = 9.34, p = 0.009, with ties) based on the Kruskal–Wallis rank
test. Both app participants’ satisfaction with the application was little above the middle of the scale. AR
app users were slightly less satisfied with the application (M = 3.78, SD = 1.37) than non-AR app users
(M = 4.20, SD = 1.56), the difference being statistically significant (χ2 [1, N = 302] = 6.19, p = 0.013, with
ties) based on the Kruskal–Wallis rank test. All participants were highly satisfied with the exhibition
(M = 5.37, SD = 1.13). Participants using pen and paper were most satisfied (M = 5.54, SD = 1.08),
followed by non-AR participants (M = 5.36, SD = 1.24) and AR app users (M = 5.33, SD = 1.11). The
differences between the experimental groups and among all groups based on the Kruskal–Wallis rank
test were not statistically significant (χ2 [2, N = 371] = 2.36, p = 0.308, with ties).
AR interviewees reported high excitement in testing out new cutting-edge technology. Participants
regarded the AR technology for the science center to be appropriate and complementary for the
exhibition: “It felt quite natural and of course supports and expands this kind of exhibition environment
well. I felt that the app was naturally well-suited to the exhibition” (Interviewee 13). Dissatisfied
comments about app satisfaction were related to difficulties with some features of the app and learning
how to use it: “At first it was a little confusing, but you get used to it” (Interviewee 12). One major
theme in the interview data was the competitive side of the game and getting hooked in finding all the
elements and finishing the game. This can be noted when one person mentioned being attracted to the
comments and questions: “I noticed that the app attracted my attention and was searching for those
others’ comments and questions. I did like [the app]” (Interviewee 9).
3.3. Learning Performance
Table 5 shows the results regarding quiz performance. We excluded those who did not finish the
quiz from this analysis. Based on the results, AR users received lower scores from the quiz (M = 8.59,
SD = 2.14) than the two control groups: pen-and-paper participants (M = 12.11, SD = 2.05) and non-AR
users (M = 10.75, SD = 2.56). The difference among the experimental groups was statistically significant
(χ2 [2, N = 155] = 47.36, p < 0.001, with ties). Dunn’s pairwise comparison with Bonferroni corrections
post hoc test shows a statistically significant result for all pairwise comparisons. We did additional
regression analysis and found that AR users who reported higher satisfaction on the app were more
likely to finish the quiz (OR = 1.65, p < 0.001). In turn, participants who finished the quiz had higher
quiz scores (B = 7.41, p < 0.001).
Table 5. Means (M), Standard Deviations (SD), Frequencies (n), Rank Sum, and Dunn’s Multiple
Nonparametric Pairwise Post Hoc Test with Bonferroni Corrections for Differences in Dependent
Variable of Learning Performance (N = 372).
Learning
M SD n Rank Sum 1. AR App 2. Non-AR App
Performance
Quiz score 10.54 2.67 155
1. AR app 8.59 2.14 49 2170.50
2. Non-AR app 10.75 2.56 53 4378.50 −4.34 ***
3. Pen & paper 12.11 2.05 53 5541.00 −6.82 *** −2.53 *
* p < 0.05. ** p < 0.01. *** p < 0.001. Note. The dependent variable: Learning performance based on quiz score.
Interviews with AR users after the experiment revealed that AR participants assumed a high
potential of AR technology in teaching and providing engaging learning tools, as was apparent in
one comment:
Definitely, I can see it could support learning, mine and others as well. It was especially nice that it
was a part of the exhibition space. I also liked the scoring. If those were utilized more, I think it would
have supported the learning more. (Interviewee 16).Appl. Sci. 2020, 10, 1392 10 of 15
High engagement in the competitive features of finding and answering all the questions was a common
theme. However, some interviewees had doubts that AR technology could actually improve learning
and performance outcomes: “I believe using augmented reality was more meaningful, but I don’t
believe it increased learning” (Interviewee 10). The previously reported results of comparing AR users’
quiz performance to the two control groups provide support for this suspicion, but the interviews still
highlight the potential entertainment value in learning, which cannot be measured by performance.
4. Discussion
In this experimental field study in the science center environment, we investigated the social,
entertaining, and educational aspects of indoor AR technology. Our findings from comparing the
AR app to the app without the AR feature and pen-and-paper condition did not confirm a positive
impact of AR technology toward perceived sociability, social communication, entertainment, or
learning performance, although we detected some evidence of engaging novelty value and increased
commenting behavior. In addition, we found that AR users experienced some discomfort in dividing
their attention between the virtual and physical world.
We did not find evidence on the positive impact of AR technology on perceived sociability. Our
findings suggest that AR app users are slightly less likely to talk to other people outside the application
compared to participants using non-AR app or pen-and-paper, and less likely to talk with unfamiliar
people compared to the latter. However, based on the descriptive analysis of comments left, read, and
replied to, AR users’ commenting activity was higher than that of the control groups. One reason for this
could be that the AR application provided easily locatable and accessible opportunities to communicate
with others through technology, which increased the amount of comments compared to non-AR app users
and pen-and-paper participants. It should be noted, however, that the commenting options between
the three groups were fundamentally different in regard to user interface and realistic commenting
opportunities with pen and paper. Considering these as qualities of the three features used in the
experiment, we found some tentative evidence that the AR feature has the potential to increase social
behavior inside the app. To conclude, we found some potential for AR to increase social behavior within
the app but did not find positive effects on social behavior outside the app or on perceived sociability.
Our results were somewhat different compared to what other researchers have argued regarding social
aspects of single-player games [15,16] and suggesting that AR has a positive impact on sociability [14].
From the entertainment perspective, applications seem to arouse less excitement and more
nervousness than the traditional pen-and-paper survey method, yet users of applications were less
tired after the exhibition. One possible explanation is the learning curve of new and unfamiliar
technology, as well as the feeling of uncertainty and not being in control. Filling out a survey and a
quiz via a smartphone application can still perhaps be quicker and less arduous than circling answers
on a paper form. Participants of the non-AR app were more satisfied with their app than AR app users.
The unfamiliarity of AR applications could contribute to app satisfaction. We found no differences
in exhibition satisfaction among the experimental groups; thus, none of the methods increased or
decreased exhibition satisfaction. In comparing AR to other conditions, we did not find the positive
effects of AR on the aspects of entertainment suggested in the literature [20,21], although a lower level
of tiredness in AR participants could imply higher engagement or ease of using the AR application.
From the perspective of learning, we considered learning performance via measuring the
participants’ quiz scores. AR users scored significantly lower compared to the control groups, despite
many AR interviewees reporting being engaged and ambitious toward the gamified quiz. Based on
the interviews, some AR users also thought it could stimulate learning. The AR app was thought to
offer novelty and meaningfulness to the learning experience, and this does not necessarily increase
learning or performance compared to other means of learning. As an additional analysis, however, we
found that those AR participants that were satisfied with the application were more likely to finish the
quiz and, in turn, performed better in the quiz. The findings show that implementing new technology
or gamification does not always enhance performance, although their effectiveness is supported byAppl. Sci. 2020, 10, 1392 11 of 15
previous research on game-based learning [24] and learning with AR or similar technologies [25–28].
Our study contributes to the research on educational uses of AR by offering valuable information from
an empirical experiment on informal learners in the context of recreation [28].
The interviews revealed that AR users saw a lot of potential for AR technology as a learning tool
for education and as a complementary feature in the science center and other attractions. However, the
interviewees saw less potential in AR for social behavior. Interview results show that AR technology
causes a strong conflict between the two different environments: the reality seen through the technology
enhanced with virtual elements and the reality shared with people around the same room. For these
AR users, the latter social environment was seen as a disruption while trying to focus on the task and
the reality seen through the AR application. Thus, the pervasive AR games pose some hedonic and
emotional challenges for the users. The findings were in line with previous research on the perceived
awkwardness of playful behavior in public places [22] and the immersive nature of games that impacts
the sense of presence [23]. Although mixed results regarding cognitive overload exist [25,27], perceived
conflict between realities using AR or similar technology has not been addressed in previous research
and should be investigated further.
4.1. Strengths and Limitations
Our study was limited to certain applications and a science center context, which should be noted
when interpreting the results. Our application was fairly simple, and some participants may have
had high expectations based on commercial applications with advanced design processes such as
Pokémon Go that has been developed by Niantic, Nintendo, and The Pokémon Company. On the other
hand, we consider that the simple design of our application was the strength of this study. It made
the AR condition more similar to other experimental conditions (i.e., app without AR feature and
pen-and-paper), which were also simple by design, mainly based on the exhibition quiz. In addition,
we were able to show the difficulties that users face when using an app for the first time. However, this
also means that our experiment was limited to one user experience at one point in time. The negative
effects could arguably disappear after people become more familiar with AR technology. For this
reason, future researchers should aim to understand how the use of AR apps develops over time and
whether AR technology has a social, entertaining, or educational impact when using the technology
for a longer period of time.
Lastly, the possible impact of the lack of something in common with others and the self-awareness
caused by the experimental nature of the situation should also be considered as conditional factors.
A science exhibition itself is not always considered a social space, and participants may have reservations
in commenting, as they are not used to this during exhibitions. It might be more natural and relevant
for users to participate outside the experimental environment, where they can leave and read comments
from people of their own social network or from people with common interests and goals, compared
to a wide and unfamiliar group of science center visitors. In that case, the social features could perhaps
be more effective in generating social interaction. Yet, by not explicitly encouraging participants
to interact but informing them on the communication facilities available, our experimental setting
allowed us to analyze whether the mere communicative facilities of AR technology (not the used
encouragement or incentive) can foster social interaction and ensured the comparability between the
different experimental conditions. The effect of different encouragement strategies would still be
worthy of future investigations.
4.2. Conclusions
Based on the field experiment, our conclusion is that an AR game does not necessarily provide
improvements to learning performance or social interaction, at least in communicating outside the
technology. Phone applications seem to cause more nervousness and less excitement but also less
tiredness than using the traditional survey method of pen and paper. Our results indicate that AR
does have entertainment value as a novel technology, but it poses some challenges for people to beAppl. Sci. 2020, 10, 1392 12 of 15
present and devoted to both realities at the same time. Thus, the results suggest that the positive
effects of augmented reality are not self-evident. On the contrary, utilizing AR technology in natural
environments can produce unexpected and even negative results. Given our findings, more field
experiments on AR technology is needed. Future research and the development of AR technology
should consider the negative emotions related to choosing between the two realities and the learning
curve of using AR technology when high performance or learning outcomes are desired.
Author Contributions: Conceptualization, N.S., A.O., M.K., M.N. and Y.X.; methodology, N.S., A.O. and M.K.;
software, M.N. and Y.X.; validation, N.S., A.O., M.K., M.N. and Y.X.; formal analysis, N.S. and A.O.; investigation,
N.S. and M.N.; resources, A.O. and Y.X.; data curation, N.S. and M.N.; writing—original draft preparation, N.S.;
writing—review and editing, N.S., A.O., M.K., M.N. and Y.X.; visualization, N.S. and M.N.; supervision, A.O.
and Y.X.; project administration, A.O. and Y.X. All authors have read and agreed to the published version of
the manuscript.
Funding: This research received no external funding.
Acknowledgments: We acknowledge the resources and support to this research provided by the Finnish Heureka
Science Centre, Aalto University, University of Helsinki, and Tampere University.
Conflicts of Interest: The authors declare no conflicts of interest.
Appl. Sci. 2020, 10, x FOR PEER REVIEW 13 of 18
Appendix A Appendix A
Figure A1. A Screenshot of the AR App Game Mode.
Figure A1. A Screenshot of the AR App Game Mode.Appl. Sci. 2020, 10, 1392 13 of 15
Appl. Sci. 2020, 10, x FOR PEER REVIEW 14 of 18
Appendix
Appendix B
B
Figure A2. A Screenshot of the Non-AR App Game Mode.
Figure B1. A Screenshot of the Non-AR App Game Mode.
Appendix C
The Interview Form
(1) What was your experience of the application?
(2) Did the experience here differ from other museum exhibition experiences you have? How?
(3) How did the application influence your behavior in the exhibition space?
(4) What kind of cell phone application would make the exhibition more interesting?
(5) Do you think you are outgoing?
(6) Do augmented reality applications suit you?
(7) Have you used mobile applications with augmented reality before?
(8) What kind of learning experience was it for you to answer the quiz?Appl. Sci. 2020, 10, 1392 14 of 15
(9) Do you think augmented reality technology had anything to do with your learning?
(10) Did you finish the quiz? Do you think augmented reality technology had anything to do with
your motivation to finish the quiz?
Appendix D
Table A1. Commenting Activity by AR Users and Non-AR Users: Frequencies of Comments Left,
Replied, and Read (N = 372).
Amount of comments left: 0 1 2 3 4 5 6 Total
1. AR app 209 15 3 2 1 1 231
2. Non-AR app 67 2 2 71
3. Pen and paper 70 70
Amount of replies made: 0 1 2 3 4 5 6< Total
1. AR app 204 17 6 2 2 231
2. Non-AR app 71 71
3. Pen and paper 70 70
Amount of comments read: 0 1 2 3 4 5 6< Total
1. AR app 117 30 30 18 17 10 9 231
References
1. Bastug, E.; Bennis, M.; Médard, M.; Debbah, M. Toward interconnected virtual reality: Opportunities,
challenges, and enablers. IEEE Commun. Mag. 2017, 55, 110–117. [CrossRef]
2. Sherman, W.R.; Craig, A.B. Understanding Virtual Reality: Interface, Application, and Design, 2nd ed.; Morgan
Kaufmann: Cambridge, MA, USA, 2018.
3. Van Dijck, J.; Poell, T. Understanding social media logic. Media Commun. 2018, 1, 2–14. [CrossRef]
4. Kim, Y.; Sohn, D.; Choi, S.M. Cultural difference in motivations for using social network sites: A comparative
study of American and Korean college students. Comput. Hum. Behav. 2011, 27, 365–372. [CrossRef]
5. Lin, K.Y.; Lu, H.P. Why people use social networking sites: An empirical study integrating network
externalities and motivation theory. Comput. Hum. Behav. 2011, 27, 1152–1161. [CrossRef]
6. Whiting, A.; Williams, D. Why people use social media: A uses and gratifications approach. Qual. Mark. Res.
Int. J. 2013, 16, 362–369. [CrossRef]
7. Ohta, Y.; Tamura, H. Mixed Reality: Merging Real and Virtual Worlds; Springer Publishing: New York, NY,
USA, 2014.
8. Speicher, M.; Hall, B.D.; Nebeling, M. What is mixed reality? In Proceedings of the 2019 CHI Conference on
Human Factors in Computing Systems, CHI ’19, Glasgow, UK, 4–9 May 2019. [CrossRef]
9. Piumsomboon, T.; Day, A.; Ens, B.; Lee, Y.; Lee, G.; Billinghurst, M. Exploring enhancements for remote mixed
reality collaboration. In Proceedings of the SA ’17 SIGGRAPH Asia 2017 Mobile Graphics & Interactive
Applications, Bangkok, Thailand, 27–30 November 2017. [CrossRef]
10. Piumsomboon, T.; Lee, G.A.; Hart, J.D.; Ens, B.; Lindeman, R.W.; Thomas, B.H.; Billinghurst, M. Mini-me:
An adaptive avatar for mixed reality remote collaboration. In Proceedings of the 2018 CHI Conference on
Human Factors in Computing Systems, CHI ’18, Montréal, QC, Canada, 21–26 April 2018. [CrossRef]
11. Gavish, N.; Gutiérrez, T.; Webel, S.; Rodríguez, J.; Peveri, M.; Bockholt, U.; Tecchia, F. Evaluating virtual
reality and augmented reality training for industrial maintenance and assembly tasks. Interact. Learn.
Environ. 2015, 23, 778–798. [CrossRef]
12. Kurilovas, E. Evaluation of quality and personalisation of VR/AR/MR learning systems. Behav. Inf. Technol.
2016, 35, 998–1007. [CrossRef]
13. Rauschnabel, P.A.; Rossmann, A.; tom Dieck, M.C. An adoption framework for mobile augmented reality
games: The case of Pokémon Go. Comput. Hum. Behav. 2017, 76, 276–286. [CrossRef]
14. Serino, M.; Cordrey, K.; McLaughlin, L.; Milanaik, R.L. Pokémon Go and augmented virtual reality games: A
cautionary commentary for parents and pediatricians. Curr. Opin. Pediatr. 2016, 28, 673–677. [CrossRef]Appl. Sci. 2020, 10, 1392 15 of 15
15. Stenros, J.; Paavilainen, J.; Mäyrä, F. Social interaction in games. Int. J. Arts Technol. 2011, 4, 342–358.
[CrossRef]
16. Mäyrä, F.; Stenros, J.; Paavilainen, J.; Kultima, A. From social play to social games and back: The emergence
and development of social network games. In New Perspectives on the Social Aspects of Digital Gaming:
Multiplayer 2; Kowert, R., Quandt, T., Eds.; Routledge: Abingdon, UK, 2017; pp. 11–32.
17. Jung, T.; tom Dieck, M.C.; Lee, H.; Chung, N. Effects of virtual reality and augmented reality on visitor
experiences in museum. In Information and Communication Technologies in Tourism; Inversini, A., Schegg, R.,
Eds.; Springer: Cham, Switzerland, 2016; pp. 621–635. [CrossRef]
18. Deterding, S. The lens of intrinsic skill atoms: A method for gameful design. Hum. Comput. Interact. 2015,
30, 294–335. [CrossRef]
19. Boyle, E.A.; Connolly, T.M.; Hainey, T.; Boyle, J.M. Engagement in digital entertainment games: A systematic
review. Comput. Hum. Behav. 2012, 28, 771–780. [CrossRef]
20. Grzegorczyk, T.; Sliwinski, R.; Kaczmarek, J. Attractiveness of augmented reality to consumers. Technol.
Anal. Strateg. 2019, 31, 1257–1269. [CrossRef]
21. Berryman, D.R. Augmented reality: A review. Med. Ref. Serv. Q. 2012, 31, 212–218. [CrossRef] [PubMed]
22. Montola, M. A ludological view on the pervasive mixed-reality game research paradigm. Pers. Ubiquitous
Comput. 2011, 15, 3–12. [CrossRef]
23. Cummings, J.J.; Bailenson, J.N. How immersive is enough? A meta-analysis of the effect of immersive
technology on user presence. Media Psychol. 2016, 19, 272–309. [CrossRef]
24. Connolly, T.M.; Boyle, E.A.; MacArthur, E.; Hainey, T.; Boyle, J.M. A systematic literature review of empirical
evidence on computer games and serious games. Comput. Educ. 2012, 59, 661–686. [CrossRef]
25. Akçayır, M.; Akçayır, G. Advantages and challenges associated with augmented reality for education: A
systematic review of the literature. Educ. Res. Rev. 2017, 20, 1–11. [CrossRef]
26. Garzón, J.; Pavón, J.; Baldiris, S. Systematic review and meta-analysis of augmented reality in educational
settings. Virtual Real. 2019, 23, 447–459. [CrossRef]
27. Wu, H.K.; Lee, S.W.Y.; Chang, H.Y.; Liang, J.C. Current status, opportunities and challenges of augmented
reality in education. Comput. Educ. 2013, 62, 41–49. [CrossRef]
28. Bacca, J.; Baldiris, S.; Fabregat, R.; Graf, S. Augmented reality trends in education: A systematic review of
research and applications. Educ. Technol. Soc. 2014, 17, 133–149.
29. Kreijns, K.; Kirschner, P.A.; Jochems, W.; Van Buuren, H. Determining sociability, social space, and social
presence in (a) synchronous collaborative groups. CyberPsychol. Behav. 2004, 7, 155–172. [CrossRef] [PubMed]
30. Kreijns, K.; Kirschner, P.A. Extending the SIPS-Model: A research framework for online collaborative
learning. In European Conference on Technology Enhanced Learning; Pammer-Schindler, V., Pérez-Sanagustín, M.,
Drachsler, H., Elferink, R., Scheffel, M., Eds.; Springer: Cham, Switzerland, 2018; pp. 277–290. [CrossRef]
31. Katz, E.; Blumler, J.G.; Gurevitch, M. Uses and gratifications research. Public Opin. Q. 1973, 37, 509–523.
[CrossRef]
32. McQuail, D. Mass Communication Theory, 5th ed.; Sage: London, UK, 2005.
33. Whelan, D.C.; Zelenski, J.M. Experimental evidence that positive moods cause sociability. Soc. Psychol. Pers.
Sci. 2012, 3, 430–437. [CrossRef]
34. Laurent, J.; Catanzaro, S.J.; Joiner, T.E., Jr.; Rudolph, K.D.; Potter, K.I.; Lambert, S.; Osborne, L.; Gathright, T. A
measure of positive and negative affect for children: Scale development and preliminary validation. Psychol.
Assess. 1999, 11, 326–338. [CrossRef]
35. Watson, D.; Clark, L. The PANAS-X: Manual for the Positive and Negative Affect Schedule-Expanded Form; The
University of Iowa: Iowa City, IA, USA, 1999. [CrossRef]
36. Dinno, A. Nonparametric pairwise multiple comparisons in independent groups using Dunn’s test. Stata J.
2015, 15, 292–300. [CrossRef]
37. Hsieh, H.F.; Shannon, S.E. Three approaches to qualitative content analysis. Qual. Health Res. 2005, 15,
1277–1288. [CrossRef]
© 2020 by the authors. Licensee MDPI, Basel, Switzerland. This article is an open access
article distributed under the terms and conditions of the Creative Commons Attribution
(CC BY) license (http://creativecommons.org/licenses/by/4.0/).You can also read