INFLUENCE OF TELEMATICS OF UBI INSURANCE ON THE MANAGEMENT OF THE FLEET OF COMPANY VEHICLES
←
→
Page content transcription
If your browser does not render page correctly, please read the page content below
The Archives of Automotive Engineering – Archiwum Motoryzacji Vol. 92, No. 2, 2021       69

     INFLUENCE OF TELEMATICS OF UBI
     INSURANCE ON THE MANAGEMENT
    OF THE FLEET OF COMPANY VEHICLES
                                                  RAFAŁ CHABA1

                                                   Abstract
The advent and development of connected technologies and the adaptation of large collections
of data are changing the face of all industries. A technological area that is gaining more and more
in the era of automation and digitization of processes is the scope of utility telematics used mainly
in the transport industry. The use of devices based on telematics technology allows for effective
management of the vehicle fleet. The information collected and processed by the algorithm makes it
possible to increase productivity, reduce costs and increase the safety of business fleets. One of the
developing global trends is the use of telematics in the insurance industry to improve the area of risk
assessment, and thus to better match the offer to a specific entity. The data flow between an insurer
and their customers is growing exponentially, making the need for big data adaptation a cornerstone
in the insurer's technological landscape. The aim of the article is to present the results of questionnaire
studies presenting the driver's assessment before and after installing telematics devices on board the
vehicle. The studies indicate the need to deal with aggressive business fleet drivers and their driving
behaviour that has an impact on incidents and traffic incidents when traversing short- and long-haul
routes. The comprehensive survey is also used to propose a solution that detects the risks posed by
unsafe driving incidents on the road, taking into account the behavioural and emotional factors of
the driver. The results of these studies will help the insurance industry to assess driving risks more
accurately and propose a personalized premium calculation solution based on driver behaviour, which
is most important for loss prevention in business fleets.

Keywords: insurance telematics; burden of losses; communication insurances; calculating the
insurance premium

                                             1. Introduction
Currently, telematics solutions are used on a larger scale in Italy, Brazil and the United
States, among others [3, 6, 7]. However, these solutions are based, inter alia, on the pre-
mium calculation and the invoicing process in motor insurance, these billing models
are very general and are not optimally suited to end users [7]. In Poland, the insur-
ance industry has great difficulty in properly assessing insurance risks in business fleets,
but so far few insurers want to base the calculation of insurance premium on the basis

	Globtrak Polska Sp. z o. o ul. Wincentego Witosa 65/2 25-561 Kielce, Poland; e-mail: r.chaba@globtrak.pl
1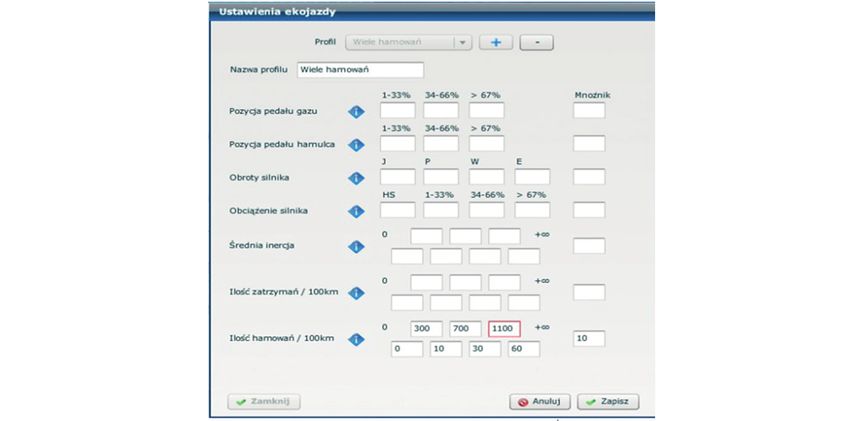
70              The Archives of Automotive Engineering – Archiwum Motoryzacji Vol. 92, No. 2, 2021

of telematics [11, 13]. Generating innovation and creating knowledge as the key assets
of the organization are fostered by: rapid development of technology and creation of
system solutions adapted to the market [8]. The basis of knowledge, interpreted in
terms of resources and skilful analysis of the processes taking place, is the experience,
qualifications of members of the organization and access to the appropriate data infra-
structure [9, 10, 11]. Building an appropriate resource allocation structure to transform
knowledge into competences is configuration, optimization and integration of strate-
gic areas of the organization's functioning [11,1 3]. In the global industry, we are observ-
ing a rapid technological development, using the potential of machines and devices
connected by the Internet network [14]. The aim of the article is to indicate the impor-
tance of dynamic abilities in the processes of replication and imitation of knowledge in
the process of the impact of innovation on the development of insurance telematics [2,
4, 20]. The starting point for creating solutions aimed at reducing the insurer's risk level
is developing technological solutions aimed at introducing changes in the insurance
market. The use of the latest telematic technologies revolutionizes the area of motor
insurance of business fleets, allowing for a much more precise matching of insurance
premiums to insurance risks [18, 34]. This involves the possibility of using additional ser-
vices to increase customer loyalty and improve safety by reducing the number of acci-
dents and providing faster assistance in the event of an accident.

The progress of information technology - information and communications technol-
ogy (ICT) - has made it possible for users to collect and analyze information related
to the driver and his driving style as well as information related to the vehicle and the
road. The most frequently collected information about the vehicle in telematics sys-
tems includes speed, location, fuel consumption level, while the information about the
driver includes: speeding and braking intensity. In the literature on the subject, there
are many attempts to use telematics systems in road transport. In the works [25, 28] the
telematics system was used to detect dangerous turns. The authors present solutions
in which the system for detecting dangerous turns is based on statistics on the con-
ditions of no slip and rollover. In this system, the input variables are estimated using
the Kalman filter used for position, velocity and position measurements in the Global
Navigation Satellite System (GNSS). However, the works [16, 17, 24] focused on the
development of an insurance system based on the driver’s behaviour. The authors use
information about the driver and the vehicle on the basis of diagnostic data from the
system in the car. The data is then delivered to the insurer and insurance premiums are
calculated based on their results. Profiling driver behaviour and designing appropri-
ate pricing models is essential for insurance companies to generate profits and attract
customers (drivers). Existing approaches rely on static demographic information such
as age or vehicle model. Therefore, they are ineffective in providing accurate risk fore-
casts over time and in applying the objective of appropriate insurance pricing [29, 33].
The works [25, 32] present a system for monitoring the behaviour of a driver using
a smartphone. These systems are based on modern smartphones equipped with GPS
and acceleration sensors. Thanks to them the information about the driver's behaviour
on the road is collected.
The Archives of Automotive Engineering – Archiwum Motoryzacji Vol. 92, No. 2, 2021   71

   2. The importance of telematics in the modern transport
One of the main elements influencing the effectiveness and efficiency of enterprises is
the selection of solutions adequate to the overriding economic goals of the organiza-
tion. In spite of very large expenditure of time, money and commitment to managing
a fleet of business vehicles, they are still quite often unsuccessful [11, 21]. These fail-
ures cause delays, changes in the initial assumptions or the complete abandonment of
their implementation. Among the many different techniques and methods available,
approaches where traditional and agile environments coexist [34, 11] are gaining popu-
larity. Telematics are technological solutions that enable the tracking of the parameters
connected to driving and driving style used by a given driver, which provides important
data for risk assessment. Telematics systems play an invaluable role in the management
of logistics processes. Based on modern tools and software, they improve electronic
communication, information processing, data transmission and monitoring of activ-
ities. Thanks to this, they guarantee the improvement of communication between
dispatchers, operators and drivers, and general monitoring of vehicle safety [26, 34].

Currently, the main source of collected data is car diagnostics, collected by means
of a device installed in the vehicle connected to the OBD socket or an application
installed in a mobile phone [18, 22]. The set of data operated on the basis of raw data
collected by telemetry devices may differ significantly depending on the business
requirements of an insurance company [18, 22, 23]. Table 1 presents the most frequently
used data.

Tab. 1. Data utilized in the telemetric systems [18, 22, 23]

   Utilized data                                         Description
 All travels list     List of all travels of the vehicle with the detailed travel map
 Travel time          Time of every individual travel
 Travel distance      Distance of every individual travel
 Travel start time    Start time of every individual travel
 Travel end time      End time of every individual travel
 Average speed        Average speed of every individual travel
 Maximum speed        Maximum speed of every individual travel
 Driving style        Combined result based on 2 levels of difficult brakes, acceleration and turns
 Travel map           Detailed travel map for every travel
 Overall duration     Overall duration of all registered travels
 Overall distance     Overall distance for all registered vehicles
 Day time             Everyday hours in which the vehicle is driven
 Long travels         Percentage of travels without stops and with duration time exceeding the
                      threshold set by the Insurance Company
 Idle time            Overall idle time spent in the traffic without movement (traffic jams)
72 The Archives of Automotive Engineering – Archiwum Motoryzacji Vol. 92, No. 2, 2021
The use of utility telematics makes it possible to locate the vehicle, creating its inter-
active map, and also generates road and on-board reports, taking into account fuel
status, route travelled and kilometres. Detailed information about the car's journey is
useful for optimizing routes and the entire logistics strategy [15, 18, 30]. All this can
result in more efficient transport of goods and fewer unnecessary kilometres trav-
elled. In addition, tracking individual vehicles can play an invaluable role in ensuring
the transport’s safety [15, 27]. There are many reasons for the use of telematics in the
transport industry. It allows not only to optimize the use of the existing infrastruc-
ture and rolling stock, but also to increase the efficiency and competitiveness of the
company and improve the effectiveness of cooperation of all partners in the transport
industry. Intelligent telematics systems contribute to the improvement of traffic safety
and environmental protection [4]. The telematics of transport systems uses various
devices and applications, the Internet, radio communication systems or geographic
databases, thanks to which drivers receive up-to-date information about the situation
on the roads or obstacles awaiting the vehicle. This helps you plan your trip better and
prevents accidents.
There are free programs available on the market that constantly collect data about the
driver. An example of such a device is the GPS module by Mobile Data in South Africa.
The GPS module is permanently installed in the car, thanks to which it permanently
records all data such as position, time, speed and driver's behaviour. Then the system
transfers the data to the company's server, which is accessed by the driver via the Inter-
net, but also by third parties [18, 22]. A similar system is offered by the Spanish company
APFRE, which offers the installation of a black box in the car. The black box records the
kilometres travelled, the type of roads used, the length of the journey, time of day,
average speed and night driving. After processing the data, this system performs the
driver's analysis and then adjusts the appropriate insurance amount [2, 20]. Here also
something can be written about the GLOBTRAK system.
3. Insurance telematics
The telematics of transport systems opens up a number of unprecedented opportuni-
ties before the insurance market. The ability to use large data sets and their processing,
as well as the proper placement of technologies is a challenge for modern enter-
prises, but also an opportunity to constantly increase profitability. What benefits can
telematics solutions bring in the insurance sector? You should start with how the insur-
ance company calculates the insurance premium amount.
Vehicle use insurance is the latest innovation offered by car insurers, which closely aligns
driver behaviour with car insurance rates. The driving behaviour of drivers is tracked
and monitored using odometer readings or telemetry devices in the car. Telemetry
devices are usually self-installed at a dedicated vehicle port or integrated with original
equipment installed by car manufacturers [1, 5]. Table 2 presents usage based insurance
solutions that have been implemented around the world [1, 5, 31]The Archives of Automotive Engineering – Archiwum Motoryzacji Vol. 92, No. 2, 2021 73
Tab. 2. Usage based insurance solutions implemented around the world [1, 5, 31]
Insurance Technological
Country Programme name Data transmission
company platform
AIOI Japan Pay as you drive G-book Mobile data service
AVIVA Canada Autograph OBD Universal serial bus
AXA Italy Autometrica GPS-based Mobile data service
Protezione
Generali Italy GPS-based Mobile data service
satelitare
AXA Events data Data downloaded from
Switzerland Crash recorder
Winterthur recorder the events recorder
MAPFRE Spain YCAR GPS-based Mobile data service
RSA Insurance More Than Green
The UK OBD Mobile data service
Group Wheels Insurance
Uniqa Austria Safeline GPS-based Mobile data service
WGV Germany Young & Safe GPS-based Mobile data service
Based on the data obtained from the policyholder, insurers estimate the potential
risk of damage and, on the basis of the developed analyzes, adjust the premium to
the situation of a given customer. Such a solution leaves a lot of room for abuse by
customers, the declarations made are not always truthful, the information is usually
verified only after the damage occurs [3, 4, 28]. Telematics can solve this problem,
because the data obtained with the use of an appropriate system will enable ongoing
monitoring of parameters and driving style of a given driver, which will translate into
adjusting the premium amount to their individual situation [12, 19, 27]. Motor insur-
ance has entered its maturity phase. Fierce competition and less and less differen-
tiation of the offer lead to significant drops in margins, and hence in the income of
insurers. It is especially felt in less developed markets, such as, for example, Poland.
Introducing UBI tariffs can be the solution to this problem. It is a relatively new con-
cept based on the assumption that the insurance premium should be adjusted as
much as possible to the risk related to the way of using a specific protected vehi-
cle. In the case of traditional tariffs, the premium depends on the set of variables
describing both the vehicle, its use and the users themselves [11, 31].
Such parameters include, for example, the age of drivers, their experience, type
of vehicle, engine power, etc. Such a variable ceases to fulfil its task as a reliable
characteristic of the way the vehicle is used, and the correct differentiation of the
premium between the more or less risky insured becomes impossible to achieve.
This, in turn, may lead to the phenomenon of negative selection [21, 25, 32]. In the
case of UBI, when calculating insurance premiums, more precise and personalized
information on the actual use of the vehicle is used, which can reduce premiums
for drivers using the vehicle safely or to a small extent. The implementation of such
a solution, which not only can change the insurance paradigm and becomes a nov-
elty on the Polish market, will probably involve considerable effort. The follow-
ing parameters of the data related to the speed used, the mileage of the vehicle,74 The Archives of Automotive Engineering – Archiwum Motoryzacji Vol. 92, No. 2, 2021
indicating abrupt braking and making sudden turns, should be assessed. It is
necessary for a detailed analysis of the behaviour of drivers in various road situations
in order to define indicators enabling the characterization of drivers' behaviour in
terms of various aspects of car use in terms of communication risks. The collection
of such data during research will allow for:
• identification of the driver using the vehicle, regardless of which vehicle they are
driving within the given business fleet,
• determination of the way of driving in specific road conditions (traffic, weather,
etc.),
• collecting and analyzing data on the way the vehicle is used (CAN bus, accelera-
tion sensor),
• collection and analysis of visual data from the vehicle's surroundings (camera),
• collecting and analyzing data on insurance risks.
4. Methodology of research of UBI Globtrak
Each category range is counted as a percentage of the total category share.
If depressing the gas pedal (1-100% position) is 100%. The individual ranges present
the percentage share of a given parameter. For a typical drive, most of the accel-
erator pedal time will be in the first range (1-33)%, much less in the second range
and the third range will have a very low proportion. For example, 60% for (1-33)%,
30% for (34-66)%, and 10% for> = 67%. The rating factors give a clear weight to the
appropriate ranges. The sum of all coefficients in a given category must be equal
to 100. Giving a high coefficient to the gas pedal in the first range creates a posi-
tive grade (the more points the better), giving a high coefficient in the last range
creates a negative grade (the more points the worse). The brake pedal position is
only available on trucks (not all). The evaluation is identical to that for the acceler-
ator pedal. The engine RPM is configured depending on the type of vehicle and the
type of engine. The ranges define the idle speed (above 0, e.g. up to 1000, work
1000-2500, high 2500-3500, extreme above 3500 – example for a passenger car with
a diesel engine). Assessment factors are as for the gas and brake pedal. Engine load
is the category available only on trucks. Categories – HS (engine braking) – the
vehicle is in gear and the gas pedal is released (engine load 0% – positive behavior),
the next three ranges are (1-33)%, (34-66)%,> = 67%. Assessment factors as for the
accelerator and brake pedals. Average Inertia is the average time between releas-
ing the accelerator pedal and depressing the brake pedal. The longer the time, the
more the driver anticipates the traffic situation (he judges the traffic lights or other
road users ahead). The ranges of the inertia time (in seconds) are configurable by
the user. Different ranges of inertia will be positive for vehicles mostly running in
built-up areas, and different for vehicles running outside of it. It is difficult to clearly
define which ranges and their percentage share are positive and which are negative,
but when comparing different drivers, one can quickly see which inertia times are
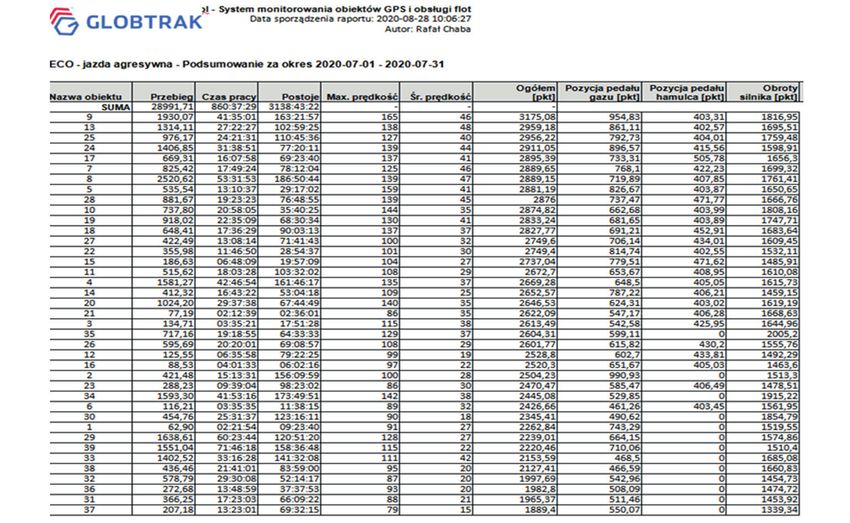
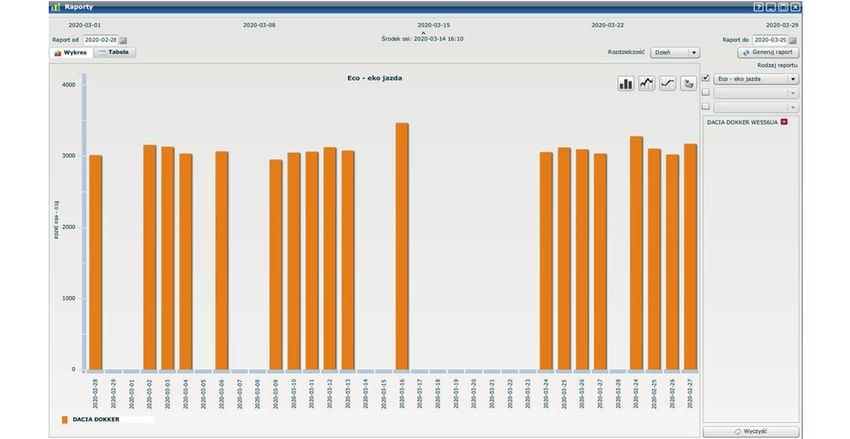
much lower than the others (they drive aggressively).The Archives of Automotive Engineering – Archiwum Motoryzacji Vol. 92, No. 2, 2021 75 Number of stops up to 0 km/h – this parameter is particularly important in the case of trucks. Stopping a set that weights, for example, 30 tons to 0 km/h, causes the tires to “stick” to the asphalt. Moving it from a standstill consumes a lot of fuel, com- pared to the acceleration of a rolling vehicle even at minimum speed. As in the case of inertia, the number of stops depends on the specificity of the traffic in which the vehicle is moving, so the ranges of the number of stops up to 0 per 100km are defined by the user. As in the case of the mean inertia, it is not possible to clearly indicate which range of the number of stops is positive and which is negative. How- ever, when comparing many drivers, you can immediately see those who stop the vehicle more often than others. Number of brakes - this is the number of passes from releasing the gas pedal to the brake pedal. The number of times the brake pedal is depressed during one brake application does not count. Anticipating the traffic situation and avoiding braking is a positive factor in eco-driving. Fewer brak- ing means a smoother road ride and less fuel is used to accelerate the vehicle. The multiplier parameter allows you to determine the weight of individual categories, if one is to be scored higher than the other. It also allows you to increase fractional values in categories where the share of a given range is negligible – e.g. 0.2% of the share of a category with a factor of 100 and a multiplier of 100 will give a value of 20. The evaluation of a given eco-driving profile is as follows: a =% 1 of the range * factor + % 2 of the range * coefficient +% 3. The ranges are presented in Figure 1 (Eco driving module view window). The list of parameters in a specific time space is pre- sented in Figure 2. Eco-driving report. 4.1. Positive / negative evaluation The driver's driving can be assessed both positively (score high on drivers driving economically) and negatively (score high on drivers driving aggressively). In the positive evaluation profile, points should be given in a given category in the desired ranges and zero in the undesirable ranges – e.g. idle 20, work 80, high and extreme 0. Then the driver will get the most points for driving in the "work" speed range. In the negative evaluation profile, points should be awarded in a given category in the undesirable ranges and zero in the desired ranges – e.g. in high 30, extreme 70, idle and 0 work. Then the driver will get the most points for driving in the "extreme" speed range. The driver's driving evaluation is presented in Figure 3. Data of driver’s driving evaluation from the research period 2020-07-01- 2020-07-31
76   The Archives of Automotive Engineering – Archiwum Motoryzacji Vol. 92, No. 2, 2021

                      Fig. 1. Window of eco-driving module

                          Fig. 2. Report from eco-driving
The Archives of Automotive Engineering – Archiwum Motoryzacji Vol. 92, No. 2, 2021 77
Fig 3. Exemplary data of driver’s driving evaluation from the research period
2020-07-01–2020-07-31
Main goals of the survey evaluation research:
• Analyzing the driving style of the driver based on the driver's own evaluation, before
and after installing telematics systems,
• Analyzing the driver's awareness in the area of driving behavior such as rapid accel-
eration, rapid braking after installing telematics systems,
• Analyzing the concept of calculating the insurance premium dedicated to the driver
and not to the vehicle, taking into account the possibility of using additional equip-
ment in the vehicle.
Methods and techniques for analysis and evaluation:
• statistical analysis of quantitative data (driver);
• qualitative data analysis (manager);
• comparative analyzes of groups of drivers and fleet managers.
The research work included the application of the empirical research method on a rep-
resentative group of company fleet users. This part of the work focused on the initial
questionnaire assessment of drivers and fleet managers with the task of determining
whether it is possible to use telematics systems, so that the insurance risk dedicated
to the driver and not to the vehicle was calculated. The driver questionnaire consisted
of 10 detailed questions. They have been grouped into thematic blocks:78 The Archives of Automotive Engineering – Archiwum Motoryzacji Vol. 92, No. 2, 2021
1. Driver's self-assessment of the driving style with corporate awareness, the use
of data on motor damage in company fleets, collecting information from drivers
and company fleet managers on motor damage, data sources on motor damage
in company fleets;
• accuracy and purposefulness – linking the objectives of the concept of calculat-
ing the policy dedicated to the driver instead of the one dedicated to the vehicle
with wider problems of transport environments, the appropriateness of using
the developed driver profiles to solve a given problem;
• effectiveness – implementation of the acquired knowledge on the type of
insurance risks, influencing the building of mentality in the area of safe driving
of a company vehicle, stimulating innovation based on strategic technological
solutions;
• behavioural added value – shaping the value of target groups, cultivating a "safe
driving / accident-free driving culture".
2. Evaluation research was carried out in several stages corresponding to the following
research tasks:
• Developing evaluation criteria for the evaluation study after the installation
of telematics systems
• Conducting another survey among drivers and fleet managers
• Developing the results of the survey questionnaire.
• Verifying and supplementing data through direct contact with drivers and fleet
managers (in-depth interviews, correspondence).
• Organizing and verifying the collected data and preparing a quarterly report.
The research was conducted between January and September 2020 in a paper form of
a questionnaire with a request to fill in the questionnaire of a person using a company
vehicle. The paper version of the questionnaire was distributed at the workplace. Each
of the respondents completed the questionnaire independently, i.e. without the inter-
viewer asking questions.
4.2. Research sample and its characteristics
Exactly 200 people took part in the study. The respondents were divided into five age
groups: from 20 to 24 (students), from 25 to 30, from 30 to 38, from 39 to 49 and over 50.
The aim of the study was to determine the type of communication risks that most often
cause damage to road traffic and the payment of benefits from third party liability and
motor insurance, type of vehicle where the damage was done and where the damage
was caused. This part of the work focused on the initial questionnaire assessment of
drivers and fleet managers with the task of determining whether it is possible to use
telematics systems, so that the insurance risk dedicated to the driver and not to the
vehicle was calculated. Presentation of research results (table 3).The Archives of Automotive Engineering – Archiwum Motoryzacji Vol. 92, No. 2, 2021 79
Tab. 3. Presentation of research results – Usage Based Insurance
Survey results
Vehicle type that Place of damage
Driver’s age Results Results Results
caused the damage occuring
22.00% town 18.00%
motorcycle
out of town 82.00%
58.00% town 53.00%
personal car
from 20 to 24 out of town 47.00%
20.00%
years old 13.00% town 15.00%
heavy-loaded truck
out of town 85.00%
7.00% town 79.00%
bus
out of town 21.00%
10.00% town 24.00%
motorcycle
out of town 76.00%
49.00% town 64.00%
personal car
from 25 to 30 out of town 36.00%
18.00%
years old 19.00% town 42.00%
heavy-loaded truck
out of town 58.00%
22.00% town 81.00%
bus
out of town 11.00%
24.00% town 16.00%
motorcycle
out of town 84.00%
35.00% town 58.00%
personal car
from 30 to 38 out of town 42.00%
32.00%
years old 32.00% town 44.00%
heavy-loaded truck
out of town 56.00%
9.00% town 92.00%
bus
out of town 8.00%
motorcycle 17.00% town 14.00%
out of town 86.00%
personal car 45.00% town 69.00%
from 39 to 49 out of town 31.00%
19.00%
years old heavy-loaded truck 18.00% town 32.00%
out of town 68.00%
bus 20.00% town 88.00%
out of town 12.00%
6.00% town 8.00%
motorcycle
out of town 92.00%
68.00% town 71.00%
personal car
and over 50 out of town 29.00%
11.00%
years old 19.00% town 27.00%
heavy-loaded truck
out of town 73.00%
7.00% town 79.00%
bus
out of town 21.00%80 The Archives of Automotive Engineering – Archiwum Motoryzacji Vol. 92, No. 2, 2021
5. Summary
Safety is the key value of Globtrak Polska. we know how important it is to implement
innovative solutions. We create intelligent telematics systems that detect users of the
space around vehicles. eliminate blind spots. warn the driver of possible threats.
improve the visibility and maneuverability of the vehicle. and enable safe planning and
supervision of work for dispatchers and fleet managers. Globtrak systems work in urban
spaces around the world on a daily basis. minimizing road risks and improving work
processes. When observing international trends. we keep in mind the horizontal prin-
ciple of equity. After conducting detailed analyzes. we can see that there is currently no
uniform standard for the use of telematics in vehicle insurance. neither in terms of the
data used. nor in the methods of their transmission and algorithms determining their
impact on the insurance premium. Entrepreneurs. individual customers and insurance
companies will benefit from telematics-based insurance. Telematics gives a chance to
estimate the damage caused by accidents more accurately. assess the driver's driving
style while estimating and calculating premiums. which protects insurance companies
from the risk of extortion and fraud. Properly obtained and analyzed data on the driv-
ing style of the insured is an integral part of the impact of the amount of the insurance
premium in relation to the risks involved.
6. Acknowledge
The research was carried out as part of the Innovative system research project support-
ing the motor vehicle insurance risk assessment dedicated to UBI (Usage Based Insur-
ance) No. POIR.04.01.04 00 0004/19 00 financed by the National Centre for Research
and Development.
7. References
[1]. Aarts L., Schagen I.: Driving speed and the risk of road crashes: A review. Accident Analysis & Prevention.
2006, 38(2), 215–224, DOI: 10.1016/j.aap.2005.07.004.
[2]. Aioi Nissay Dowa Insurance, (in): https://aioi-usa.com/ (accessed on 02.05.2021).
[3]. Aldahmash A., Gravell A., Howard Y.: Using Factor Analysis to Study the Critical Success Factors of Agile
Software Development. Journal of Software. 2017, 12, 957–963, DOI:10.17706/JSW.12.12.957-963.
[4]. AXA Winterthur. Crash Recorder. 2014, (in): https://www.axa-winterthur.ch (accessed on 02.05.2021).
[5]. Bian Y., Yang C., Zhao J.L., Liang L.: Good drivers pay less: A study of usage-based vehicle insurance models.
Transportation Research Part A: Policy and Practice. 2018, 107(C), 20–34, DOI: 10.1016/j.tra.2017.10.018.
[6]. Bukłaha E.; Juchniewicz M.: Kluczowe wyzwania i bariery oraz trendy w zarządzaniu projektami z punk-
tu widzenia projektów realizowanych w Polsce. Przegląd Organizacji. 2019, 3, 14–20, DOI: 10.33141/
po.2019.03.03.
[7]. Carroll C.F.: IT Success and Failure: The Standish Group CHAOS Report Success Factors. 2013. http://www.
cafe-encounter.net/p1183/it-success-and-failure-the-chaos-report-factors (access date: 15.02.2020).
[8]. CERF Reports 40768. Independent Research Assessment of Project Management Factors Affecting
Department of Energy Project Success: Final Report. Office of Engineering and Construction Management.
U.S. Department of Energy. Prepared for the U.S. Department of Energy by the Civil Engineering Research
Foundation. 2004.The Archives of Automotive Engineering – Archiwum Motoryzacji Vol. 92, No. 2, 2021 81
[9]. Chan A.P.C., Chan A.P.L.: Key performance indicators for measuring construction success. Benchmarking:
An International Journal. 2004, 11(2), 203–221, DOI: 10.1108/ 14635770410532624.
[10]. Chow T., Cao D.B.: A Survey Study of Critical Success Factors in Agile Software Projects. Journal of Systems
and Software. 2008, 81(6), 961–971, DOI:10.1016/j.jss.2007.08.020.
[11]. Chwastyk P., Kołosowski M.: Estimating the Cost of the New Product in Development Process. Procedia
Engineering. 2014, 69, 351–360, DOI: 10.1016/j.proeng.2014.02.243.
[12]. Cooke-Davies T.: The “real” success factors on projects. International Journal of Project Management. 2002,
20(3), 185–190, DOI: 10.1016/S0263-7863(01)00067-9.
[13]. Davis K.: Different stakeholder groups and their perceptions of project success. International Journal of
Project Management. 2014, 32(2), 189–201, DOI:10.1016/j.ijproman.2013.02.006.
[14]. de Wit A.: Measurement of project success. International Journal of Project Management. 1988, 6(3), 164–170,
DOI: 10.1016/0263-7863(88)90043-9.
[15]. Desyllas P., Sako M.: Profiting from business model innovation: Evidence from Pay-As-You-Drive auto insur-
ance. Research Policy. 2013, 42(1), 101–116, DOI: 10.1016/j.respol.2012.05.008.
[16]. Gilenko E.V., Mironova E.A., Spagnolo B.: Modern claim frequency and claim severity models: An applica-
tion to the Russian motor own damage insurance market. Cogent Economics & Finance. 2017, 5(1), DOI:
10.1080/23322039.2017.1311097.
[17]. He B., Zhang D., Liu S., Liu H., Han D., Ni L.M.: Profiling Driver Behavior for Personalized Insurance Pricing and
Maximal Profit. IEEE International Conference on Big Data. 2018, 1387–1396, DOI: 10.1109/BigData.2018.8622491.
[18]. Husnjak S., Peraković D., Forenbacher I., Mumdziev M.: Telematics System in Usage Based Motor Insurance.
Procedia Engineering. 2015, 100, 816–825, DOI: 10.1016/j.proeng.2015.01.436.
[19]. Husnjak S., Perakovic D., Jovovic I.: Possibilities of Using Speech Recognition Systems of Smart Terminal
Devices in Traffic Environment. Procedia Engineering. 2014, 69, 778–787, DOI: 10.1016/j.proeng.2014.03.054.
[20]. Introducing „Pay How You Drive” (PHYD) Insurance. Insurance that rewards safe driving. Jul 2016. (in): https://
www.slideshare.net/MaxTaffel/ey-pay-how-you-drive (accessed on 02.05.2021).
[21]. Ippisch T.: Telematics Data in Motor Insurance: Creating Value by Understanding the Impact of Accidents
on Vehicle Use. Dissertation of the University of St. Gallen Graduate School of Business Administration.
Economics. Law. and Social Sciences (HSG) to obtain the title of Doctor Oeconomiae. Lulu Enterprises. Inc.
(USA). 2010.
[22]. Jin W., Deng Y., Jiang H., Xie Q., Shen W., Han W.: Latent class analysis of accident risks in usage-based insur-
ance: Evidence from Beijing. Accident Analysis & Prevention. 2018, 115, 79–88, DOI: 10.1016/j.aap.2018.02.023.
[23]. Kongmuang P., Thawesaengskulthai N.: Improvement of Telematics Solution for Motor Insurance in Thailand
by 5D Innovation Development Process. IEEE 6th International Conference on Industrial Engineering and
Applications. 2019, 6–11, DOI: 10.1109/IEA.2019.8715152.
[24]. Kumar R.: Insurance Telematics: Risk Assessment of Connected Vehicles. IEEE Transportation Electrification
Conference. 2019, 1–4, DOI: 10.1109/ITEC-India48457.2019.ITECINDIA2019-138.
[25]. Kuryłowicz Ł.: Usage-Based Insurance jako instrument przywracania równowagi na polskim rynku ubez-
pieczeń komunikacyjnych. (Usage-Based Insurance as an instrument to restore the balance on the Polish
motor insurance market). Acta Universitatis Lodziensis. Folia Oeconomica. 2018, 1(333), 93–110, DOI:
10.18778/0208-6018.333.07.
[26]. Peraković D., Husnjak S., Forenbacher I.: The Market Potential Of M2M Communications For Telecommunications
Operators. Conference on Traffic and Transport Engineering. Belgrade. 2012, 211–218.
[27]. Rejikumar G.: A pre-launch exploration of customer acceptance of usage based vehicle insurance policy. IIMB
Management Review. 2013, 25(1), 19–27, DOI: 10.1016/j.iimb.2012.11.002.
[28]. Shaikh M.K., Palaniappan S., Khodadadi T., Khurram M., Khan M.H., Juzer H.: Insurematic: Gernalized framework
for Insurance company to Automate Insurance process. International Conference on Information Science
and Communication Technology. 2020, 1–4, DOI: 10.1109/ICISCT49550.2020.9080038.
[29]. Siami M., Naderpour M., Lu J.: A Mobile Telematics Pattern Recognition Framework for Driving Behavior
Extraction. IEEE Transactions on Intelligent Transportation Systems. 2021, 22(3), 1459–1472, DOI: 10.1109/
TITS.2020.2971214.
[30]. Telematics Usage-Based Insurance. (in): https://content.naic.org/cipr_topics/topic_telematicsusagebased_
insurance.htm (accessed on 02.05.2021).82 The Archives of Automotive Engineering – Archiwum Motoryzacji Vol. 92, No. 2, 2021
[31]. Tselentis D.I., Yannis G., Vlahogianni E.I.: Innovative Insurance Schemes: Pay as/how You Drive. Transportation
Research Procedia. 2016, 14, 362–371, DOI: 10.1016/j.trpro.2016.05.088.
[32]. Vyas J., Das D., Das S.K.: Vehicular Edge Computing Based Driver Recommendation System Using Federated
Learning. IEEE 17th International Conference on Mobile Ad Hoc and Sensor Systems. 2020, 675–683, DOI:
10.1109/MASS50613.2020.00087.
[33]. Yoon D., Choi J., Kim H., Kim J.: Future Automotive Insurance System based on Telematics Technology.
10th International Conference on Advanced Communication Technology. 2008, 679–681, DOI: 10.1109/
ICACT.2008.4493851.
[34]. Zhuo Q.R., Huang Y.Z.: Investigation on Consumers' Acceptance of Usage Based Insurance with Internet
of Vehicles. IEEE Eurasia Conference on IOT. Communication and Engineering. 2019, 331–334, DOI: 10.1109/
ECICE47484.2019.8942801.You can also read