Bundibugyo District Hazard, Risk and Vulnerability profi le 2016 - NECOC
←
→
Page content transcription
If your browser does not render page correctly, please read the page content below
Bundibugyo District
Hazard, Risk and Vulnerability profile

                2016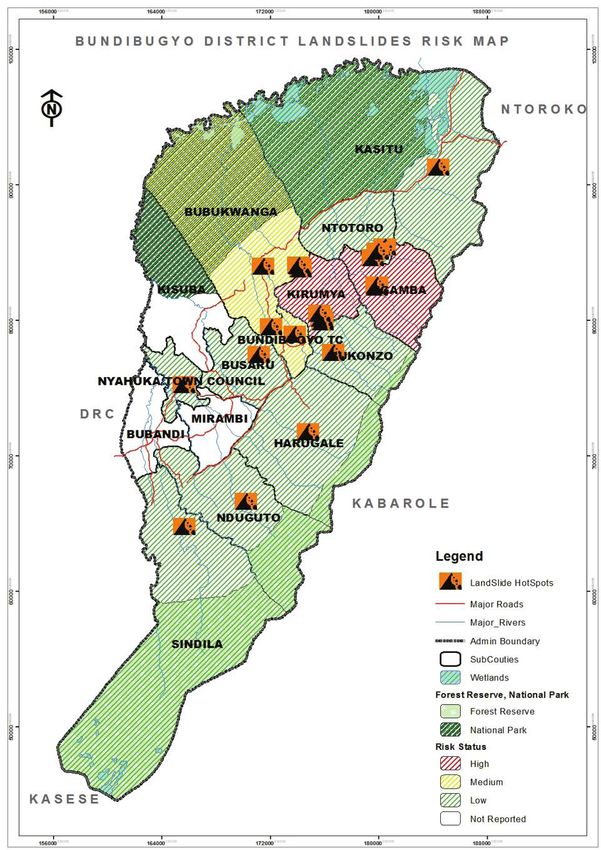
Acknowledgment

On behalf of office of the Prime Minister, I wish to express my sincere appreciation to all of
the key stakeholders who provided their valuable inputs and support to this Multi-Hazard,
Risk and Vulnerability mapping exercise that led to the production of comprehensive District
Hazard, Risk and Vulnerability (HRV) profiles.

I extend my sincere thanks to the Department of Relief, Disaster Preparedness and
Management, under the leadership of the Acting Commissioner, Ms. Rose Nakabugo, for
the oversight and management of the entire exercise.

The HRV assessment team was led by Mr. Kirungi Raymond Disaster Preparedness Officer
and the team of consultants (GIS/DRR specialists); Mr. Emmanuel M.O.Matua; Mr. Festus
Kakungulu Mukasa; Mr. Ambrose Buyinza, and Mr. Benon Nabaasa Baguma who provided
technical support.

Our gratitude goes to UNDP for providing funds to support the Hazard, Risk and Vulnerability
Mapping. The team comprised of Mr. Jose Neil A.C Manzano –Disaster Risk Management
Advisor; Mr. Gilbert Anguyo - Disaster Risk Reduction Analyst, and Mr. Sidney Tupper –
Climate Risk Management Specialist.

My appreciation also goes to Bundibugyo District Team.

The entire body of stakeholders who in one way or another yielded valuable ideas and time
to support the completion of this exercise.

Hon. Hilary O. Onek
Minister for Relief, Disaster Preparedness and Refugees

                                             Bundibugyo District Hazard, Risk, and Vulnerability Profile   i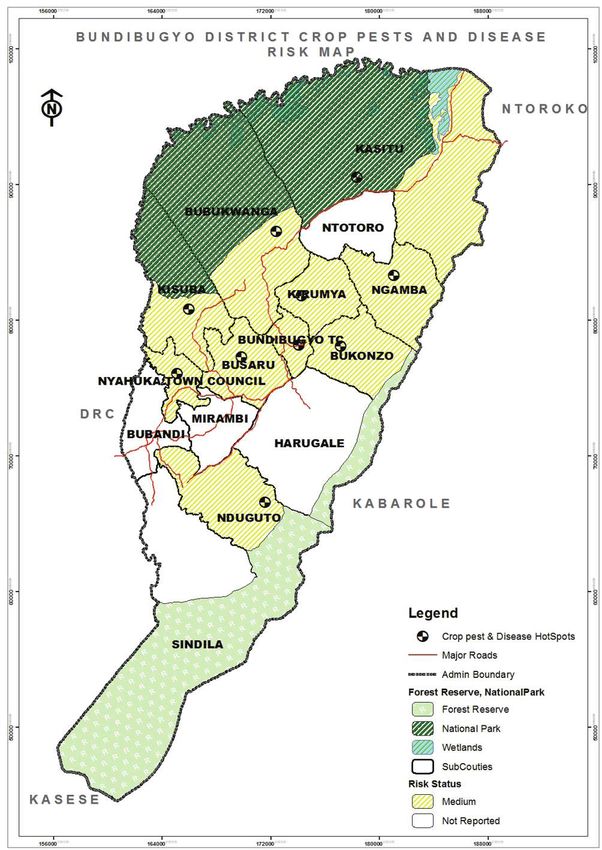
Contents

Acknowledgment .......................................................................................................... i
Contents ...................................................................................................................... ii
List of Figures .............................................................................................................. ii
List of Tables................................................................................................................ ii
Acronyms.................................................................................................................... iii
Executive Summary.................................................................................................... iv

Introduction ..................................................................................................................1
Objectives ....................................................................................................................1
Methodology ................................................................................................................1
Overview of the District................................................................................................4
Location .......................................................................................................................4
Overview......................................................................................................................4
Demographics .............................................................................................................5
Livelihoods...................................................................................................................6
Hazards .......................................................................................................................7
Hazards and Risks Assessments ..............................................................................10
Vulnerability ...............................................................................................................26
Conclusions ...............................................................................................................29
Definition of Terms .....................................................................................................30

List of Figures
Figure 1: Landslide risk Map .....................................................................................10
Figure 2: Crop pests and diseases risk Map .............................................................12
Figure 3: Flood risk Map ............................................................................................14
Figure 4: Environmental degradation Map ................................................................16
Figure 5: Internal conflict risk Map.............................................................................18
Figure 6: Human epidemic risk Map ..........................................................................20
Figure 7: Bush fire risk Map.......................................................................................21
Figure 8: Earthquake risk Map ..................................................................................22
Figure 9: Pest and animal disease risk Map..............................................................24
Figure 10: Vulnerability Map ......................................................................................27

List of Tables
Table 1: Projected 2012 Population of Bundibugyo District by Sub-county .................5
Table 2: Major Tribes and Languages Spoken in Bundibugyo District ........................5
Table 3: Bundibugyo District Main Livelihoods, by Sub-county and Town Council ......6
Table 4: Hazard Status ................................................................................................7
Table 5: Summary of Hazards by Sub-county .............................................................8
Table 6: Ranking of hazards ........................................................................................8
Table 7: Hazard risk assessment.................................................................................9
Table 8: Risk and vulnerability assessment ...............................................................26

ii     Bundibugyo District Hazard, Risk, and Vulnerability Profile
ACRONYMS

CBPP       Contagious Bovine Pleuropneumonia
CFR        Central Forest Reserve
CICO       Chongqing International Construction Corporation
DDMC       District Disaster Management Committee
DRC        Democratic Republic of Congo
DRM        Disaster Risk Management
GIS        Geographic Information System
GPS        Global Positioning System
NGOS       Non-Government Organization
OPM        Office of the Prime Minister
TC         Town Council
UNDP       United Nations Development Programme

                                        Bundibugyo District Hazard, Risk, and Vulnerability Profile   iii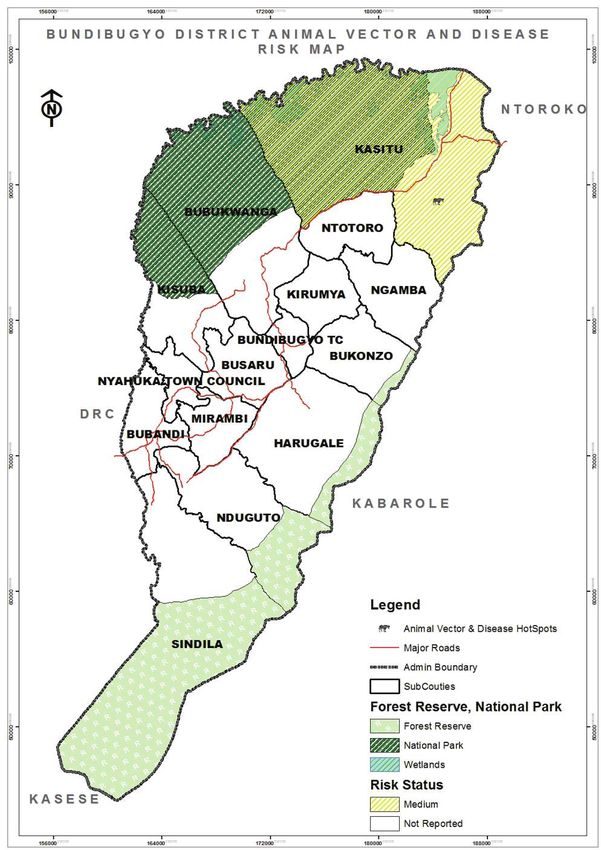
EXECUTIVE SUMMARY

This Bundibugyo District Hazard, Risk and Vulnerability Profile integrates scientific
information provided by GoU agencies and hazard and vulnerability knowledge provided
by communities on the District base map to contribute to a Ugandan atlas of disaster risk. It
will support planning and decision-making processes to manage disaster risk in the District

The methodology provided for four phases of work:
 Phase I   Preliminary activities
 Phase II  Field data collection, mapping, verification and ground truthing
 Phase III Participatory data analysis, mapping and report writing
 Phase IV  Refinement, validation and final map production/reporting

The report characterizes the District in terms of location, geography, gender demographics
by Sub-county and livelihoods.

The discussion of the nature of each hazard and its geographic extent in terms of Sub-
counties provides a qualitative assessment of the situations that the communities face.
Maps corresponding to each hazard show the areas where the hazard is significant, and
also hots pots as points of incidence of the hazard.

Bundibugyo District’s geographic centre is located at 00˚ 43’N, 30˚ 04’E. The District is
bordered by Hoima District to the northeast, Kibaale District to the East, Kabarole District to
the South, and the Democratic Republic of the Congo to the West and North.

The profile identifies ten endemic hazards: severe storms, Landslides, floods, crop pest and
disease, environmental degradation, internal conflicts, human epidemics, animal vector and
disease, bush fires and earth quakes.

The Bundibugyo District Local Government Officials together with the communities ranked
landslides, crop pests and diseases, animal vectors and diseases and severe storms to be
the highest risks.

The most vulnerable communities in Bundibugyo District are Kasitu, with a weighted
vulnerability of 5 (medium). Kasitu Sub-county is closely followed by Bubukwanga, kirumya,
Nyahuka Town Council, Bukonzo, and Ngamba Sub-counties with weighted vulnerabilities
of 4, 4, 3, 3, 3 (low) respectively. The least vulnerable communities are those of Harugale,
Sindila, Mirambi and Bubandi Sub-counties with a weighted vulnerability of 1 (low) each.

Early warning systems and other DRR interventions would be able to enhance the resilience
of the people of Kabarole to the effects of climate change.
This profile is a legitimate outcome of an integration of the spatial information obtained from
the mapping exercise and the community perception of the hazards. It should henceforth
inform the contingency planning, District development planning process towards disaster
proof plans.

iv   Bundibugyo District Hazard, Risk, and Vulnerability Profile
INTRODUCTION

Bundibugyo District is vulnerable to a number of hazards that lead frequently to disasters.
They include flooding, landslides, drought, animalattackson crops, livestock and humans,
crop pests and diseases, animal pests and diseases, environmental degradation, internal
conflicts, hailstorms, wind storms, bush fires, human epidemic and earthquakes. While
incidence of these hazards is reported, no consolidation and mapping of this information
has been done to analyze the District’s exposure and susceptibility to disaster risks.

The Bundibugyo District Local Government and the Department of Disaster Preparedness
and Management in the Office of the Prime Minister (OPM), with the support of the United
Nations Development Programme (UNDP), embarked on a process of mapping the hazards
and analyzing disaster risks and vulnerabilities in Bundibugyo District. The information
contained in this District Hazard, Risk, and Vulnerability Profile will guide the adoption of
disaster risk management (DRM)measures in the District and inform the development of the
District’s contingency and development plans.

Objectives
The objective of the hazard, risk, and vulnerability mapping is to produce a District Profile
that will aid planning and decision making processes in addressing disaster threats/risks in
Bundibugyo District.

Methodology
The multi-hazard, risk and vulnerability mapping approach employed a people-centered,
multi-sectoral, and multi-stakeholder approach. A mapping team led by the Office of the
Prime Minister (OPM) and involving representatives from UNDP and District Sector Offices
deployed on a field mission to Teso sub-region to capture the required information and
produce the District profile.

The team employed a variety of data-collection methods including use of a mix-scale
approach involving the integration of primary and secondary data. Secondary data were
acquired through Government sources (relevant Ministries, Departments and Agencies, the
Districts in Teso and Rwenzori sub-regions) and data bases from other organizations/NGOS
operating in these Districts. The raw spatial data and satellite images were assembled from
relevant sources and analysed with descriptive statistics and remote sensing technology.

The mapping exercise involved four critical phases as follows:
 Phase I   Preliminary activities
 Phase II  Field data collection, mapping, verification and ground rutting
 Phase III Participatory data analysis, mapping and report writing
 Phase IV  Refinement, validation and final map production/reporting

Phase I: Preliminary Activities
In this phase the mapping team undertook a series of planning and programming activities
before start of field activity including holding meetings with relevant teams, mobilizing

                                            Bundibugyo District Hazard, Risk, and Vulnerability Profile   1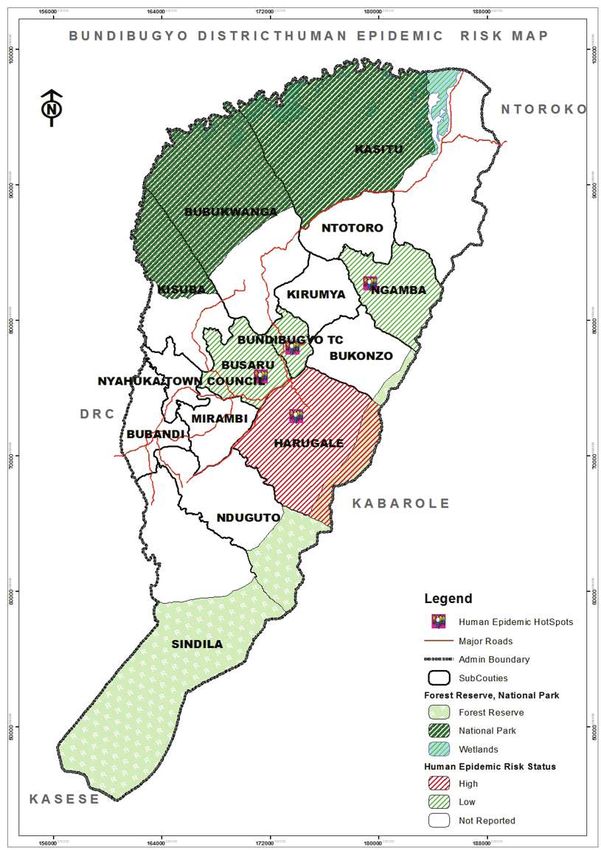
required resources, acquiring required equipment and materials, review of relevant literature,
establishing relevant contacts and developing a checklist of activities to be undertaken in
Phase Two.

The main objectives of Phase One were to prepare and undertake preliminary assessment
of the quality and nature of the resources/materials, develop a quick understanding within
the mapping team and other actors of the task of the multi-hazard, risk, and vulnerability
mapping before any detailed physical field work was undertaken. This phase enabled the
scoping and design of specific content and legends for the thematic maps.

The phase was also useful for preparing the resource deployment plan, and outlining
procedure and field work plans, etc. It articulated, among other issues, the utilization of
various stakeholders to ensure maximum participation in locating disaster prone locations
and any other information relevant to the mapping exercise.

Phase II: Field Data Collection and Mapping
Stakeholder mapping and local meetings. A preliminary field meeting was held in each
District to capture key local issues related to disaster incidence and trends. The meetings
gave opportunities for the mapping team and stakeholders to identify other key resource
persons and support staff from within the local community for consultation.

Stakeholder Participation Practices. Stakeholder participation was a key component
of the mapping exercise. The team conducted consultations with District Technical Sector
Heads under the overall purview of the District Disaster Management Committee (DDMC)
involved in the ground truthing exercises to ensure District leadership and ownership of the
data and results. During exit meetings, stakeholders, particularly those at District level, were
given the opportunity to validate, update and also contribute any other relevant information
vital to the mapping process.

Capture of spatial data. Spatial data were captured and complemented by base maps
prepared at appropriate scales. The base maps contained relevant data including location
of existing social-infrastructure and services, District area boundaries, environmental
elements, forest areas, utilities like roads, drainage and river course, contours and flood
prone settlements.

Secondary data or desktop research. A desk review of relevant documents at the District
and other umbrella organizations, including policy and legal documents, previous maps/
report and studies, was conducted. A checklist summarized the required information
according to the multi-disaster risk indicators being studied/mapped. Data from documents
were analysed using various methods including content analysis.

Critical observation and ground truthing. This approach was used to critically assess
the conditions, nature and location of disaster prone zones, “current human activity” and
settlement patterns along disaster prone areas. Critical observation and ground truthing
included inspection and observation of social infrastructure, major household economic

2   Bundibugyo District Hazard, Risk, and Vulnerability Profile
activities being practiced, natural drainage lines, rivers etc. Non-mappable and non-physical
situations were captured through remote sensing (e.g. satellite images) and physical
observation.

Main instruments of data collection. The main instruments used for data collection were
manuals of instructions (guides to mapping assistants), use of key informant guides and
notebooks, high resolution GPS receivers, digital camera for taking critical photographs,
high resolution satellite images and base maps/topographic sheets of the mapping areas.

Exit/feedback meetings with stakeholders. After field activities and data collection,
feedback and exit meetings with stakeholders were carried out in the District. These meetings
provided additional information regarding the disaster mapping exercise, validated the data
generated, and provided clarity on the expected outputs and the way forward into the next
phase.

Phase III: Data Analysis and Verification
Analysis of collected data. The mapping team and District Government Officials analyzed
the collected data, and developed thematic disaster maps by integrating features generated
from GPS data with base maps and high resolution satellite images. The main activities at
this phase included:
  Data entry, cleaning and coding
  Preparation of base maps and process maps
  Preparation of disaster risk and vulnerability maps

Methods used for data analysis. Data analysis methods used are the following:
 Geo-processing, data transformation and geo-referencing
 Discussions/FGDs
 Drafting, digitizing and GIS Overlays
 Compiling of different data and information

Data editing, coding and cleaning. Data entry clerks, data editors and coders digitized,
edited, coded and cleaned data collected using the various tools mentioned above. Both
qualitative and quantitative data obtained from the field were entered via a data entry
interface customized to the layout of the field data forms. Data coding and analysis started
immediately the data was available. Arrangements were made in the field to handle manual
editing and coding as and when data was received from the field crew. Furthermore, data
entry, verification, screen editing and system development followed sequentially to enable
the preparation of draft maps.

Data analysis package. The mapping team analysed acquired data using MS Word and MS
Excel for Windows, and spatial data using ArcGIS 10 software and mobile GIS applications.
They performed rapid and systematic GIS overlays to generate base maps and risk and
vulnerability maps.

                                             Bundibugyo District Hazard, Risk, and Vulnerability Profile   3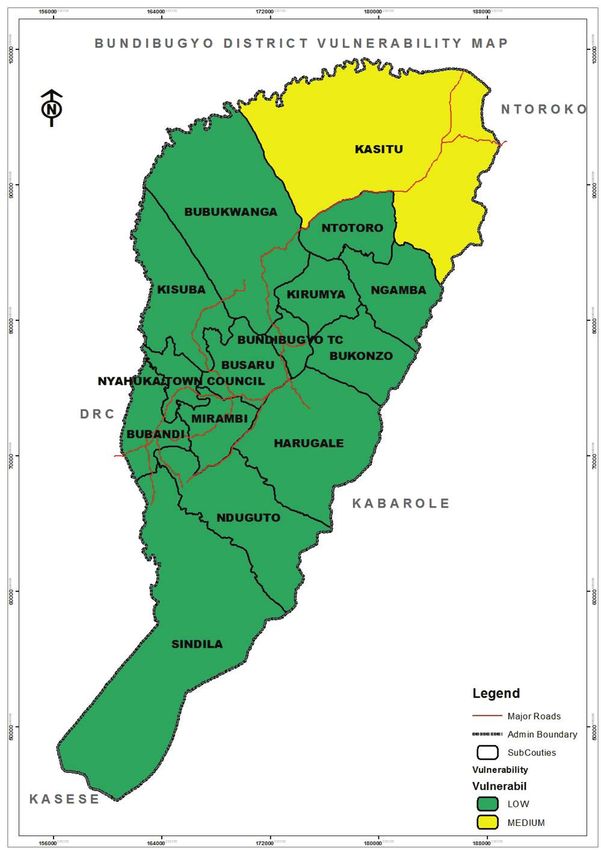
Descriptive statistics. The mapping team investigated trends per given indicator using
tables, graphs, charts and frequencies. As processing of data developed, they merged it for
cross tabulation and eventual production of thematic maps for the various types of hazards.

Generation and appraisal of draft Maps: Prioritization set by the Districts determined the
various hazards presented on the thematic maps. The team convened a field workshop to
present, appraise and validate the risk and vulnerability maps with respect to their accuracy
and completeness. Information gaps were identified and filled in the final risk and vulnerability
maps.

Phase IV: Refinement, validation and reporting
A final workshop was conducted by the OPM to facilitate validation and dissemination of the
District hazard, risk, and vulnerability profile to relevant partners.

Overview of the District
Location
Bundibugyo District has 13 rural Sub-counties and 2 Urban Town Councils. It is bordered by
Hoima District to the Northeast, Kibaale District to the east, Kabarole District to the South,
and the Democratic Republic of the Congo to the West and North. The District headquarters
at Bundibugyo are located approximately 78km West of Fort Portal and 154km by road
North of Kasese Municipality, the largest urban centre in the Sub-region. Bundibugyo to Fort
Portal is 83 km; Fort Portal to Kasese is 71 km. The geographic boundaries of the District
are the Semuliki River to the West, the Ruwenzori Mountains to the East and Ntoroko to the
North. The geographic location of the District is at 00 43N, 30 04E.

Overview
The District is relatively isolated from the rest of Uganda, being the only District that lies
west of the Ruwenzori Mountains. Though it is still a part of the Nile Basin, it is ecologically
and culturally part of Central Africa. Its people and customs are more similar to those of
eastern DRC than the rest of Uganda, despite being politically in Uganda and East Africa.
In 2010, the Northern part of Bundibugyo District was removed to form Ntoroko District.
Bundibugyo District, together with neighboring Ntoroko District and Kasese District, are part
of the Rwenzururu Kingdom.

4   Bundibugyo District Hazard, Risk, and Vulnerability Profile
Demographics

Table 1: Projected 2012 Population of Bundibugyo District by Sub-county
Sub-county              Male                   Female                           Total
Sindila                 11,200                 11,900                           23,100
Ndugutu                 12,900                 13,200                           26,100
Harugale                12,200                 13,700                           25,900
Bukonzo                 5,900                  7,800                            13,700
Ngamba                  6,000                  6,800                            12,800
Ntotoro                 5,300                  5,700                            11,000
Kasitu                  10,800                 11,800                           22,600
Bubandi                 9,200                  10,800                           20,000
Nyahuka TC              4,800                  5,400                            10,200
Kisubba                 8,400                  8,900                            17,300
Busaru                  11,600                 12,700                           24,300
Mirambi                 6,500                  7,200                            13,700
Bundibugyo TC           11,100                 12,000                           23,100
Bubukwanga              10,200                 11,900                           22,100
Kirumya                 4,600                  5,200                            9,800
Total                   111,652                124,911                          276,600

Table 2: Major Tribes and Languages Spoken in Bundibugyo District
Sub-county      Tribe                                   Language
Sindila         Bakonzo, Bamba, Babwisi                 Lukonzo, Kwamba, Lubwisi
Ndugutu         Bakonzo, Bamba, Babwisi                 Lukonzo, Kwamba, Lubwisi
Harugale        Bakonzo, Bamba, Babwisi                 Lukonzo, Kwamba, Lubwisi
Bukonzo         Bakonzo, Bamba, Babwisi                 Lukonzo, Kwamba, Lubwisi
Ngamba          Bakonzo, Bamba, Babwisi                 Lukonzo, Kwamba, Lubwisi
Ntotoro         Bakonzo, Bamba, Babwisi                 Lukonzo, Kwamba, Lubwisi

Kasitu          Bakonzo, Bamba, Bavanuma, Batwa,        Lukonzo, Kwamba, Lubwisi, Lutoro,
                Batuku                                  Luvanuma
 Bubandi        Bakonzo, Bamba, Babwisi                 Lukonzo, Kwamba, Lubwisi
 Nyahuka TC     Bakonzo, Bamba, Babwisi                 Lukonzo, Kwamba, Lubwisi
 Kisubba        Bakonzo, Bamba, Babwisi                 Lukonzo, Kwamba, Lubwisi
 Busaru         Bakonzo, Bamba, Babwisi                 Lukonzo, Kwamba, Lubwisi
 Mirambi        Bakonzo, Bamba, Babwisi                 Lukonzo, Kwamba, Lubwisi
 Bundibugyo     Bakonzo, Bamba, Babwisi, Batoro         Lukonzo, Kwamba, Lubwisi, Rutooro
 TC
 Bubukwanga     Bakonzo, Bamba, Babwisi                 Lukonzo, Kwamba, Lubwisi
 Kirumya        Bakonzo, Bamba, Babwisi                 Lukonzo, Kwamba, Lubwisi

                                          Bundibugyo District Hazard, Risk, and Vulnerability Profile   5
Livelihoods
Table 3: Bundibugyo District Main Livelihoods, by Sub-county and Town Council
Agro-ecological
Livelihood Sub-county
zone
Bananas, Arabia coffee, beans,
Sindila, Ndugutu, Harugale,
cassava, irish potatoes, seasonal
Bukonzo, Ngamba, Kasitu
horticultural crops, barley
Sindila, Ndugutu, Harugale,
Goats and cattle, poultry, piggery
Bukonzo, Ngamba, Kasitu, Ntotoro
Sindila, Ndugutu, Harugale,
Apiary
Bukonzo, Ngamba, Kasitu
Sindila, Ndugutu, Harugale,
Tourism
Bukonzo, Ngamba, Kasitu
Sindila, Ndugutu, Harugale,
Petty trade
Bukonzo, Ngamba, Kasitu, Ntotoro
Highland Zone
Sindila, Ndugutu, Harugale,
Agricultural markets
Bukonzo, Ngamba, Kasitu, Ntotoro
Sindila, Ndugutu, Harugale,
Brick laying
Bukonzo, Ngamba, Kasitu, Ntotoro
Sindila, Ndugutu, Harugale,
Fish farming
Bukonzo, Ngamba, Kasitu, Ntotoro
Sindila, Ndugutu, Harugale,
Charcoal burning and fuel wood
Bukonzo, Ngamba, Kasitu, Ntotoro
Sindila, Ndugutu, Harugale,
Lumbering
Bukonzo, Ngamba, Kasitu, Ntotoro
Bubandi, Nyahuka TC, Kisubba,
Bananas, robusta coffee, soya beans,
Busaru, Mirambi , Bundibugyo TC,
cassava, sweet potatoes, cocoa
Bubukwanga, Kirumya
Bubandi, Nyahuka TC, Kisubba,
Goats, piggery, poultry, cattle, Busaru, Mirambi , Bundibugyo TC,
Bubukwanga, Kirumya
Bubandi, Nyahuka TC, Kisubba,
Petty trade Busaru, Mirambi , Bundibugyo TC,
Bubukwanga, Kirumya
Bubandi, Nyahuka TC, Kisubba,
Transport Busaru, Mirambi , Bundibugyo TC,
Bubukwanga, Kirumya
Lowland Zone
Tourism Kisubba, Bubukwanga
Bubandi, Nyahuka TC, Kisubba,
Aquaculture Busaru, Mirambi , Bundibugyo TC,
Bubukwanga, Kirumya
Bubandi, Nyahuka TC, Kisubba,
Brick making Busaru, Mirambi , Bundibugyo TC,
Bubukwanga, Kirumya
Bubandi, Nyahuka TC, Kisubba,
Stone quarrying and sand mining Busaru, Mirambi , Bundibugyo TC,
Bubukwanga, Kirumya
Charcoal burning, fuel wood Kisubba, Bubukwanga, Kirumya
Lumbering Bubandi, Nyahuka TC,
6 Bundibugyo District Hazard, Risk, and Vulnerability ProfileHazards
Table 4: Hazard status
Hazard Status Sub-county
Kirumya, Ntotoro, Bubukwanga,
Bundibugyo Town Council, Nyahuka
Instances of mudslides in the low
Landslides Town Council, Busara, Ngamba,
lying areas reported
Kasitu, Bukonzo, Sindila, Ndugutu,
Harugale
Instances of banana wilt, African Bubukwanga, Bundibugyo TC,
Crop pests and cassava mosaic, cassava brown Nyahuka TC, Bukonzo, Kasitu,
diseases streak, cocoa verticulum wilt, coffee Kirumya, Kisubba, Ndugutu, Busaro
wilt reported and Ngamba Sub Counties
Instances of swine fever, foot and
Animal Vector
mouth, CBPP, rabies and east coast Kasitu Sub-county
and diseases
fever are reported
Instances of hail storm and high
Heavy storms District wide
winds reported
Flooding Instances reported All Sub Counties and Town Councils
River bank degradation as a result
of sand and stone mining along the Nyahuka, Ndugutu, Bubukwanga,
Environmental
rivers; Central Forest Reserves cut Harugale, Bukonzo, Busaro, Kasitu
degradation
off and settled in by locals have been and Kirumya
reported
Instances of tribal conflicts reported Bubukwanga, Kisuba, Nyahuka TC,
Internal conflicts
between Bakonjo and Bamba Busaro, Ntotoro
Human epidemic Incidence of Ebola reported in 2007 Ngamba, Bundibugyo Town Council
Bush fires Incidence of wild fire reported Kasitu
Earthquake Incidence of 1966 reported Bundibugyo Town Council
Table 4 displays the status and summarizes the nature of hazards in the District and provides
the locations of instances. Table 5 provides another view of the relative significance of hazards.
The right most column is ordered by the number of hazards endemic in each Sub-county,
and is a measure of compound vulnerability. The bottom row is ordered by the number of
Sub-counties that experience each hazard, giving an indication of its geographic prevalence.
Table 6 ranks the hazards in their order of occurrence, frequency and magnitude. Their
ranking reflects the perception of stakeholders of the relative severity of the corresponding
impacts on them.
Bundibugyo District Hazard, Risk, and Vulnerability Profile 7Table 5: Summary of Hazards by Sub-county
Animal Vector and disease
Environmental degradation
Crop pest and disease
Human epidemics
Internal conflicts
Sub-county
Severe storms
Earth quakes
Landslides
Bush fires
Floods
Total
Kasitu • • • 7
Bubukwanga • • • • 6
Bundibugyo TC • • • • 6
Nyahuka TC • • • • 6
Ntotoro • • • • 5
Bukonzo • • • 5
Ndugutu • • • 5
Busaro • • 5
Kirumya • • • 4
Kisubba • • 4
Harugale • • 4
Ngamba • • 4
Sindila • • • 3
Merambi • 2
Bubandi • 2
Total 15 10 15 10 8 5 2 1 1 1 68
Table 6: Ranking of hazards
Area (No.
of sub
Frequency
counties)
(Most Magnitude Total
affected Rank
S/ Freq=3, (High=3, (Sum of
Hazard >10=5, (Ascending
No. Freq=2, Medium=2, Columns
8-10=4, order)
Not Low=1) 3,4 &5)
5-7=3,
Freq=1)
2-4=2,Hazard Risk Assessment
Table 7 expresses the communities’ assessment of severity and likelihood of risk in their
respective Sub-counties. Each of the columns in table 7 below translates into respective
hazard risk maps in the following section. The colours red, yellow, and green showing the
severity of the hazard risk in the table are also reflected in the corresponding maps.
Table 7: Hazard risk assessment
Animal Vector and
Human epidemics
Internal conflicts
Environmental
Crop pest and
Earth quakes
degradation
Sub-county
Landslides
Bush fires
disease
disease
Floods
Kasitu H L M H M N M M N
Bubukwanga M M M H H N N N N
Bundibugyo TC L M M N L L N N L
Nyahuka TC L L M H L N N N N
Ntotoro M L N N M N N N N
Bukonzo L L M M H N N N N
Ndugutu L L M L L N N N N
Busaru N N M H L N N N N
Kirumya N H M H H N N N N
Kisubba L N M N L N N N N
Harugale N L N M N N N N N
Ngamba N H M N N H N N N
Sindila L L N N N N N N N
Mirambi L N N N N N N N N
Bubandi M N N N N N N N N
Key: H = High, M = Medium, L = Low, N = Not reported
Bundibugyo District Hazard, Risk, and Vulnerability Profile 9Risks Landslide Risk Figure 1: Landslide risk map 10 Bundibugyo District Hazard, Risk, and Vulnerability Profile
Figure 1 above shows the status of landslides as a hazard in Bundibugyo District. Landslides
in the low lying areas are reported often for instance in May, 2013 overran approximately
200 hectares of farmland. They carried away or buried gardens of cocoa, bananas and cof-
fee, affecting the local population to varying extents: Kirumya and Ngamba Sub-counties
face high risk of landslides as shown on the map by the color red; Bubukwanga Sub-county
has moderate risk to landslides as depicted by yellow on the map above; Kisuba, Mirambi
and Bubandi Sub-counties did not report any incidences of landslides and all the other sub
counties face low vulnerability thus the color green on the map.

The following locations are hotspots for the hazard in the respective sub counties:
   à Kirumya (Bundikeki Parish at Nyangasa Village has extensive damage, Bundimurombi)

   à Ntotoro (Bugando)

   à Bubukwanga (Bubukwangaparish (BuhunduVillage) Bundigere Parish (Bundimbali
     Village) and Mataisa Parish (Bunyaruta Village, most hit)

   à Bundibugyo Town Council Bimara Parish, Nyambiri and Kibale cells; Kanyansimbi
     Parish, Mutukula Cell; Bundibugyo Central Parish, Kisenyi cell.

   à Nyahuka Town Council Kasiri Parish

   à Busaru Sub-county, Bugombwa Parish, Mukudungu and Busengerwa Villages;
     Bundinyama Parish, Hakitara and Bundimwendya

   à Ngamba Sub-county, Kikyo Parish, Burabagira Villages and Ngamba Parishes,
     Kakuka and Kityabya Villages

   à Kasitu Sub-county, Kasitu Parish, Ntandi Parish and parts of Kabango

   à Bukonzo Sub-county, Bundimulangya Parish, Kirumya Muslim and Sure Deal Villages,
     Buhundu Parish, Twanzane Village

   à Sindila Sub-county, Kakuka Parish, Kakuka I, Malindi, Bihya, Buboni Villages;
     Bunyamwera Parish, Musili, Kabwe, Kaghughu Villages.

   à Ndugutu Sub-County, Butama Parish, Kasingiri, Bugwiro, Nyakabugha and Butama
     Villages; Kasanzi Parish, Irombyo, Busigha, Kasanzi II Villages; Bundimbuga Parish,
     Buengya II Village and

   à Harugale Sub-county, Bumate Parish, Kidungu Village; Bupomboli Parish,
     KibaleKabingo Villages; Kasulenge Parish, Kitsolima Bitsikya Villages; Ngite Parish,
     Kanyangoma Kabahira Villages.

                                            Bundibugyo District Hazard, Risk, and Vulnerability Profile   11
Crop Pests and Diseases Risk Figure 2: Crop Pests and Diseases Risk Map 12 Bundibugyo District Hazard, Risk, and Vulnerability Profile
Figure 2 shows the status of crop pests and diseases in the District. In Bundibugyo District, crop
pest and diseases proliferate in the prone Sub-counties of Busaro, Bubukwanga, Bukonzo,
Kirumya, Ngamba, Kasitu, Kisubba, Nyahuka, Bubandi, Mirambi, and Bundibugyo Town
Council. These sub counties report moderate risk of crop pests and diseases represented
by the yellow color on the map while Sindila, Harugale, Bubandi, Mirambi and Ntotoro did
not report any incidences thus no risk of crop pests and diseases.
The following Parishes, which are hotspots for the hazard report crop pests and diseases:
Bunyangule, Butama, Bundimbuga, Kasanzi, Ngite, Kasulenge, Bupomboli, Bumate,
BuKangama, Buhundu, Bunguha, Burambagira, NgambaKikyo, Malomba, Kasitu, and
Burondo Incidence of banana bacterial wilt, African cassava mosaic disease, cassava
brown streak, cocoa verticillium wilt, coffee wilt disease, white flies, thrips, grass hoppers,
army worms and birds are recorded. The cassava brown streak disease is widespread in
the District.
Cocoa Verticilium wilt is prevalent mainly in low lying areas of the Sub-counties of Busaro,
Kisubba, Nyahuka Town Council, Kirumya, Bubukwanga, Bubandi, Mirambi, and Bundibugyo
Town Council.
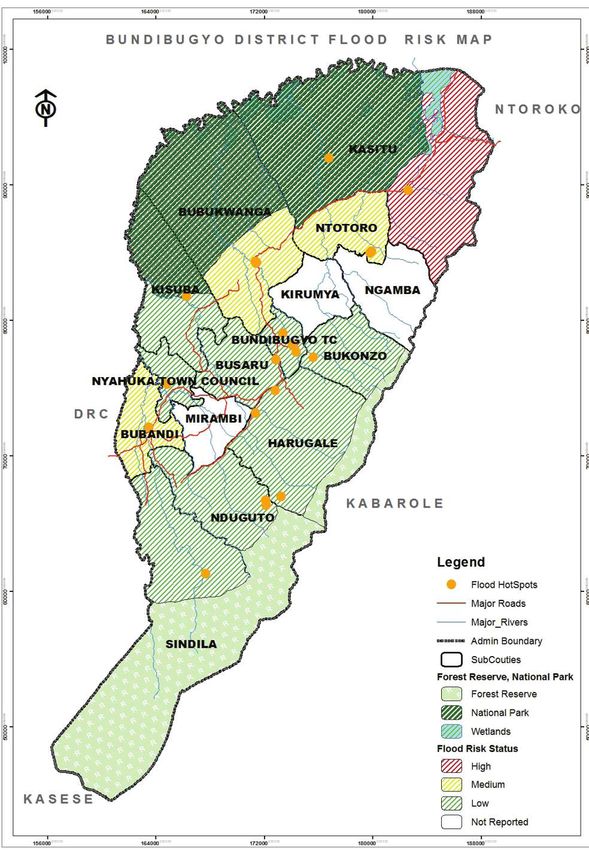
Bundibugyo District Hazard, Risk, and Vulnerability Profile 13Flood Risk Figure 3: Flood Risk Map 14 Bundibugyo District Hazard, Risk, and Vulnerability Profile
Figure 3 displays the risk status of floods in Bundibugyo District. As shown on the map, the
hazard risk is at varied magnitudes whereof Kasitu Sub-county is faced with the highest
risk thus the color red; Ntotoro, Bubukwanga and Bubandi face moderate risk of floods; and
the rest of the Sub-counties and Town Councils face low risk (coloured green on the map)
except Mirambi, Kirumya and Ngamba which do not face any risk at all.
In each annual wet season floods occur on these rivers, constituting almost the entire District:
R. Semiliki, Kisubba, Bubukwanga, Ntotoro and Kasitu Sub-counties
R. Ntotoro, Ngamba, Kasitu and Ntotoro Sub-counties
R. Nkisia, Kasitu Sub-county
R. Kirumia, Bukonzo, Kirumia and Ntotoro Sub-counties
R. Lamya, Sindila, Bubandi, Nyahuka, and Kisubba Sub-counties
R. Mpulia, Kasitu Sub-county
R. Tokwe, Harugale, Bundibugyo Town Council and Bubukwanga Sub-counties
R. Nyalulu, Busaru, Harugale, Bubukwanga Sub-counties
R. Lugo, Harugale, Busaru, Kisuba and Bubukwanga Sub-counties
R. Nyahuka, Ndugutu, Merambi Sub-counties, and Nyahuka Town Council
R. Ndugutu, Ndugutu, Bubandi Sub-counties
R. Sindila, Sindila and Bubandi Sub-counties
R. Ngelemeke Kasitu Sub-county
R. Rwabatwa Ndugutu, Bubandi Sub-counties and Nyahuka Town Council
R. Kirumya Kirumya Sub-county.
Flash flooding may occur after a heavy rain in the mountains. Extensive damage is reported
with loss of farm land and crops, livestock, bridges, gravity flow schemes, water sources and
sometimes loss of human life. In 2001, Kasitu flooding killed 21 people in one day.
The Semuliki River frequently overruns its banks in Burondo Parish, Kasitu Sub-county,
flooding extensive grazing land. Flowing between Uganda and DRC, its shifting course has
international boundary implications.
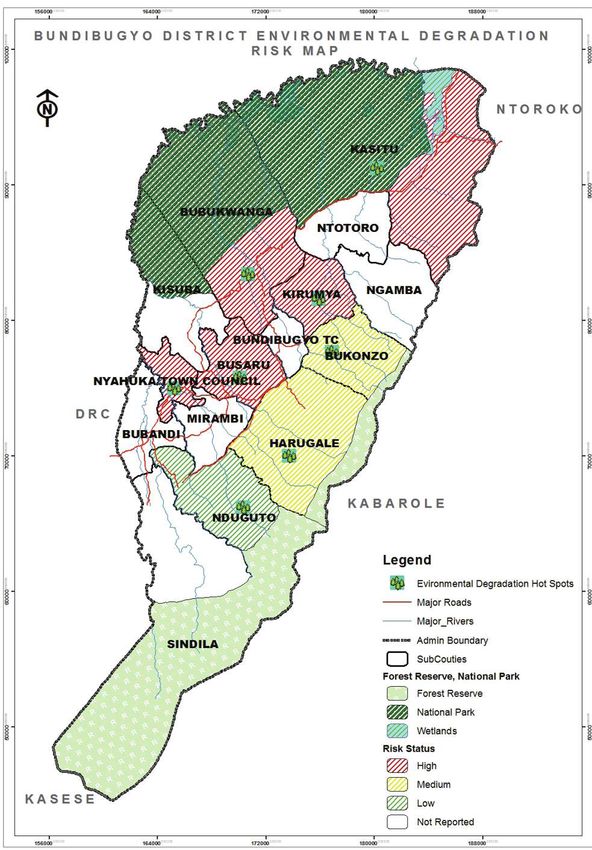
Bundibugyo District Hazard, Risk, and Vulnerability Profile 15Environmental Degradation Risk Figure 4: Environmental Degradation Risk Map 16 Bundibugyo District Hazard, Risk, and Vulnerability Profile
Figure 4 above depicts the risk status of environmental degradation in the District. In
Bundibugyo District, environmental degradation is a grave risk because of the various
aspects of life, livelihoods, property and environment it disrupts and destroys. The Sub-
counties of Kasitu, Bubukwanga, Kirumya, Busaru, and Nyahuka Town Council are prone to
high risk of environmental degradation and shaded in the color red; Bukonzo and Harugale
sub counties are prone to moderate risk of environmental degradation; Ndugutu Sub-county
is prone to low risk of environmental Degradation; and all the other sub counties and town
councils are not prone to the risk of environmental degradation.
The environment is being degraded in various ways:
River bank degradation results from sand and stone mining on Nyahuka River in Nyahuka-
Town Council. The activity weakens the river banks making it more vulnerable to erosion
and river bank overflow, and causes silting and other side effects. It occurs at many points
along the river Nyahuka, Rivers Bimara and Tokwe in Bundibugyo Town Council, Rivers
Ndugutu and Lamya in Bubandi Sub-county and R. Nkisya in Kasitu Sub-county
Invasions of Central Forest Reserves by settlers have been reported, reducing forest cover
and its carbon capture capacity, in Kabango Muntandi CFR in Kasitu Sub-county, Bundikek
CFR in Kirumya Sub-county, and Mataa and Nyakakindo in Busaru Sub-county. The largest
CFR in the District has been entirely deforested for cultivation.
On the River Bimara and River Humya in Bubukwanga Sub-county, stone, sand mining and
oil palm processing discharge sediment and waste into river, challenging aquatic life and the
surrounding ecosystem.
The Harugale borrow pits and others were opened by CICO for gravelling roads in Bundibugyo,
accelerating soil erosion on the slopes and raising the risk of landslides.
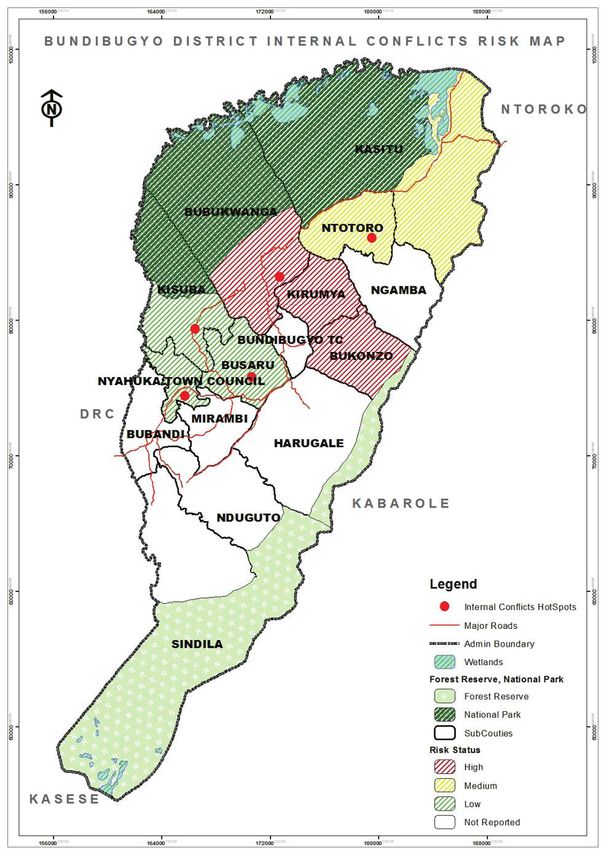
Bundibugyo District Hazard, Risk, and Vulnerability Profile 17Internal Conflicts Risk Figure 5: Internal Conflict Risk Map 18 Bundibugyo District Hazard, Risk, and Vulnerability Profile
Figure 5 shows the status of internal conflict risk in Bundibugyo District. Conflicts with a variety
of origins are ongoing in Sub-counties of Bundibugyo District, which include Bubukwanga
(Mataisa Parish – Bunyaruta Village and Bundinyama Parish Bundiwerume Village), Ntotoro
Parish, Kitungezi Village. For example, the Bamba and Bakonzo are in dispute over the
visit of the King of Bakonzo to Bundibugyo. In June 2012 reports of tribal conflicts over land
between Bakonzo and Bamba were received, mainly in the low lying Sub Counties.

Other Sub-counties in conflict include Ntotoro, Kitungezi Parish; Nyahuka Town Council,
Kalera Cell; Kisubba Sub-county, Busoru Parish, Butogo Trading Center; Busaru Sub-county,
Kirindi Parish, Kirindi Village where escalation to disastrous levels may occur if situations
are not well managed.

Overall, referring to the map, Bubukwanga, Bukonzo and Kirumya Sub-counties are prone
to high risks of internal conflicts as shown by the red color on the map; Kasitu and Ntotoro
sub counties are prone to moderate risk of internal conflicts as shown by the color yellow
on the map, Bundibugyo T/C, Nyahuka T/C, Busaro Sub-county and Kisuba Sub-county are
prone to low risk of internal conflicts as represented by the color green on the map. All the
other Sub-counties are not prone to risks of internal conflicts.

                                               Bundibugyo District Hazard, Risk, and Vulnerability Profile   19
Human Epidemic Risk Figure 6: Human Epidemic Risk Map The status of human epidemics in the District are shown in figure 6. Bundibugyo District has registered several human epidemics which claimed many lives mainly in Bundibugyo Town Council and Ngamba Sub-county. In 2007 an ebola outbreak killed 34 people. It started in Ngamba Sub-county and spread to Bundibugyo Town Council. Whereas Harugale, Busaru, Ngamba and Bundibugyo Town Council are epidemic-prone, Ngamba is prone to high risk as depicted by color red on the map, while Bundibugyo Town Council is prone to low risk. The oth- er sub counties of Harugale and Busaru are potentially prone to low risk of human epidemics. 20 Bundibugyo District Hazard, Risk, and Vulnerability Profile
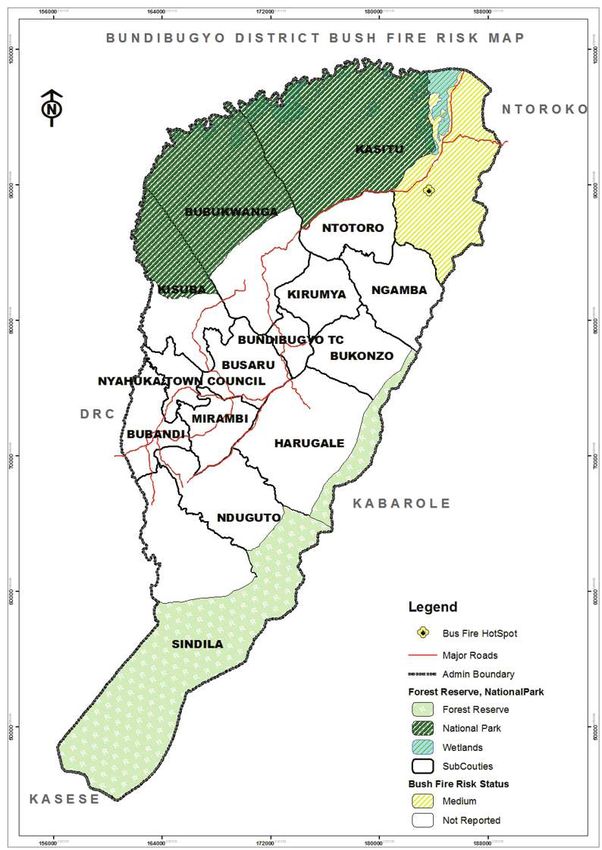
Bush fire Risk
Figure 7: Bush Fire Risk Map
Figure 7 displays the risk status of wild fires in Bundibugyo District. Instances of wild fire have
been reported in the highland Sub-county of Kasitu, mainly in Karambi and Burondo Parishes
and in parts of the North Rwenzori Forest Reserve. These bush fires coincide with prolonged dry
spell and people who burn their gardens for cultivation and then fail to control them. The fires
damage natural pastures, affecting pastoralists, and also burn other people’s gardens causing
losses in the natural environment, property, livelihood and other aspects of life. The Sub-county
is prone to moderate risk of bush fires as represented by the color yellow on the map.
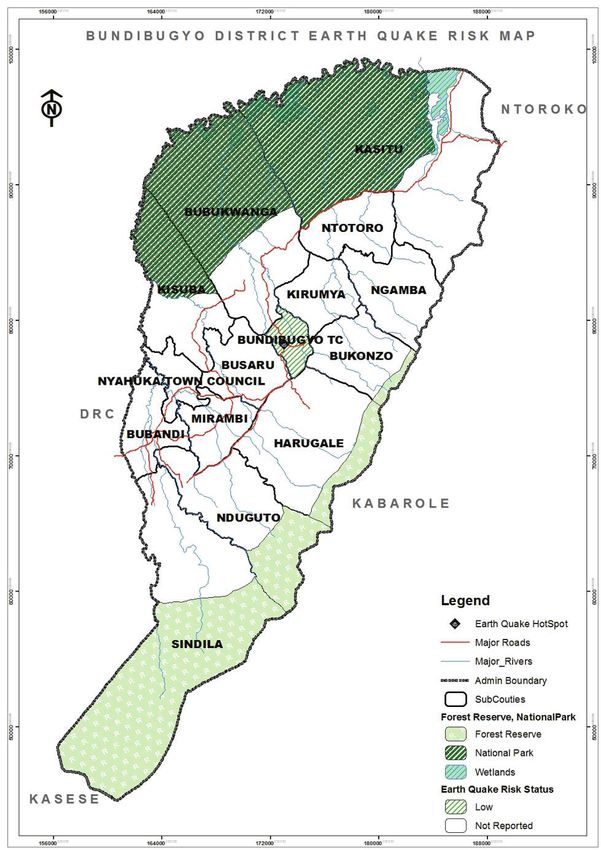
Bundibugyo District Hazard, Risk, and Vulnerability Profile 21Earthquake Risk Figure 8: Earthquake Risk Map 22 Bundibugyo District Hazard, Risk, and Vulnerability Profile
Earthquake risk status in Bundibugyo District is shown in figure 8. Instances of earth quake
were reported in 1966 and 1994 in Bundibugyo Town Council and damage was reported
at the then Saza (County) headquarters, which was so severely cracked that the building
was condemned. The same earthquake also affected the District Hospital of Bundibugyo
where staff quarters buildings were reported to have collapsed. Frequent though weak
tremors suggest that Bundibugyo Town Council is prone to low risk of earthquake due to its
population density and unplanned development compared to other Sub-counties and Town
Councils in the District.

                                            Bundibugyo District Hazard, Risk, and Vulnerability Profile   23
Animal Vector and Diseases Risk Figure 9: Animal Vector and Disease Risk Map 24 Bundibugyo District Hazard, Risk, and Vulnerability Profile
Figure 9 portrays the status of animal vector and disease risk in Bundibugyo District.
Instances of ticks, swine fever, foot and mouth diseases, CBPP, brucellosis, lumpy skin
diseases, rabies and east coast fever are reported to be common in Kasitu Sub-county,
Burondo Parish. Animals, mainly cows, graze in big numbers on communal land facilitating
the spread of animal diseases and pests, and make Kasitu Sub-county prone to moderate
risk of this hazard. Additionally the Sub-county is adjacent to the Semiliki Game Reserve
where the domestic herds interact with the wild and become exposed to lumpy skin disease,
common among wild animals.

                                           Bundibugyo District Hazard, Risk, and Vulnerability Profile   25
Vulnerability
Table 7 summarizes the communities’ assessment of hazard severity and frequency in
the Sub-counties. Table 8 transforms those qualitative low/medium/high judgements to
numerical values 1/2/3 which when summed vertically show the relative risk per hazard.
The horizontal sums show both cumulative and weighted vulnerability of the communities at
Sub-county level.
Table 8: Risk and vulnerability assessment
Weighted vulnerability (Cumulative/3)
Cumulative vulnerability (Absolute)
Animal Vector and disease
Environmental degradation
Crop pest and disease
Sub-county
Human epidemics
Internal conflicts
Earth quakes
Landslides
Bush fires
Floods
Kasitu 3 1 2 3 2 0 2 2 0 15 5
Bubukwanga 2 2 2 3 3 0 0 0 1 13 4
Bundibugyo TC 1 2 2 0 1 1 0 0 0 7 2
Nyahuka TC 1 1 2 3 1 0 0 0 0 8 3
Ntotoro 2 1 0 0 2 0 0 0 0 5 2
Bukonzo 1 1 2 2 3 0 0 0 0 9 3
Ndugutu 1 1 2 1 1 0 0 0 0 6 2
Busaru 0 0 2 3 1 0 0 0 0 6 2
Kirumya 0 3 2 3 3 0 0 0 0 11 4
Kisubba 1 0 2 0 1 0 0 0 0 4 1
Harugale 0 1 0 2 0 0 0 0 0 3 1
Ngamba 0 3 2 0 0 3 0 0 0 8 3
Sindila 1 1 0 0 0 0 0 0 0 2 1
Mirambi 1 0 0 0 0 0 0 0 0 1 1
Bubandi 2 0 0 0 0 0 0 0 0 2 1
Total 16 17 20 20 18 4 2 2 1 100
Key: 3 = High, 2 = Medium, 1 = Low, 0 = Not reported
26 Bundibugyo District Hazard, Risk, and Vulnerability ProfileRisk Vulnerability
Figure 10: Risk Vulnerability Map
Bundibugyo District Hazard, Risk, and Vulnerability Profile 27The vulnerability map in Figure 10 shows the areas of low, medium and high vulnerability according to the risk and vulnerability analysis table (Table 8) above. In this analysis, the cumulative vulnerability of each Sub-county is calculated and then weighted to provide weighted vulnerabilities for individual Sub-counties. Therefore Sub-counties with weighted vulnerability values 4 or less are coded “low”, considered to be low vulnerability areas and are assigned green, those from 5 to 7 are coded “medium”, considered to be medium vulnerability areas and are assigned yellow while those whose weighted vulnerabilities are 8 or more are coded “high”, considered to be high vulnerability areas and are represented by red. Bundibugyo District is exposed to 9 hazards namely crop pests and diseases, environmental degradation, internal conflicts, landslides, floods, human epidemics, animal vector and diseases, bush fires and earthquakes arranged in their order of risk from highest to lowest. These are exacerbated by increasing human activities on the mountain slopes of Rwenzori, farming in the low-lying areas and flood plains, houses with weak foundations and poor building designs, and poor soils with less protective vegetation on slopes among many other unsustainable practices. The District did not have any Sub-county that is highly vulnerable (red). Kasitu, the most vulnerable Sub-county in the District is at the medium (yellow) scale of vulnerability but suspected to achieve the “red” status in the near future due to its unprecedented environmental degradation and exposure to floods. The rest of Sub-counties are at the lower level (green) of the vulnerability scale. Harugale, Sindila, Mirambi and Bubandi Sub-counties portrayed very low vulnerability levels to the stated hazards tying at a weighted vulnerability of 1. Though all the elements of the community are vulnerable to the fore mentioned hazards, the burden lies heaviest on the elderly, the children and the women. The school children and the farmers are especially vulnerable to floods than any other groups. The poor members of these communities too feel the pinch of the hazards more than their wealthy counterparts therefore are more vulnerable. 28 Bundibugyo District Hazard, Risk, and Vulnerability Profile
Conclusion

This multi hazard, risk and vulnerability profile for Bundibugyo District was produced after
conducting a rigorous people centered, multi-sectoral, and multi stakeholder field data
collection/mapping, analysis, and map production exercise. It is therefore a synthesis
of primary data, secondary data and the perception/experiences of the local people, the
community leadership at all levels. Thus it portrays how the people of Bundibugyo perceive
each of the hazards based on the past trends and the predicted likelihood of their occurrences
and impact on the communities.

The Bundibugyo District Local Government Officials together with the communities ranked
crop pests and diseases, environmental degradation, internal conflicts and landslidesto be
the highest/major risks in the District with total risks of 20, 20, 18 and 17 respectively.

The most vulnerable communities in Bundibugyo District are Kasitu, witha weighted
vulnerability of 5 (medium). Kasitu Sub-county is closely followed by Bubukwanga, kirumya,
Nyahuka TC, Bukonzo, and Ngamba Sub-counties with weighted vulnerabilities of 4, 4, 3,
3, 3 (low) respectively. The least vulnerable communities are those of Harugale, Sindila,
Mirambi and Bubandi Sub-counties with a weighted vulnerability of 1 (low) each.

Early warning systems and other DRR interventions would be able to enhance the resilience
of the people of Bundibugyo to the effects of climate change.

This profile is a legitimate outcome of an integration of the spatial information obtained from
the mapping exercise and the community perception of the hazards. It should henceforth
inform the contingency planning and District development planning process towards disaster
proof plans.

                                             Bundibugyo District Hazard, Risk, and Vulnerability Profile   29
Definition of Terms Drought. Drought is the prolonged shortage of water usually caused by lack of rain. Drought and famine are related because crop and livestock productivity suffer in droughts. Food insecurity. Food Insecurity is the severe shortage of food that may lead to malnutrition and death. Floods. A flood occurs when large amounts of water cover a place that is meant to be dry. Floods usually occur with high rainfall. Landslides. These are rapid movements of large mass of mud, rocks, formed from lose soil and water. Landslides occur mainly during the rainy season, but they can also be precipitated by earthquakes. Community settlement on steep slopes and other uncontrolled land use practices increase the probability of landslides. Epidemics. This is the occurrence of a disease, in a particular community and at a particular period, beyond normal levels and numbers. Epidemics may affect people, crops or livestock. Human epidemics. The diseases include cholera, meningitis, hepatitis E, marbug, plague, avian influenza, ebola and sleeping sickness among others. Crop and animal epidemics. Animal epidemics include swine fever, foot and mouth disease, naganan, and bird flu. Crop disease epidemics include coffee wilt, banana bacterial wilt, cassava mosaic and cassava brown streak disease. Heavy storms. Heavy storms in Uganda are often accompanied by hail, lightning and violent winds. Storms can result in destruction of crops, animals, public facilities and human settlements. Lightning can be deadly and may be mitigated by lightning ground conductors on buildings. Pest infestation. These are destructive insects, worms, caterpillars or any other animal that attacks crops or livestock. Common pests in Uganda include weevils, locusts and caterpillars. Vermin. Baboons, chimpanzees, bush pigs and other animals which raid crops cause damage and losses which may significantly diminish agricultural productivity. Land conflict. These are conflicts arising from ownership and use of land and other land resources. Cattle rustling. This is when one community raids another to steal livestock. Environmental Degradation. This results from poor land use and other unsustainable ecosystem exploitation that lead to deterioration of the environment. Overgrazing, cultivation on sloping land, unguided and uncontrolled use of fertilizers and pesticides, bush burning, 30 Bundibugyo District Hazard, Risk, and Vulnerability Profile
overfishing, deforestation, mining, poor wastewater treatment, inappropriate waste disposal
and wetlands reclamation are examples of causes of environmental degradation.

Mines and unexploded ordinance. Mines are devices designed to explode with fatal effect
when disturbed. Unexploded ordinance are unspent bullets, grenades, rockets, etc., which
are discarded or stored.

Bush fires. Fires set deliberately to clear forest or pasture for agricultural purposes may go
out of control and consume far more than intended.

Earthquakes. Earthquakes results from sudden violent movements of the earth’s surface,
sometimes causing massive loss of lives and property due to building collapse.

Invasive Species. A non-native plant or animal that invades a habitat or bioregion with
adverse economic, environmental, and/or ecological effects. An example is a grass that is
dominating pasture in the Rwenzori sub-region, reducing the grazing capacity of the land.

                                             Bundibugyo District Hazard, Risk, and Vulnerability Profile   31
Available online: http://www.necoc-opm.go.ug/ All Rights Reserved © 2016 The Republic of Uganda
You can also read