Mapping the Digital Divide: Before, During, and After COVID-19

Page created by Debbie Parks
 
CONTINUE READING
Mapping the Digital Divide: Before, During, and After COVID-19
Mapping the Digital Divide:
                          Before, During, and After COVID-19
             Francesco Bronzino       Nick Feamster, Shinan Liu, James Saxon     Paul Schmitt
         Université Savoie Mont Blanc         University of Chicago          Princeton University

Abstract                                                                access to broadband Internet access. Many of those who do
                                                                        have access do not have access to unlimited Internet access
    The digital divide—and, in particular, the homework gap—            plans.
have been exacerbated by the COVID-19 pandemic, laying                      With the rise of the COVID-19 pandemic, the problem
bare not only the inequities in broadband Internet access but           has never been more immediate or important: Questions
also how these inequities ultimately affect citizens’ ability           of inequity have become more acute in recent months, as a
to learn, work, and play. Addressing these inequities ulti-             global pandemic has caused shifts in patterns of education,
mately requires having holistic, “full stack” data on the na-           work, and life that involve increased dependency on high-
ture of the gaps in infrastructure and uptake—from the phys-            speed broadband Internet access from home—for example,
ical infrastructure (e.g., fiber, cable) to speed and application       with increased dependence on remote learning and remote
performance to affordability and neighborhood effects that              caregiving—at the very time that the network itself is experi-
ultimately affect whether a technology is adopted. This paper           encing increased load.
surveys how various existing datasets can (and cannot) shed                 An important step towards addressing this inequity in-
light on these gaps, the limitations of these datasets, what we         volves developing a deep, holistic understanding of avail-
know from existing data about how the Internet responded to             able broadband Internet access in the United States. Beyond
shifts in traffic during COVID-19, and—importantly for the              simply “speed tests”, reliable, usable Internet access depends
future—what data we need to better understand these prob-               on a holistic set of factors, including (1) physical connectiv-
lems moving forward and how the research community, pol-                ity (location of fiber and cable); (2) network throughput, la-
icymakers, and the public might gain access to various data.            tency, and packet loss; (3) application performance metrics;
                                                                        (4) other various non-technical data, including pricing data,
1 Introduction                                                          information about subscription rates, penetration, and adop-
                                                                        tion, and so forth.
    The Federal Communications Commission (FCC) has reg-                    First, we explore the current nature of these metrics, sur-
ularly suggested that educational and economic opportunity              veying the available data sources on these topics as well as the
increasingly depends on the availability of affordable, high-           various shortcomings of various datasets. We focus on the
speed Internet access. One aspect of this is the “homework              current state of various data sources, including the state of
gap”, referring to the barriers that students face when work-           physical connectivity, network throughput and performance
ing on homework assignments without reliable Internet ac-               metrics, interconnection measurements, and application per-
cess at home. As schools increasingly incorporate Internet-             formance metrics, noting in particular what these datasets
based learning into the curriculum, students become increas-            can—and cannot—tell us about the current state of the digital
ingly dependent on reliable Internet access to succeed.                 divide.
    In 2009, the FCC’s Broadband Task Force reported that                   Second, with the above metrics and analysis on historical
about 70% of teachers assign homework that require access               data as a baseline, the second part of the paper explores how
to broadband Internet access, and that about 65% of students            the Internet responded under unprecedented shifts in traffic
use the Internet at home to complete their homework, includ-            load as a result of the COVID-19 pandemic. We study the ef-
ing submitting assignments, working on shared projects, and             fects of the shifts in traffic load resulting from the COVID-19
communicating with teachers. As of 2018, 24 million Ameri-              pandemic on network utilization and network performance,
cans have no access at all to high-speed Internet access, and           noting how various aspects of the network infrastructure
12 million Americans face the so-called homework gap; 25%               adapted to shifts in traffic load during COVID-19.
of US households with children under 8 years old do not have

                                                                    1

                              Electronic copy available at: https://ssrn.com/abstract=3786158
Mapping the Digital Divide: Before, During, and After COVID-19
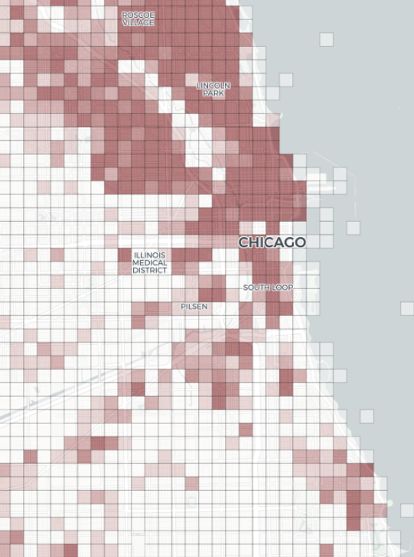
Third, we highlight gaps in existing datasets, in particular       proach of the Federal Communication Commission’s Mea-
how existing public datasets do not shed light on application          suring Broadband America (MBA) program. Measuring from
quality of experience and, ultimately, user experience. To-            the router mitigates some of the problems of client-based test-
wards filling this gap, we propose mechanisms for gathering            ing
data along these dimensions, first at a hyper-local, neighbor-
hood level, but ultimately with an eye towards scaling up a            2.1.2   Passive Quality Measurements
national infrastructure that can provide a more holistic view
into these dimensions.                                                 In addition to speed tests, an emerging class of performance
                                                                       measurements are passive application performance infer-
                                                                       ence tools, which passively survey network traffic and infer
2 How We Map Internet Coverage                                         the quality of experience of an application based on various
    The coronavirus pandemic forced daily routines into vir-           properties of the traffic (e.g., segment arrival time, down-
tual spaces. As both work and learning went remote, policy-            stream throughput utilization). Quality of experience met-
makers around the country have sought to address ongoing               rics generally entail the following four quality of experience
inequities in Internet connectivity, suddenly more acute than          metrics: (1) startup delay, or the time to start playing the
ever. Data sources on Internet connectivity have substantial           video; (2) rebuffering, or whether the video has experienced
limitations in measuring inequity. In this Section, we high-           an interruption in playback; (3) video resolution; (4) changes
light these limitations while demonstrating what can never-            in resolution. The last two metrics concerning resolution
theless be done with the data.                                         are related, although because the problem is based on sta-
                                                                       tistical inference, sometimes models can more accurately de-
2.1 Existing Metrics                                                   tect a change in resolution than the actual resolution (or vice
    Various metrics exist on the state of broadband Internet           versa).
connectivity. Each of these metrics provides a partial view of              Passive measurement techniques introduce various
the state of connectivity—or, in some cases, lack thereof. We          tradeoffs. On the one hand, because they involve inferring
briefly survey these metrics below, organizing the discussion          performance directly from existing network traffic, they can
into (1) performance measurements (of which speed tests are            provide an accurate reflection of the performance of appli-
perhaps the most common instance); and (2) survey-based                cations as they are actually used, as well as an estimate of
methods.                                                               quality parameters that correspond to the performance of
                                                                       that application. The passive nature of the measurements
2.1.1   Performance Measurements                                       also eschews the need for bespoke active measurement tests
                                                                       that are specific to applications (e.g., web, streaming video,
A common way to measure Internet connectivity is via per-
                                                                       gaming), as well as dedicated test infrastructure for each of
formance measurements. There are various types of perfor-
                                                                       those tests that is representative of the user experience when
mance measurements: the most common of these are “speed
                                                                       using those applications. On the other hand, these methods
tests”, which actively measure the performance of the net-
                                                                       face various deployment barriers, as we discuss in the subse-
work, in many cases by saturating a network link. Speed
                                                                       quent section.
tests can be router-based or client-based; client-based speed
tests can be browser-based or native. Most commonly, speed
tests measure network characteristics such as throughput, la-          2.1.3   Interconnection Data
tency, and packet loss. Some speed tests also measure the              Previous efforts have made it possible to explore utilization
performance of specific applications, such as web page load            of Internet interconnection points between access ISPs and
time or video streaming, although those types of tests are             content providers. In particular, previous work has analyzed
typically less common in active speed testing applications.            the utilization and provisioning of interconnection measure-
    Router-based speedtests, which measure the perfor-                 ment points using IPFIX-based traffic measurements and
mance of the network directly from the router—particularly             SNMP polling data, respectively. Data from the Intercon-
those that use multiple connections to test the throughput             nection Measurement Project in particular makes the follow-
of the connection—typically produce more accurate results              ing statistics available: (1) timestamps at five-minute inter-
and are now a commonly accepted standard way of measur-                vals; (2) geographic region; (3) anonymized partner network
ing the performance of the access ISP. These tests were pi-            (e.g., content delivery network, application service provider);
oneered in 2010 and remain the standard measurement ap-

                                                                   2

                             Electronic copy available at: https://ssrn.com/abstract=3786158
Mapping the Digital Divide: Before, During, and After COVID-19
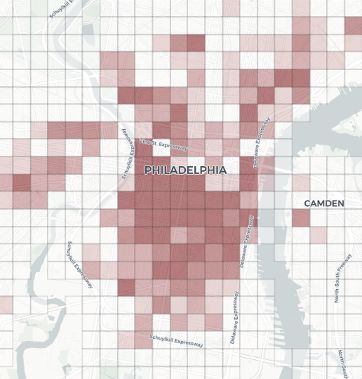
(4) access ISP; (5) total ingress bytes; (6) total egress bytes;
(7) capacity.
                                                                                           1.0

                                                                           Has Broadband
     Such data makes it possible to observe both utilization
rates and how ISPs have provisioned and augmented capac-                                   0.8
ity over various periods of time. The data provides helpful
perspective in understanding the extent to which provision-                                0.6
ing between access ISPs and peer networks is sufficient to
sustain traffic demands, as well as how providers have re-                                 0.4
sponded over time to increases in traffic demands. As we
will see in Section 3, this data provides helpful perspective in
understanding how certain service providers responded in                                               10        11        12
the face of considerable shifts in traffic demands as a result                                   Log Median Household Income
of the COVID-19 pandemic.
                                                                       Figure 1: Census tract median household income versus share of
2.1.4   Surveys                                                        households with broadband Internet, in Chicago. A lowess curve is
                                                                       drawn. The linear correlation is 0.82.
In the American Community Survey (ACS) the US Census Bu-
reau asks respondents whether they have broadband Inter-
net; for the National Telecommunications and Information               work path introduce performance bottlenecks. Some notable
Administration (NTIA) supplement to the Current Popula-                issues include the following:
tion Survey (CPS), they gather both data on connectivity and
online behaviors. While the US Census Bureau is the ”gold                  • At speeds above 100–200 Mbps, browser-based
standard” of survey methodology, the question of broadband                   speedtests can produce inaccurate results, due to the
access is coarse: the presence of a nominal, 25/3 Mbps con-                  fact that the browser itself becomes a performance bot-
tract. Wealthy Americans have enjoyed higher bandwidths                      tleneck.
over time; it is not possible to understand relative changes
on the intensive margin (consumption or bandwidth) using                   • On older phones, the cellular radio itself can introduce
the ACS or the CPS. Unfortunately, subtlety is not required:                 a performance bottleneck, if the WiFi radio is not ca-
neighborhood economic indicators are strongly predictive of                  pable of transmitting at rates that exceed that of the
broadband contracts. In Chicago for instance, the tract-level                access network.
correlation between log median household income and the                    • In the case of a home network, the home WiFi network
share of households with a broadband contract is 0.82, as can                itself can introduce performance bottlenecks due to old
be seen in Figure 1. The CPS/NTIA data are not designed for                  equipment, a poorly placed WiFi access point, or other
use below the state-level, but microdata allow breakdowns                    factors.
by race, ethnicity, and poverty status.
2.2 Limitations of Existing Methods                                    Test design. The design of the test itself can also pose lim-
    The existing methods for characterizing access network             itations. The Network Diagnostic Test (NDT), used as the
performance face various limitations. We now survey vari-              underlying tool in the Measurement Lab tests, for example,
ous limitations concerning test methods, sampling, and de-             has long used a single TCP connection to test network speeds.
ployment barriers.                                                     Such a test has failed to successfully saturate links as low as
                                                                       10 Mbps, particularly if the link has any amount of packet loss.
                                                                       Despite the known shortcomings of the tool, it has continued
2.2.1   Test Environment and Methods
                                                                       to be used in an attempt to demonstrate the performance of
Network environment. Client-based speed tests have a                   ISP networks, when today more often than not the tool itself
number of limitations. One of those limitations is that, as ac-        is the bottleneck.
cess network speeds have increased, the speed test itself is
less likely to be measuring the speed of the access link, and          Test infrastructure. The infrastructure that supports the
far more likely to be measuring the speed of some other as-            test may also introduce limitations, if it is incapable of sup-
pect of the end-to-end path, as other elements along the net-          porting the speeds required to test the speed of the access

                                                                   3

                             Electronic copy available at: https://ssrn.com/abstract=3786158
link for a large number of tests. In the past, the Measure-                  0.14         Census: Total Population
ment Lab infrastructure has suffered from a lack of available                             Census: Broadband-Weigthed
server endpoints (especially as compared to approaches that                  0.12         Ookla Devices
use similar methods such as Ookla, which have an order of                    0.10
magnitude more servers). The same infrastructure has also
                                                                             0.08
suffered performance limitations due to the underlying net-
work infrastructure which resulted in packet losses under                    0.06
switch microbursts, resulting in data from the FCC’s MBA                     0.04
program that had to be invalidated.
                                                                             0.02
2.2.2   Sample Limitations                                                   0.00
                                                                                 8.5   9.0 9.5 10.0 10.5 11.0 11.5 12.0 12.5
Sampling bias. Objective measures of real-world perfor-                                   Log of Tract Median Household Income
mance could shed light on differences in online behaviors                                        (a) Ookla / Chicago
or infrastructures by community. For this purpose, we can
examine data from SamKnows whiteboxes or distributed                         0.14         Census: Total Population
measurements from Oookla speedtests, newly-released as                                    Census: Broadband-Weighted
                                                                             0.12         SamKnows Households
Open Data [12]. The SamKnows data includes many mea-
sures of performance including bandwidth and consumption,                    0.10
and the Ookla speedtest measures bandwidth and latency.                      0.08
The challenge with these data is that they are highly non-
                                                                             0.06
representative. The sampling frame for the SamKnows data
was stratified by ISP and speed tier (SamKnows worked with                   0.04
ISPs to under-represented speed cells), rather than accord-                  0.02
ing to population demographics [6]. While no demographic
                                                                             0.00
indicators are provided, block group or tract of residence is                    8.5   9.0 9.5 10.0 10.5 11.0 11.5 12.0 12.5
available for 94% of the households included in the 2018 re-                              Log of Tract Median Household Income
port. If we aggregate block groups to the tracts that con-                                       (b) SamKnows / US
tain them, we can compare tract median household income
between SamKnows residences to the American population                   Figure 2: Normalized distribution of Census tract median household
(Figure 2). This reveals a significant offset: a log difference of       income, weighted population counts, or for Ookla devices or Sam-
0.13, implying incomes 14% higher in SamKnows “neighbor-                 Knows WhiteBox households. The dotted lines weight Census popu-
hoods.”                                                                  lations by the share of neighborhood households with a broadband
                                                                         Internet contract.
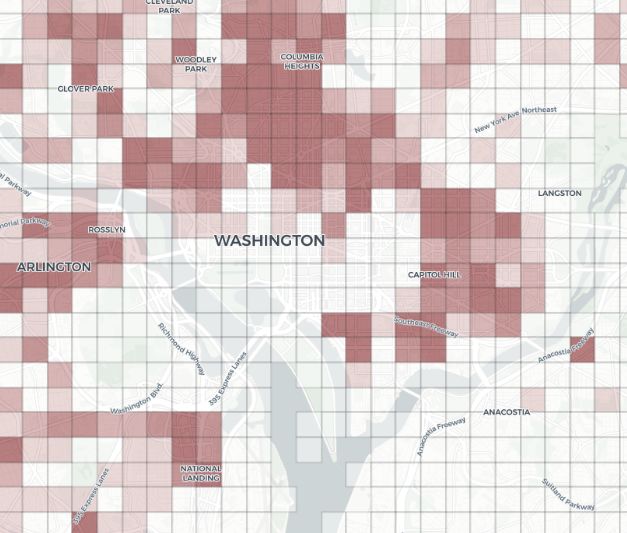
     A similar effect is apparent in the Ookla data. The Ookla
data are provided publicly as quad tiles (zoom level 16), which
are are roughly half a kilometer at the equator. These do not            conditional on having Internet. One can further see these
map neatly to Census geographies, but given the small tiles              neighborhood effects when exploring this data geographi-
we can allocate them approximately. We assign each device                cally, as shown in Figure 3.
from each quad tile in Chicago to a random point within its                  In short, both state-of-the-art distributed measurements
tile; we then merge these generated points to Census tracts.             and official FCC samples are systematically blind to vulnera-
This rough measure of the population of devices can then be              ble populations, who do not run speedtests or volunteer for
contrasted with the Census, by median household income, as               FCC measurements.
above.                                                                       Though we emphasize the significant limitations of the
     Just as for the SamKnows data, the devices are recorded in          data, it is possible to contrast performance over the course of
neighborhoods that are markedly wealthier than the general               the coronavirus pandemic, by neighborhood, for SamKnows
population of Chicago. The obvious reason for this is that the           households. We first divide the SamKnows sample into three
general population does not all have Internet. However, if we            categories by neighborhood income – bottom quartile, mid-
weight Census populations by the share of households with                dle quartiles, and highest quartile of the SamKnows sample.
Internet, the gap remains significant. This suggests that peo-           We then plot consumption and speed over time. Within each
ple in affluent areas are more likely to run speed tests, even

                                                                     4

                              Electronic copy available at: https://ssrn.com/abstract=3786158
(c) Washington
                                                                                                  (b) Philadelpha

                                      (a) Chicago

Figure 3: The number of Ookla Speedtests performed during Q3 2020 for three major U.S. cities shows how the test samples vary by geography
(and demographic).

                                                                                                                                 10                                                                  1.0                                           Income Level
                                                                                   Income Level                                                                                                                                                         Upper

                                                                                                                                                                              Transmitted [GB/day]
                                                                                                                                  8                                                                  0.8
                                                                                        Upper
                                                                                                             Received [GB/day]

                                                                                                                                                                                                                                                        Middle
                          200
   Speed [Mbytes / sec]

                                                                                                                                  6                                                                  0.6                                                Lower
                                                                                        Middle
                          150                                                           Lower                                     4                                                                  0.4
                                                                                                                                  2                                                                  0.2
                          100                                                                                                     0Nov Dec                                                           0.0Nov Dec
                                                                                                                                           2020 Feb Mar Apr May Jun Jul Aug                                     2020 Feb Mar Apr May Jun Jul Aug
                           50
                            0                                                                                 Figure 5: Received and transmitted data, measured by SamKnows
                            Nov Dec   2020   Feb Mar   Apr May   Jun   Jul   Aug                              for low (first-quartile), medium (middle quartiles), and high-income
                                                                                                              tracts. Quartiles are of the SamKnows population. For each segment of
Figure 4: Bandwidth measured by SamKnows data for low (first-                                                 the population the three lines show the first, second and third quartiles
quartile), medium (middle quartiles), and high-income tracts. Quar-                                           of consumption by day.
tiles are of the SamKnows population. For each segment of the popula-
tion the three lines show the first, second and third quartiles of band-
width.                                                                                                        need for demographically-attuned measurement of Internet
                                                                                                              performance and use.

income group, we plot the 1st quartile, median, and 3rd quar-                                                 2.2.3                        Deployment Barriers
tile of the distribution, from November 2019 until the most-
recent release, August 2020. These effects are shown in Fig-                                                 On the other hand, passive collection of application perfor-
ure 4.                                                                                                       mance information introduces a unique set of challenges
     Conditional on having Internet, households from wealthy                                                 since it requires collecting traffic from the network. This ap-
neighborhoods do in fact purchase higher-bandwidth plans,                                                    proach introduces both challenges of technical instrumenta-
as shown in Figure 5. On the other hand, it is somewhat                                                      tion and privacy. First, gathering this type of data from a
surprising to find that from the perspective of consump-                                                     home network requires collecting traffic in the home, which
tion households in lower income communities tend to use                                                      can require extensive instrumentation of the network itself.
moderately more Internet, across the distribution (i.e., at all                                              A typical home might require a modem, router, and WiFi ac-
three quartiles). These results remain somewhat inconclu-                                                    cess point, in many cases this functionality is combined in
sive given the limitations of the data, but they underscore the                                              a single device—sometimes one provided by the ISP, but in

                                                                                                        5

                                                         Electronic copy available at: https://ssrn.com/abstract=3786158
ISP A
                                                                                                                   ISP B
                                                                                                   500000

                                                                          Peak hour usage (Mbps)
                                                                             (99th percentile)
                                                                                                   400000

                                                                                                   300000
Figure 6: Passive application performance inference requires exten-
                                                                                                   200000
sive network instrumentation, posing a significant deployment bar-
rier.
                                                                                                   100000

any case one that is readily available. Unfortunately, these                                             0

                                                                                                         20 4
                                                                                                         20 7
                                                                                                         20 0
                                                                                                         20 1
                                                                                                         20 4
                                                                                                         20 7
                                                                                                              -10
existing devices do not typically make it easy or possible to

                                                                                                              -0
                                                                                                              -0
                                                                                                              -1
                                                                                                              -0
                                                                                                              -0
                                                                                                              -0
                                                                                                           18
                                                                                                           18
                                                                                                           18
                                                                                                           19
                                                                                                           19
                                                                                                           19
                                                                                                           19
                                                                                                           20
                                                                                                           20
                                                                                                           20
                                                                                                           20
                                                                                                    20
capture network traffic, especially at line rate.                                                                                       Month
     As a result, capturing such traffic requires the level of
instrumentation shown in Figure 6, whereby an additional                                                                 (a) Absolute utilization.
switch and capture device are interposed between the router
and the WiFi access point. Additionally, the user’s WiFi ac-                                                   ISP A
                                                                                                               ISP B
cess point must be configured in bridge mode (the default                                          1.0
                                                                          Peak hour usage (Mbps)
configuration of many WiFi access points is often to act as                  (99th percentile)
the router). This configuration is necessary because traffic                                       0.9
capture requires the capability to mirror all traffic seen on a
switch port to a capture device, and consumer-grade routers                                        0.8
and WiFi access points typically do not provide this capabil-
                                                                                                   0.7
ity. Such instrumentation can prove prohibitive, particularly
for non-technical users.
                                                                                                   0.6
     Furthermore, this measurement technique and instru-
mentation introduce potential privacy concerns, given that
                                                                                                   0.5
the method requires capture of passive traffic. In our own pre-
                                                                                                   -04

                                                                                                             -07

                                                                                                                   -10

                                                                                                                           -01

                                                                                                                                 -04

                                                                                                                                       -07

                                                                                                                                             -10

                                                                                                                                                     -01

                                                                                                                                                           -04

                                                                                                                                                                 -07

                                                                                                                                                                       -10
vious work, we have designed such techniques to collect the
                                                                                              18

                                                                                                         18

                                                                                                               18

                                                                                                                       19

                                                                                                                              19

                                                                                                                                    19

                                                                                                                                           19

                                                                                                                                                 20

                                                                                                                                                       20

                                                                                                                                                             20

                                                                                                                                                                   20
                                                                                          20

                                                                                                         20

                                                                                                              20

                                                                                                                       20

                                                                                                                            20

                                                                                                                                   20

                                                                                                                                         20

                                                                                                                                                20

                                                                                                                                                      20

                                                                                                                                                            20

                                                                                                                                                                  20
minimum amount of data that is necessary to infer applica-                                                                             Month
tion performance characteristics, but the technique nonethe-
less may be perceived to be invasive by some. This concern is                                                          (b) Normalized utilization.
particularly acute in light of the sampling questions in earlier
                                                                             Figure 7: 99th percentile interconnect link utilization for two ISPs.
sections, given that portions of the demographic that are not
as well-represented in other datasets may also
                                                                          datasets or, more generally, a lack of accepted method for
3 The Internet During COVID-19                                            measuring metrics of interest.
    Internet traffic patterns shifted dramatically at the start           3.1 What We Know
of the COVID-19 pandemic, as people increasingly began to
                                                                              Available datasets can tell us about how various network
work from home. Various reports have documented how dif-
                                                                          metrics, such as throughput and latency fared over the course
ferent aspects of the Internet infrastructure responded dur-
                                                                          of the pandemic, how these how these metrics varied across
ing this time period [1, 3, 8, 10]. In this section, we briefly
                                                                          ISPs, and how the effects of the pandemic compare to other
survey what we know about how the Internet responded
                                                                          exogenous “shocks” (e.g., the holiday season, when home In-
from public data, additional information we know from semi-
                                                                          ternet use also tends to experience a surge). In this section,
public datasets (e.g., interconnect data), and various things
                                                                          we briefly survey what we know from these datasets. These
we do not know either due to a lack of available public
                                                                          results are also covered in more detail in a corresponding
                                                                          technical publication [9].

                                                                      6

                               Electronic copy available at: https://ssrn.com/abstract=3786158
rapidly during a short window of one week. In the United
                                                                                                                            States, downstream peak traffic has recently stabilized [11],
                                                                                                                            but in the early weeks of the pandemic, it showed a growth
                                                         Pearson : 0.988997                                                 of 20.1%. Wireless networks saw volume increases of up to
Peer peak download rate on Apr 15 2020

                                         1015            p-value: 0.0000
                                                                                                                            12.2% for voice and 28.4% for data by the top four providers
                                         1014
                                                                                                                            were shown in an industry report [4]. Industry opera-
                                         1013                                                                               tors have self-reported on their network responses largely
                                                                                                                            through blog posts [1, 3, 8, 10]. Facebook found that de-
                                         1012
                                                                                                                            veloping regions experienced more significant performance
                                         1011                                                                               degradations [2]. Network latencies were approximately 30%
                                                                                                                            higher during the lockdown in Italy [7]. According to an
                                         1010
                                                                                                                            NCTA report, networks in the United States saw less conges-
                                            109                                                                             tion [11].
                                            108
                                                                                                                            Traffic patterns increased at interconnection points.
                                            107                                                                             We consider peak-hour link utilization from the Interconnect
                                            106 6                                                                           Measurement Project as a measure of traffic demand [5]. We
                                               10         107     108     109 1010 1011 1012 1013 1014 1015                 pre-processed the interconnect dataset and remove anoma-
                                                          Peer peak download rate on Jan 15 2020
                                                                                                                            lous data points that are caused by failures in the measure-
                                                                                                                            ment system. Figure 7 shows both the absolute utilization
                                                                              (a) Peak download.
                                                                                                                            and the utilization normalized against the link capacity for
                                                                                                                            two anonymized ISPs. For each ISP, we show the value cor-
                                                                                                                            responding to the 99th percentile link utilization for a given
                                                          Pearson : 0.983095                                                day. Figure 7a shows that ISP A experienced increase con-
                                                 1014
                                                          p-value: 0.0000                                                   current with the initial COVID-19 lockdowns (early March
          Peer peak upload rate on Apr 15 2020

                                                 1013                                                                       2020); ISP B saw a smaller raw increase in utilization. Fig-
                                                                                                                            ure 7b also shows that both ISPs experienced significant in-
                                                 1012                                                                       creases in normalized utilization in March–April 2020.
                                                 1011
                                                                                                                            Traffic ratios changed for some peers. We also com-
                                                 1010                                                                       pared the peak hour download and upload rates on all of ISP
                                                                                                                            A’s interconnects on (1) January 15, 2020, and (2) April 15,
                                                 109                                                                        2020 (Figure 8). Traffic volumes to (and from) some peers
                                                 108
                                                                                                                            change significantly—some by several orders of magnitude.
                                                                                                                            Such drastic changes may be attributable to users working
                                                 107                                                                        from home and connecting to services that would cause more
                                                                                                                            traffic to traverse the peer link in the upstream direction. We
                                                 106 6                                                                      confirmed these results with the operators at ISP A and report
                                                    10      107         108    109   1010   1011   1012   1013   1014
                                                                Peer peak upload rate on Jan 15 2020                        that they observed that streaming video traffic decreased
                                                                                                                            from 67% to 63% of the total traffic, but video conferencing
                                                                                (b) Peak upload.                            increased from 1% to 4% as a percentage of overall traffic.

Figure 8: Peer link utilization for ISP A between January 15 to April
                                                                                                                            Some ISPs experienced higher latency, particularly in
15, 2020.
                                                                                                                            the tail. Figures 9 shows the 95th percentile of round-trip
                                                                                                                            latency across the SamKnows Whiteboxes in the FCC Mea-
Traffic volumes increased in general. Traffic surged                                                                        suring Broadband America before and during the COVID-19
about 20% in Europe for broadband networks [7]; the same                                                                    lockdown. These results show that, overall 95th percentile
study found that the fixed-line Internet infrastructure was                                                                 latency across most ISPs remained stable. We also studied
able to sustain the 15–20% increase in traffic that happened                                                                99th percentile latency which did show some deviations from

                                                                                                                        7

                                                                                     Electronic copy available at: https://ssrn.com/abstract=3786158
100         Verizon
      Average RTT (milliseconds)

                                               Optimum
                                   80          Mediacom
                                               Charter
                                   60
                                   40
                                   20
                                    0
                                     201 2-01
                                     201 2-11
                                     201 2-21
                                     202 2-31
                                     202 1-10
                                     202 1-20
                                     202 1-30
                                     202 2-09
                                     202 2-19
                                     202 2-29
                                     202 3-10
                                     202 3-20
                                     202 3-30
                                     202 4-09
                                     202 4-19
                                     202 4-29
                                     202 5-09
                                     202 5-19
                                     202 5-29
                                     202 6-08
                                     202 6-18
                                                8
                                            6-2
                                        9-1
                                        9-1
                                        9-1
                                        9-1
                                        0-0
                                        0-0
                                        0-0
                                        0-0
                                        0-0
                                        0-0
                                        0-0
                                        0-0
                                        0-0
                                        0-0
                                        0-0
                                        0-0
                                        0-0
                                        0-0
                                        0-0
                                        0-0
                                        0-0
                                        0-0
                                   201

                                                                                              Dates
                                                                     (a) 95th percentile of ISP latency (Group 1).

                                   100         Comcast
      Average RTT (milliseconds)

                                               AT&T
                                   80          Cox
                                   60
                                   40
                                   20
                                    0
                                          1
                                           201 2-11
                                           201 2-21
                                           202 2-31
                                           202 1-10
                                           202 1-20
                                           202 1-30
                                           202 2-09
                                           202 2-19
                                           202 2-29
                                           202 3-10
                                           202 3-20
                                           202 3-30
                                           202 4-09
                                           202 4-19
                                           202 4-29
                                           202 5-09
                                           202 5-19
                                           202 5-29
                                           202 6-08
                                           202 6-18
                                                      8
                                         2-0

                                                  6-2
                                     9-1
                                              9-1
                                              9-1
                                              9-1
                                              0-0
                                              0-0
                                              0-0
                                              0-0
                                              0-0
                                              0-0
                                              0-0
                                              0-0
                                              0-0
                                              0-0
                                              0-0
                                              0-0
                                              0-0
                                              0-0
                                              0-0
                                              0-0
                                              0-0
                                              0-0
                                   201
                                         201

                                                                                              Dates
                                                                     (b) 95th percentile of ISP latency (Group 2).

                                                              Figure 9: Latency (95th percentile) for different ISPs.

normal levels during lockdown for certain ISPs. Notably, in                                    links associated with the ISP. To enable comparison between
many cases the same ISPs experienced deviations in latency                                     ISPs that may have more or less infrastructure overall, we
during other periods of time, as well (e.g., during the Decem-                                 normalize the capacity values for each using min-max nor-
ber holidays), suggesting that even in the tail, latency effects                               malization. We again filter out date values that are beyond
of COVID were not overly pronounced. These results are                                         two standard deviations from a rolling 60-day window mean.
likely explained, at least in part, by ISP capacity augmenta-                                  A linear regression yields a slope for each quarter that illus-
tion.                                                                                          trates the best-fit rate of capacity increases over that quarter.
                                                                                               We scale the slope value to show what the increase would be
ISPs responded to changes in traffic demands by aug-                                           if the rate of increase was maintained for 365 days (i.e., a slope
menting capacity. Using the Interconnection Measure-                                           of 1 would result in a doubling of capacity over the course of
ment Project dataset, we calculate the total interconnect ca-                                  a year). Figure 10 shows the resulting capacity plots. The
pacity for each ISP by summing the capacities for all of the                                   overall trend shows how these two ISPs in the United States

                                                                                          8

                                                    Electronic copy available at: https://ssrn.com/abstract=3786158
1.0                                                                                   well the Internet is performing for users within the context
                                                                                                          0.76
Capacity (min-max normalized)

                                                                                                                      of the applications they are trying to use. Unfortunately, for
                                                                                                   0.81               reasons previously mentioned, obtaining application perfor-
                                0.8
                                                                                                                      mance and quality of experience metrics at scale can be chal-
                                                                                            0.72                      lenging because doing so requires either instrumentation of
                                0.6
                                                                                                                      specific applications or (as previously discussed) invasive
                                                                                    -0.05                             network instrumentation coupled with statistical inference
                                0.4                                          0.22
                                                                    0.25                                              techniques to infer application quality. An open challenge
                                                            0.33                                                      for the policy community is thus reconciling the importance
                                0.2                  0.33                                                             of these types of metrics with the lack of these metrics in
                                       -0.16 0.16                                                                     publicly available datasets and the general inability to gather
                                0.0                                                                                   such publicly available datasets at scale. An alternative ap-
                                                                                                                      proach may be to first design such measurements to be “hy-
                                 -04

                                       -07

                                              -10

                                                     -01

                                                            -04

                                                                    -07

                                                                             -10

                                                                                    -01

                                                                                            -04

                                                                                                   -07

                                                                                                            -10
                          18

                                       18

                                              18

                                                     19

                                                            19

                                                                   19

                                                                             19

                                                                                    20

                                                                                            20

                                                                                                   20

                                                                                                          20
                                                                                                                      per local”, as we discuss in Section 4, and then determine how
                20

                                      20

                                            20

                                                   20

                                                          20

                                                                 20

                                                                        20

                                                                                  20

                                                                                         20

                                                                                                 20
                                                                     Month                              20            to scale them more generally.
                                                                 (a) ISP A
                                                                                                                      Measurements at fine spatial and temporal granular-
                                                                                                          -0.08
                                1.0                                                                0.64               ity. Critics are often quick to point out that aggregates
Capacity (min-max normalized)

                                                                                                                      ”hide” outliers. For this reason, much of our analysis in this
                                0.8                                                                                   paper and other related work has focused on the 95th and
                                                                                            1.28                      99th percentiles, as well as exploration of outlier statistics.
                                0.6                                                                                   Aggregates can still be necessary and useful: not only can
                                                                                    0.72                              they serve as helpful summary statistics but also in some
                                0.4                                          0.27                                     cases (e.g., with interconnection data), aggregation is a con-
                                                                    0.39                                              dition to publicly sharing data that might otherwise be pri-
                                                            0.43                                                      vate. The issue, then, is not to necessarily avoid aggregates
                                0.2                  0.18
                                              0.35                                                                    altogether but rather to be very clear on what these statis-
                                       0.26
                                0.0                                                                                   tics can and cannot tell us. One particular limitation of the
                                                                                                                      interconnection data we have presented, for example, is that
                                 -04

                                       -07

                                              -10

                                                     -01

                                                            -04

                                                                    -07

                                                                             -10

                                                                                    -01

                                                                                            -04

                                                                                                   -07

                                                                                                            -10

                                                                                                                      is does not tell us whether particular isolated or short-lived
                          18

                                       18

                                              18

                                                     19

                                                            19

                                                                   19

                                                                             19

                                                                                    20

                                                                                            20

                                                                                                   20

                                                                                                          20
                20

                                      20

                                            20

                                                   20

                                                          20

                                                                 20

                                                                        20

                                                                                  20

                                                                                         20

                                                                                                 20

                                                                                                        20

                                                                     Month                                            high-utilization events occurred on a particular interconnect;
                                                                                                                      the private dataset allows us to affirm this, but sharing data at
                                                                 (b) ISP B                                            finer granularity with the general public would permit more
                                                                                                                      thorough examination from the public. Second, and particu-
 Figure 10: Normalized interconnect capacity increases for two ISPs.                                                  larly important to the digital divide, many available datasets
                                                                                                                      do not permit an exploration of the data at block-level geo-
                                                                                                                      graphic granularity, yet many of the issues with infrastruc-
added capacity at more than twice the rate at which they were                                                         ture, performance, and broadband Internet adoption exist at
adding capacity over a comparable time period in the previ-                                                           that granularity.
ous year. Second, both ISPs significantly added capacity in
the first quarter of 2020—at a far greater rate than they were
                                                                                                                      How different communities fared. Related to the lack
adding capacity in the first quarter of 2019.
                                                                                                                      of fine spatial granularity in existing datasets is the lack of
3.2 What We Don’t Know                                                                                                information more generally about how various underserved
Application performance. Available public datasets                                                                    communities have fared with respect to Internet availability,
have little to say about how individual applications per-                                                             adoption, and performance. As discussed, existing survey-
formed, as well as user quality of experience when using                                                              based datasets ask questions about availability of broadband
those applications. Our inability to shed light on applica-                                                           Internet at extremely coarse granularity; that information is
tion performance and user quality of experience is somewhat                                                           not collected in a way that is specific to how Internet uptake
problematic, given that such metrics ultimately reflect how                                                           or performance fared during the pandemic, nor does it shed

                                                                                                                  9

                                                                  Electronic copy available at: https://ssrn.com/abstract=3786158
light on the quality of experience these users have faced when        References
attempting to use video conference applications (or other ap-
plications) as they have been forced to work, learn, and play          [1] AT&T. COVID-19: Our Response. https://about.att.
at home, especially within communities that have long faced                com/pages/COVID-19.html. accessed October, 2020.
barriers to Internet infrastructure.                                   [2] Timm Böttger, Ghida Ibrahim, and Ben Vallis. “How
                                                                           the Internet reacted to Covid-19 – A perspective from
4 Looking Ahead                                                            Facebook’s Edge Network.” In: ACM IMC. 2020.
     While existing datasets have allowed us to understand             [3] Comcast. COVID-19 Network Update. https://corpor
that the Internet infrastructure has held up very well during              ate.comcast.com/covid- 19/network/may- 20- 2020.
the pandemic, the current situation has amplified the dispar-              accessed October, 2020.
ities that have existed for a long time.                               [4] CTIA. The Wireless Industry Responds to COVID-19: Net-
     Ultimately, bridging this divide will require gathering               work Performance. https://www.ctia.org/homepage/
more holistic data about not only network performance, but                 covid - 19 # network - performance. accessed October,
also better information about application performance, user                2020.
quality of experience, and better data about uptake and adop-          [5] Nick Feamster. “Revealing Utilization at Internet In-
tion. Better data can ultimately drive investment and di-                  terconnection Points.” In: Conference on Communica-
rect policy, but doing so effectively requires knowing where               tions, Information, and Internet Policy (TPRC). Wash-
those problems lie, and what specifically is contributing to               ington, DC, Sept. 2016, pp. 1–10. uRl: https://papers.
these gaps in connectivity. Previous work has explored these               ssrn.com/sol3/papers.cfm?abstract_id=2756888.
problem from one dimension at a time, from the perspective
of Internet speed or surveys. Better data can also provide de-         [6] Federal Communications Commission. 2016 Technical
cision makers with insights so that they can make the best                 Appendix: Measuring Broadband America / Fixed Broad-
possible decisions about how to direct the resources and in-               band. Tech. rep. Washington, DC: FCC Office of Engi-
vestments An important aspect of this exercise is matching                 neering et al., 2016. uRl: https://data.fcc.gov/downl
the data inference and insights to the questions that policy                oad/measuring-broadband-america/2016/Technical-
makers are asking and need to know. Too often available                     Appendix-fixed-2016.pdf.
data is not responsive to the precise questions being asked by         [7] Anja Feldmann, Oliver Gasser, Franziska Lichtblau, En-
policymakers, yet is used anyway to advocate. In this case,                ric Pujol, Ingmar Poese, Christoph Dietzel, Daniel Wag-
we must seek data that go beyond merely providing evidence                 ner, Matthias Wichtlhuber, Juan Tapidor, Narseo Vallina-
that a problem exists towards insights that give us a deeper               Rodriguez, et al. “The Lockdown Effect: Implications
understanding of the true causes of the problems.                          of the COVID-19 Pandemic on Internet Traffic.” In: In-
     Initially, our focus on improved datasets involves going              ternet Measurement Conference (IMC ’20). 2020.
deeper into a few communities in Chicago to deeply under-              [8] Google. Keeping our network infrastructure strong amid
stand the many dimensions of this problem, including physi-                COVID-19. https://blog.google/inside-google/inf
cal infrastructure, network availability and performance, ap-               rastructure/keeping-our-network-infrastructure-
plication quality of experience, and other factors including                strong-amid-covid-19/. accessed October, 2020.
adoption and use within communities. We aim to develop
these new methods designing them in such a way that it                 [9] Shinan Liu, Paul Schmitt, Francesco Bronzino, and Nick
serves as a rubric that can be replicated and scaled from a                Feamster. “Characterizing Service Provider Response
few communities to cities, and ultimately to nations.                      to the COVID-19 Pandemic in the United States.” In:
                                                                           Passive and Active Measurement Conference (PAM). Bran-
Acknowledgments                                                            denburg, Germany, Mar. 2021, pp. 1–12. uRl: https :
                                                                           //www.pam2021.b-tu.de/.
This work was funded in part by National Science Foundation
                                                                      [10] Martin McKeay. Parts of a Whole: Effect of COVID-19
Award CNS-2028145. We thank CableLabs and members of
                                                                           on US Internet Traffic. https : / / blogs . akamai . com /
the Interconnection Measurement Project consortium for ac-
                                                                            sitr/2020/04/parts-of-a-whole-effect-of-covid-
cess to interconnection utilization and capacity data.
                                                                            19-on-us-internet-traffic.html. accessed October,
                                                                            2020.

                                                                 10

                            Electronic copy available at: https://ssrn.com/abstract=3786158
[11]   NCTA. COVID-19: How Cable’s Internet Networks Are
       Performing: METRICS, TRENDS & OBSERVATIONS. ht
       tps://www.ncta.com/COVIDdashboard. accessed Octo-
       ber, 2020.
[12]   Speedtest®by Ookla®. Global Fixed and Mobile Net-
       work Performance Maps. Based on analysis by Ookla
       of Speedtest Intelligence®data for Q3 2020. Provided
       by Ookla. Ookla trademarks used under license and
       reprinted with permission. uRl: https : / / registry .
       opendata.aws/speedtest-global-performance/.

                                                                11

                            Electronic copy available at: https://ssrn.com/abstract=3786158
You can also read