MVIS CryptoCompare Digital Assets Indices - MVIS Indices
←
→
Page content transcription
If your browser does not render page correctly, please read the page content below

June 2020

MVIS® CryptoCompare Digital Assets Indices

              MV Index Solutions GmbH
                 A VanEck Company

         No part of this material may be reproduced or referred to in any other publication without
                express written permission of MV Index Solutions. All rights are reserved.
Contents

    About MV Index Solutions                                             3
    Types of Digital Assets                                              5
    Digital Asset Investability Issues                                   6
    Digital Asset Investment Risks                                       7
    History of Digital Assets                                            8
    Digital Assets Marketplace                                           9
    Fair and Liquidity - Driven Global Price                             14
    Index Concept - Pricing                                              16
    Index Concept - Liquidity                                            17
    Index Concept - Diversification                                      18
    Index Concept - Diversification and Cap Factors                      19
    Index Concept – Forks                                                20
    Index Concept - Initial Coin Offering (ICO)                          22
    Custody                                                              24
    Index Summaries and Stats                                            25
    Contacts                                                             39
    Important Disclosures                                                40

2                                 No part of this material may be reproduced or referred to in any other publication without express
                                                   written permission of MV Index Solutions. All rights are reserved.
MV Index Solutions

MV Index Solutions (MVIS®) offers a focused selection of pure-play and investable indices designed to underlie high quality financial products.
They cover several asset classes including hard assets and international equity markets as well as fixed income markets. Clients include leading
financial institutions globally.
MVIS is the index business of VanEck, a US-based investment management firm and provider of the VanEck Vectors ETFs. Approximately USD
15.55 billion* in assets under management are currently invested in financial products based on MVIS Indices. Many of those products are the
largest in their investment category. MVIS also develops and maintains customized indices for third parties that aim to track specific investment
themes.

About CryptoCompare
CryptoCompare offers the most complete pricing and transaction data collected from digital asset exchanges. It provides data to a broad range of
digital asset natives, wallets, apps, traders and researchers, as well as helps its community of over 330,000 users track their portfolio, stay up to
date and discuss the latest news.

About VanEck
Founded in 1955 by John C. van Eck, Van Eck Associates Corporation was among the first U.S. asset managers helping investors achieve greater
diversification through global investing. Today, the firm continues this tradition by offering forward looking, intelligently designed investment
solutions in hard assets, emerging markets, precious metals including gold, asset allocation and other specialized, domestic and international asset
classes.

VanEck Funds is the actively managed business of VanEck. Our funds are designed for investors seeking innovative choices for portfolio
diversification; they are often categorized in asset classes having returns with low correlations to those of more traditional U.S. equity and fixed
income investments.

VanEck Vectors® ETFs is the exchange-traded fund (ETF) business of VanEck. Since the listing of VanEck’s first ETF in 2006, VanEck Vectors
ETFs have become one of the largest ETF brands in the U.S. and one of the most recognized ETF brands worldwide.

Headquartered in New York City, VanEck has a presence in other cities worldwide, including Shanghai (China), Frankfurt (Germany), Madrid
(Spain), Pfaeffikon SZ (Switzerland), Sydney (Australia) and Amsterdam (The Netherlands), and manages approximately USD 56.92 billion.*

*Data as of 30 June 2020

3                                   No part of this material may be reproduced or referred to in any other publication without express
                                                     written permission of MV Index Solutions. All rights are reserved.
MV Index Solutions
AUM in % by Index Category
Established in 2011 by VanEck
3.34% 0.00%
Objective of capturing important investment
opportunities that were being missed by traditional
indices
Introduction of blue chip indices with investability 29.48%
characteristics specifically designed to underlie
51.39%
exchange-traded products (ETPs)
The indices are built on three key factors
— pure-play exposure 15.79%
— component liquidity
— index diversification
Hard Asset Indices Country Indices
In combination, these factors ensure an intelligent Sector Indices Bond Indices
index design, tailor-made for ETPs Digital Assets Indices
MVIS manages 87 Indices among several asset AUM in USD by Index Category
classes:
— 24 Digital Asset Indices Index Category AUM (USD bn)
Hard Asset Indices 7.46
— 36 Country Indices
Country Indices 2.29
— 10 Hard Asset Indices Sector Indices 4.28
— 6 Bond Indices Bond Indices 0.48
Digital Assets Indices 0
— 10 Sector Indices
— 1 Speciality Index Data as of 30 June 2020
4 No part of this material may be reproduced or referred to in any other publication without express
written permission of MV Index Solutions. All rights are reserved.
Types of Digital Assets
Crypto Currency
— Cryptocurrencies, like traditional currencies, are meant to be a store of value
— Bitcoin (BTC) is the most widely recognized cryptocurrency, and has become known as a form of “digital
gold”
— Not all cryptocurrencies are currently an effective means to transact value
Platforms
— Platforms serve as a base layer that underlie and enable a wide variety of applications
— Ethereum (ETH), for example, is a platform with 30+ “product” applications being developed on it
— One might think about platforms as “fat protocols”
Applications
— Applications are specific use cases that enable the tracking of ownership, allocating resources or meet a
specific utility
— For example, IOTA is an application-based digital asset that is used to track internet of things devices and
measures communication traffic
— Applications are predominantly ICO-funded
5 No part of this material may be reproduced or referred to in any other publication without express
written permission of MV Index Solutions. All rights are reserved.
Digital Asset Investability Issues
Price
– Prices are trading platform dependent (i.e., exchange, no unified quotation system, no consolidated
tape)
– Trading platforms are independent of each other and active at various cycles of the day
– Not all digital assets trade against fiat currencies
– Pricing providers are most often not independent of trading platforms
– Solution: liquidity-weighted tape
Forks
– Exposure to a single digital asset necessitates exposure to subsequent forks and future evolutions
– Blockchain “corporate actions” require extensive research
– No rules-based fork treatment
– Solution: total return index that includes forks and index that can handle forks
Custody
– Counterparty risk of trading platforms (along with potential conflicts of interest, front running, lack of
transparency)
– High human/key person risk, dependency on trusting individuals at custody providers
– Solution: exchange traded instruments and best practices around custody (multiple shards, multiple
controls, insurance or balance sheet)
6 No part of this material may be reproduced or referred to in any other publication without express
written permission of MV Index Solutions. All rights are reserved.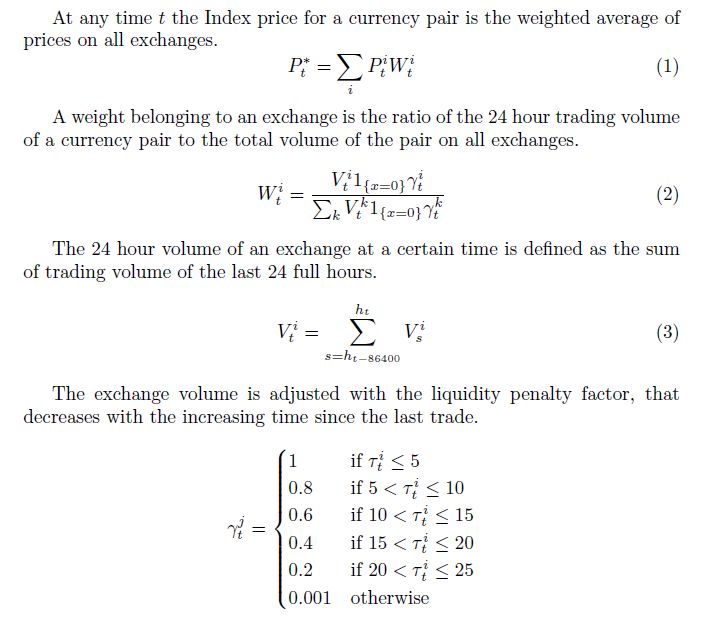
Digital Asset Investment Risks
Digital asset risks include:
Immaturity/extreme early stage of many applications
Hacking of trading platforms and participants in the life cycle of a trade (usually social engineering)
Unintentional coding error
Governance shortcomings
Can miners and developers “run” the “core” software? (Linux is a good example for successful execution)
Ecosystem design
Will payments continue to sustain processing and verification activities
Encryption vulnerability; developments in quantum computing (which would increase success of private key
hacking; credit cards more vulnerable nevertheless)
Price volatility
7 No part of this material may be reproduced or referred to in any other publication without express
written permission of MV Index Solutions. All rights are reserved.
History of Digital Assets

                           6000                                                                                                                                                                                      600

                           5000                                                                                                                                                                                      500

                                                                                                                                                                                                                           MARKTKAPITALISIERUNG (MRD USD)
                                                                                 # Digital Assets              Market Capitalization (billion USD)
NUMBER OF DIGITAL ASSETS

                           4000                                                                                                                                                                                      400

                           3000                                                                                                                                                                                      300

                           2000                                                                                                                                                                                      200
                                    Oct:
                                    Bitcoin.org         Oct: First
                                    and                 Bitcoin                                                                                                      Oct: MVIS
                           1000     whitepaper          exchange        Apr: Litecoin                                                                Jun: Market                                                     100
                                                                                                                              Feb: Enterprise                        launches first        Aug: Bakkt, a
                                    introduction        rate            introduction                                                                 Cap exceeds
                                                                                                       Jul: Ethereum          Ethereum Alliance                      family of Digital     NYSE-ICE digital
                                                        established                                                                                  USD 100 bn
                                                                                                       introduction           is born                                Assets Indices        asset exchange
                                                                                                                                                                                           opened.
                                0                                                                                                                                                                                    0

                               2008      2009         2010          2011 2012 2013 2014 2015                           2016                       2017                           2018                 2019
                               Jan: First         Feb: First real          Aug: XRP             Mar: NEM                 Oct: ZCash           May: Over 1000              Oct: Cardano      Nov: Bitcoin      Sept: Bakkt
                               Bitcoin            world                    introduction         introduction             introduction         different Digital           introduction      Satoshi’s         announced the
                               transaction        transaction                                   Dash                                          Assets in the market                          Vision            launch of futures
                                                  with Bitcoin                                  introduction                                                                                introduction.     and custody.
                                                                                                                                                                       Aug: Bitcoin Cash
                                                                                                                                                                       introduction

                           *Data as of 30 June 2020

                           8                                               No part of this material may be reproduced or referred to in any other publication without express
                                                                                            written permission of MV Index Solutions. All rights are reserved.
Digital Assets Marketplace
Digital assets have gained steady recognition over the past several years
Today, there are over 5,000 digital assets with over $260 billion in market capitalization*
The top 5, 10, 25, and 100 are most widely cited
Digital assets are traded on various trading platforms against hard currencies and other digital assets
Digital assets markets are fragmented
– Trade at different prices across different markets (no Reg. NMS)
– Increased difficulty of asset valuation
Digital asset trading platforms face several challenges
– Varying technological platform sophistication and standards
– Frequent DDOS attacks and hacks
– Potential fraud (including ICOs)
Digital assets have the potential to integrate in the broad economy
– Structural market improvements
– Proper price discovery
– Sound index methodology
– An investable asset class
The state of digital asset markets
– Prices are trading platform dependent, no unified quotation system
– Popular markets are generally the top trading platforms
– Trading platforms are independent of each other and active at various cycles of the day
(geographic location, clientele)
– When volume drops on a given trading platform, spreads widen and prices get pushed around
– Sometimes there is as much as a 12%-15% price difference between trading platforms
*
*Data as of 30 June 2020
9 No part of this material may be reproduced or referred to in any other publication without express
written permission of MV Index Solutions. All rights are reserved.
Top Ten Digital Assets By Market Capitalization

                Name                             Market Cap                   Price                       Circulating Supply               Symbol   Mon. Avg. Vol. (1 Mon)

1               Bitcoin                          $168,973,000,000             $9,176.31                            18,414,012              BTC      $3,774,799,566

2               Ethereum                         $25,194,668,386              $225.98                            111,490,700               ETH      $1,430,733,660

3               Bitcoin Cash                   $4,117,150,709                 $223.22                          Mon.18,444,363
                                                                                                                    Avg. Vol. (1           BCH      $223,299,242
           Name                    Market Cap        Price                 Circulating Supply      Symbol      Mon)
1          Bitcoin                 1.68973E+11       9176.31               18414012                BTC         $3,774,799,566
4               XRP                            $7,776,096,096                 $0.18                            44,257,803,618              XRP      $147,172,679
2          Ethereum                25194668386       225.98                111490700               ETH         $1,430,733,660
 3         Bitcoin Cash            4117150709          223.22              18444363                BCH         $223,299,242
54         XRPLitecoin             7776096096    $2,679,172,173
                                                       0.1757                $41.29
                                                                           44257803618             XRP            64,886,708
                                                                                                               $147,172,679                LTC      $148,676,004
5          Litecoin                2679172173          41.29               64886708                LTC         $148,676,004
6          EOSEOS                  2211185679          2.368
                                                 $2,211,185,679            933777736
                                                                             $2.37                 EOS         $192,859,493
                                                                                                                 933,777,736               EOS      $192,859,493
7          Bitcoin SV              2920253061          158.34              18442927                BSV         $104,529,037

78         Binance  Coin
               Bitcoin SV          2407708317          15.48
                                                 $2,920,253,061            155536713
                                                                             $158.34               BNB         $83,581,450
                                                                                                                   18,442,927              BSV      $104,529,037
 9         Chainlink               1622250000          4.635               350000000               LINK        $80,480,833
10         Ethereum Classic        670546168.7         5.765               116313299               ETC         $138,278,246
8              Binance Coin                      $2,407,708,317              $15.48                              155,536,713               BNB      $83,581,450

9               Chainlink                        $1,622,250,000               $4.64                              350,000,000               LINK     $80,480,833

10              Ethereum Classic                 $670,546,169                 $5.77                              116,313,299               ETC      $138,278,246

     Source: CryptoCompare
     Data as of 30 June 2020

10                                    No part of this material may be reproduced or referred to in any other publication without express
                                                       written permission of MV Index Solutions. All rights are reserved.
Digital Asset Classification and Investment Fit
Types of Digital Assets
Cryptocurrency/store of value, platform/protocol, specific function/utility
Bitcoin may become digital gold but is one of many digital assets and one of many use cases;
do not know the winners at this point
The top 10 and 25 digital assets and their use-cases are investable and worthwhile to monitor
Investment bucket: aggressive early stage technology, uncorrelated assets
Example Digital Assets and Classification
Bitcoin model based (Bitcoin, Litecoin, BitcoinCash) [cryptocurrency/store of value]
Decentralized applications and smart contracts (Ethereum, NEO, EOS) [platform/protocol]
Transactions/payment systems (Ripple, Stellar, OmiseGo) [cryptocurrency/store of value]
Privacy oriented (Zcash, Dash, Monero) [cryptocurrency/store of value]
Internet of things (IOTA) [specific use case/utility]
Decentralized asset issuance platform (Waves) [platform/protocol]
Decentralized digital asset exchange (BitShares) [specific use case/utility]
User merit-based media platform (Steem) [specific use case/utility]
Worldwide supercomputer (Golem) [specific use case/utility]
Blockchain development software (Stratis) [platform/protocol]
Quantum-secure blockchain (Quantum) [platform/protocol]
All-in-one blockchain (ARK) [platform/protocol]
11 No part of this material may be reproduced or referred to in any other publication without express
written permission of MV Index Solutions. All rights are reserved.Bitcoin Market Share Across Top Exchanges
Last 30 days
others
2%
bit-x
kraken 18%
18%
gemini
3% bitbay
4%
exmo
1%
bitfinex
8%
coinbase bitflyer
23% 8%
bitstamp
15%
Last 30 days volume
Source: MVIS Research, CryptoCompare
Data as of 30 June 2020
12 No part of this material may be reproduced or referred to in any other publication without express
written permission of MV Index Solutions. All rights are reserved.Top Digital Asset Exchanges
Website platforms Digital assets traded in pairs Fiat currencies Location
Bitfinex 275 USD, EUR, JPY, GBP Hong Kong
Bitstamp 29 USD, EUR Luxembourg
Coinone 80 KRW South Korea
Poloniex 178 Digital Asset Only Delaware
Kraken 161 USD, EUR, CAD, GBP, JPY California
Coinbase Pro 67 USD, EUR, GBP California
Bittrex 431 USD USA
HitBTC 834 Digital Asset Only London
Gemini 27 USD New York
DRW, GGT, Circle Financial are big 3
OTC Various Various
Large block trades between counterparties
Source: MVIS Resarch & CryptoCompare
Data as of 30 June 2020
13 No part of this material may be reproduced or referred to in any other publication without express
written permission of MV Index Solutions. All rights are reserved.Fair and Liquidity-Driven Global Price
MVIS’s methodology
Prices compiled from 54 global digital asset trading platforms
Trading platform weights established based on liquidity
– Prices are checked real-time on 54 trading platforms, covering >90% of global trading volume
(ex OTC)
– Availability every second, 86,400 times a day
– More liquid trading platform receives a higher weight
– Intraday liquidity is taken into account by liquidity penalty factor
Results of high market coverage and liquidity-weighting:
– Fairest price of a digital asset
– Robustness in case of flash crashes, even if larger trading platform(e.g., Coinbase) are
affected
– Global approach (liquidity in certain regions/time zones is taken into account)
Important notice: The calculated prices may not be achieved by investors as the calculated price is based on prices from different trading platforms. As not all trading platforms may be
used by the investor the actual price may differ and be much less than the calculated price referred to on this slide.
14 No part of this material may be reproduced or referred to in any other publication without express
written permission of MV Index Solutions. All rights are reserved.Index Concept – Pricing
Important notice: The calculated prices may not be achieved by investors as the calculated price is based on prices from different trading platforms. As not all trading platforms
may be used by the investor the actual price may differ and be much less than the calculated price referred to on this slide.
15 No part of this material may be reproduced or referred to in any other publication without express
written permission of MV Index Solutions. All rights are reserved.Index Concept − Liquidity
Setting the stage for investability
MVIS applies strict and demanding liquidity screening to digital assets:
— One month average daily trading volumes of at least USD1 million at
review date
— Liquidity criteria applies to the blue chips (5, 10, 25 component indices) -
not for the 100 component index (broad benchmark used as a universe).
MVIS selection criteria and capping method typically result in a more liquid
index.
Average daily trading volume MVIS CryptoCompare Digital Assets 10 Index
Criteria Required Bitcoin Ethereum Bitcoin Cash XRP Litecoin
Average daily trading volume $1,000,000 $3,774,799,566 $1,430,733,660 $223,299,242 $147,172,679 $148,676,004
Data as of 30 June 2020
Important notice: An investment into crypto currencies may become illiquid depending on the trading platform or investment product used for the specific investment.
Investors should carefully review the liquidity risk and disclosures of the relevant trading platform or investment product they aim to invest in.
16 No part of this material may be reproduced or referred to in any other publication without express
written permission of MV Index Solutions. All rights are reserved.Index Concept − Diversification
Weighting schemes
— MVIS CryptoCompare Digital Assets 5 Index: 35% maximum weight per constituent
— MVIS CryptoCompare Digital Assets 10 Index: 30% maximum weight per constituent
— MVIS CryptoCompare Digital Assets 25 Index: 20%
(capping factors are staggered from a maximum weight of 20% down to 4.5%)
Weightings MVIS CryptoCompare Digital Assets 10 Index
Top 10 Components
Digital Asset Uncapped Weight Weight
Bitcoin 76.85% 30.00%
Ethereum 11.70% 30.00%
XRP 3.64% 12.70%
Bitcoin Cash 1.92% 6.73%
Bitcoin SV 1.43% 5.00%
Litecoin 1.24% 4.33%
Binance Coin 1.12% 3.92%
EOS 1.04% 3.64%
Chainlink 0.73% 2.54%
Ethereum Classic 0.32% 1.13%
Data as of 30 June 2020
17 No part of this material may be reproduced or referred to in any other publication without express
written permission of MV Index Solutions. All rights are reserved.Index Concept − Diversification and Cap Factors
Capitalization factors promote balanced, diversified index exposure, especially in markets
dominated by a few large assets
MVIS CryptoCompare Digital Assets 25 Index
— Top four digital assets are capped
— All other company weights increase
— The excess weight generated by capping is distributed across smaller companies
— Underweight large-cap; overweight mid- and small-cap companies
Digital Assets – Top 25 Component Weightings in the Index
80%
70%
60%
50%
40%
30%
20%
10%
0%
Uncapped Weight Capped Weight
*Data as of 30 June 2020
18 No part of this material may be reproduced or referred to in any other publication without express
written permission of MV Index Solutions. All rights are reserved.Index Concept - Forks
Definition
A hard fork means a change to the protocol of the underlying digital asset. A hard fork makes previously
valid blocks/transactions invalid. As such, a hard fork requires all nodes or users to upgrade to the latest
version of the protocol because previous versions will no longer be accepted by the new version. One path
follows the new, upgraded blockchain and one path continues along the previous path.
MVIS’s Treatment of Forks
A forked digital asset of an index constituent can be eligible for the index if it fulfills some rigorous
requirements that ensure quality:
— The fork should trade in at least one of the top tier exchanges.
— It should ensure accountability: Open source code, public developers engaged in project, premine
information as well as an announcement significantly prior to activation are among factors that ensure
seriousness of the fork.
If eligible, a forked digital asset of an index constituent is added to the index as soon as the fork becomes
effective. The price of the forked asset is determined as follows:
– If the main net is available and the fork trades on at least one trading platform(not by futures), the
(composite) price is used.
– Otherwise the price is 0.
As soon as a price is available, the first available close (5:00 pm GMT) is used.
– In the multi component indices, the smallest coin by market capitalization will be deleted.
– In the single component indices, the forked coin will be deleted. Only in exceptional cases (e.g., no
acceptance for the old chain), MVIS may decide to keep the new chain and delete the old.
– In all instances, the market capitalization of the deleted coin is reinvested in the index.
The new index composition is implemented after the second close after the first price is available.
19 No part of this material may be reproduced or referred to in any other publication without express
written permission of MV Index Solutions. All rights are reserved.Index Concept – Forks, Bitcoin Cash Example
What is Bitcoin Cash?
Bitcoin Cash is a digital asset that forked off from the original Bitcoin blockchain. Bitcoin Cash’s main
protocol change intends to improve bitcoin’s scaling capability by introducing variable blocksize limits up to
8MB compared to bitcoin’s original 1MB blocksize, adjust block difficulty levels and change core fee code
instead of SegWit, thereby enabling faster payments, lower fees and more on-chain transactions
The Bitcoin Cash scaling solution was sufficiently different from the core bitcoin protocol and gathered
enough support, so it “forked” from the original bitcoin blockchain creating a new blockchain and a new
digital asset that is bitcoin cash blockchain and bitcoin cash, respectively. For every Bitcoin an investor
owned before the fork, the investor is entitled to one Bitcoin Cash
Timeline of the Bitcoin Fork
Bitcoin scaling solutions are discussed globally; MVIS and CryptoCompare monitor developments
Hard Fork occurred on August 1st at 12:37 UTC, block number 478,558
First block (478,559) mined at on the evening on August 1st , 18:14 GMT
MVIS treatment of Bitcoin Fork
Based on its price, Bitcoin Cash assumed respective weights in the indices
Bitcoin Cash was eligible to be added to MVIS indices which contained Bitcoin on August 1st. The
parameters were the same as for Bitcoin (keep the index in line with a virtual portfolio). The price was set to
0
The first price for Bitcoin Cash was available on August 2nd at 5:
Indices were adjusted (e.g., Bitcoin Cash was removed from MVBTC) after close August 3rd
31.07.2017 01.08.2017 02.08.2017 03.08.2017
Component Price Component Price Component Price Component Price
BTC 2883.27 BTC 2746.99 BTC 2720.53 BTC 2809.99
- BCH 439.27 BCH 551.59 BCH 405.92
20 No part of this material may be reproduced or referred to in any other publication without express
written permission of MV Index Solutions. All rights are reserved.Index Concept – Forks, Bitcoin Cash Example Continued
After the Bitcoin Fork
Bitcoin Cash traded like Bitcoin on several trading platforms. Bitcoin Cash price is between approximately
250 and 800 USD per unit
MVIS and CryptoCompare continued to monitor both Bitcoin and Bitcoin Cash as separate assets, until the
Bitcoin Cash fork in November 2018.
Bitcoin Cash Hard Fork (Price)
2100
1900
1700
1500
Bitcoin Cash
Price USD
1300 Hard Fork
1100
900
700
500
29.06.2017 16.07.2017 02.08.2017 19.08.2017 05.09.2017 22.09.2017
Date
BTC BCH MVBTC
21Index Concept – Forks, Bitcoin SV Example
What is Bitcoin Cash ABC and Bitcoin SV?
Bitcoin Cash ABC (BCHABC) is a hard forked version of Bitcoin Cash, aims to preserve the original
functionality and vision of the Bitcoin Cash network and currently preserves the block size of 32MB.
However, because the hard fork is technically an upgrade, there are some improvements.
Bitcoin SV (BSV) is a hard fork protocol initiated by the nChain developers, block size has quadrupled from
32MB to 128MB. Changes to the protocol have been made to ease the transition to smart contracts on the
BCHSV network.
Timeline of the Bitcoin Cash SV Hard Fork
Two Hard Forks were diverged at block 556767,starting on November 15th at 16:40 UTC.
MVIS treatment of Bitcoin Cash SV Hard Fork
Bitcoin Cash ABC and Bitcoin Cash SV were both eligible to be added to MVIS indices on November 15th.
Indices were adjusted after completion on November 15th
As Bitcoin ABC not only follows Bitcoin Cash upgrade roadmap published by bitcoincash.org, but also has
a bigger market capitalization and liquidity at the close of November 15th, than the other forked component,
Bitcoin Cash SV, which was removed from the index after close of November 16th.
14.11.2018 15.11.2018 16.11.2018 17.11.2018
Component Price Component Price Component Price Component Price
BCH 444.16 BCHABC 314.76 BCHABC 261.94 BCHABC 255.60
- BCHSV 99.55 BCHSV 109.01 BCHSV 130.22
22Index Concept – Forks, Bitcoin Cash SV Example Continued
After the Bitcoin Cash Fork
Bitcoin Cash traded like Bitcoin on several trading platforms. Bitcoin Cash price is between approximately
250 and 800 USD per unit
MVIS and CryptoCompare continued to monitor both Bitcoin and Bitcoin Cash as separate assets, until the
Bitcoin Cash fork in November 2018.
Bitcoin Cash SV Hard Fork (Price)
2500
Bitcoin Cash
2000 Hard Fork
1500
Price USD
1000
500
0
13.10.2018 30.10.2018 16.11.2018 03.12.2018 20.12.2018
BCH BSV MVBCH
23Index Concept – Initial Coin Offerings (ICOs)
Definition
ICOs are a means to raise capital for a company’s business or project
In an ICO campaign, a percentage of the underlying digital asset (i.e., the initial coin) is sold to investors in
exchange for U.S. Dollars or digital assets. Importantly, ICOs do not necessarily provide ownership in the
company or the underlying venture or project
MVIS’s Treatment of ICOs
ICOs and non-component digital assets are added to the indices at the next review, provided they trade for at
least ten days, and meet index selection and liquidity criteria set forth in the MVIS index rulebook
24 No part of this material may be reproduced or referred to in any other publication without express
written permission of MV Index Solutions. All rights are reserved.Custody
Wallets
Bitcoins are stored in “wallets”
A wallet is a randomly generated string of numbers and consists of two parts: the public key and private
key. Example of a public key: 14GabW85FUMQy62CMWLCToQLo81w7iXL2x
The second half of the Bitcoin wallet is what is known as the private key. Only the wallet owner has
access to the private key
Type of wallets: online, local, paper
Current Custody Types
On trading platform (online wallet)
Multi-signature (more secure online wallet)
Cold storage (local secure hardware and process driven wallet)
Shortcomings of Current System
High counterparty risk of custody service providers
Potential conflicts of interest, front running, lack of transparency
Unproven or novel technology
High risk operational business processes
High human/key person risk, dependency on trusting individuals at custody providers
Lack of regulatory status and oversight
Not well integrated into either mainframe financial or digital asset eco system
25 No part of this material may be reproduced or referred to in any other publication without express
written permission of MV Index Solutions. All rights are reserved.MVIS CryptoCompare Digital Assets 25 Index (MVDA25)
Top 25 components of MVIS® CryptoCompare Digital Assets 100 Index Components
by size and liquidity (excl. stable/pegged coins)
Top 5 Components
Investable Bitcoin 20.08%
20% (capping factors are staggered from a maximum weight of 20% Ethereum 15.54%
down to 4.5%.) Cardano 5.68%
Liquidity screen: monthly average-daily-trading volume of at least XRP 4.80%
USD 1 million at review Bitcoin Cash 4.67%
Total market capitalization – USD 230.76 billion Other 49.23%
Index history back to 31 December 2014
Liquidity
Top 5 Components Period Volume (USD)
Average 1 Month June Review 227,259,109
17,500 Weighted Average 1 Month June Review 1,048,393,914
15,000
12,500
Index Values (USD)
Fundamental Data
10,000
Index Performance Value Index Records Value
7,500
Year-to-Date
40.09% All Time High/Low 16,720 / 39
Performance
5,000
1-Year Performance -38.87% 52-Weeks High/Low 4,503 / 1,560
2,500 Since Inception 82.42% Quarter High/Low 3,925 / 1,560
Month High/Low 3,020 / 2,708
0
Dec-14 Sep-15 May-16 Jan-17 Sep-17 Jun-18 Feb-19 Oct-19 Jun-20
MVDA25 *Performance since inception is annualized
Data as of 30 June 2020
26 No part of this material may be reproduced or referred to in any other publication without express
written permission of MV Index Solutions. All rights are reserved.MVIS CryptoCompare Digital Assets 10 Index (MVDA10)
Top 10 components of MVIS® CryptoCompare Digital Assets 100 Index Components
by size and liquidity (excl. stable/pegged coins)
Top 5 Components
Investable Ethereum 32.69%
30% maximum weight per constituent Bitcoin 30.62%
Liquidity screen: monthly average-daily-trading volume of at least XRP 11.67%
USD 1 million at review Bitcoin Cash 6.19%
Bitcoin SV 4.39%
Total market capitalization – USD 218.18
Other 14.43%
billion
Index history back to 31 December 2014
Liquidity
Top 5 Components Period Volume (USD)
Average 1 Month June Review 568,053,418
15,750 Weighted Average 1 Month June Review 1,678,074,978
13,125
10,500
Index Values (USD)
Fundamental Data
7,875
Index Performance Value Index Records Value
5,250 Year-to-Date
30.41% All Time High/Low 14,033 / 39
Performance
1-Year Performance -35.28% 52-Weeks High/Low 4,751 / 1,761
2,625
Since Inception 85.34% Quarter High/Low 4,276 / 1,761
Month High/Low 3,279 / 2,963
0
Dec-14 Sep-15 May-16 Jan-17 Sep-17 Jun-18 Feb-19 Oct-19 Jun-20
MVDA10 *Performance since inception is annualized
Data as of 30 June 2020
27 No part of this material may be reproduced or referred to in any other publication without express
written permission of MV Index Solutions. All rights are reserved.MVIS CryptoCompare Digital Assets 5 Index (MVDA5)
Top 5 components of MVIS® CryptoCompare Digital Assets 100 Index by Components
size and liquidity (excl. stable/pegged coins)
Top 5 Components
Investable
Ethereum 37.66%
35% maximum weight per constituent Bitcoin 35.27%
Liquidity screen: monthly average-daily-trading volume of at least XRP 14.43%
USD 1 million at review Bitcoin Cash 7.65%
Total market capitalization – USD 208.35 billion Litecoin 4.98%
Index history back to 31 December 2014
Liquidity
Top 5 Components Period Volume (USD)
Average 1 Month June Review 1,144,936,230
16,000 Weighted Average 1 Month June Review 1,916,070,456
14,000
12,000
Index Values (USD)
10,000 Fundamental Data
8,000
Index Performance Value Index Records Value
6,000 Year-to-Date
32.52% All Time High/Low 15,041 / 47
Performance
4,000
1-Year Performance -32.71% 52-Weeks High/Low 5,560 / 2,095
2,000 Since Inception 91.81% Quarter High/Low 4,912 / 2,095
Month High/Low 3,938 / 3,582
0
Dec-14 Sep-15 May-16 Jan-17 Sep-17 Jun-18 Feb-19 Oct-19 Jun-20
MVDA5 *Performance since inception is annualized
Data as of 30 June 2020
28 No part of this material may be reproduced or referred to in any other publication without express
written permission of MV Index Solutions. All rights are reserved.MVIS CryptoCompare Digital Assets 100 Index (MVDA)
A market cap-weighted index Components
Tracks the performance of the 100 largest digital assets Top 5 Components
Benchmark/universe for the MVIS CryptoCompare Digital Assets Indices Bitcoin 66.39%
Ethereum 9.88%
Contains three sub-indices (large, mid and small capitalization)
Tether 3.46%
Total market capitalization - USD 254.11 billion XRP 3.05%
Index history back to 31 December 2014 Bitcoin Cash 1.62%
No liquidity screen Other 15.60%
Liquidity
Top 5 Components Period Volume (USD)
Average 1 Month June Review 104,384,899
10,800 Weighted Average 1 Month June Review 2,834,353,942
9,450
8,100
Index Values (USD)
6,750 Fundamental Data
5,400
Index Performance Value Index Records Value
4,050 Year-to-Date
29.15% All Time High/Low 8,877 / 50
Performance
2,700 1-Year Performance -25.54% 52-Weeks High/Low 3,403 / 1,339
1,350 Since Inception 77.70% Quarter High/Low 2,892 / 1,339
Month High/Low 2,528 / 2,349
0
Dec-14 Sep-15 May-16 Jan-17 Sep-17 Jun-18 Feb-19 Oct-19 Jun-20
MVDA *Performance since inception is annualized
Data as of 30 June 2020
29 No part of this material may be reproduced or referred to in any other publication without express
written permission of MV Index Solutions. All rights are reserved.MVIS CryptoCompare Bitcoin Index (MVBTC)
The MVIS® CryptoCompare Bitcoin Index covers the performance of a digital Component
assets portfolio which invests in Bitcoin
Bitcoin 100.00%
Total market capitalization – USD 168.71 billion
Index history back to 31 January 2012
Bitcoin is a peer-to-peer digital asset and technology that operates with no
central authority or banks Liquidity
Transactions and the issuing of Bitcoin is carried out collectively by the Top 5 Components Period Volume (USD)
network Average 1 Month June Review 3,774,799,566
Bitcoin is the first decentralized digital asset and has spawned tremendous
evolution in the digital asset space
Fundamental Data
Index Performance Value Index Records Value
Year-to-Date Performance 27.16% All Time High/Low 41,173 / 8
1-Year Performance -18.21% 52-Weeks High/Low 27,214 / 10,885
42,000
Since Inception 146.47% Quarter High/Low 22,434 / 10,885
38,500
Month High/Low 21,193 / 19,711
35,000
31,500
28,000
Index Values (USD)
Digital Asset Specifications
24,500
21,000
Max Supply Algorithm Proof Type
17,500
21,000,000 SHA-256 PoW
14,000
Difficulty Adj. BlockRR. BlockNo.
10,500
2016 blocks 0.5 639093
7,000
3,500 Start Date Twitter Website
0 03.01.2009 - -
Jan-12 Feb-13 Mar-14 Mar-15 Apr-16 May-17 May-18 Jun-19 Jun-20 Network H/s Current Supply Block Reward
MVBTC 124,169,033,211.7 18,431,812 6.3
*Performance since inception is annualized
Data as of 30 June 2020
30 No part of this material may be reproduced or referred to in any other publication without express
written permission of MV Index Solutions. All rights are reserved.MVIS CryptoCompare Bitcoin Cash Index (MVBCH)
The MVIS® CryptoCompare Bitcoin Cash Index covers the performance of a Component
digital assets portfolio which invests in Bitcoin Cash.
Bitcoin Cash 100.00%
Total market capitalization – USD 4.11 billion
Index history back to 31 August 2017
Bitcoin Cash (BCH) is a hard forked version of the original Bitcoin. It is
similar to Bitcoin with regards to its protocol: Liquidity
— Proof of Work SHA-256 hashing
Top 5 Components Period Volume (USD)
— Max 21 million supply
— Same block times and reward system Average 1 Month June Review 223,299,242
Fundamental Data
Index Performance Value Index Records Value
Year-to-Date Performance 7.92% All Time High/Low 6,761 / 181
1-Year Performance -45.74% 52-Weeks High/Low 1,165 / 400
7,000
Since Inception -20.21% Quarter High/Low 1,165 / 400
6,000 Month High/Low 611 / 523
5,000
Index Values (USD)
Digital Asset Specifications
4,000
Max Supply Algorithm Proof Type
3,000
21,000,000 SHA-256 PoW
2,000 Difficulty Adj. BlockRR. BlockNo.
6 blocks 0.5 643747
1,000
Start Date Twitter Website
0 01.08.2017 @BITCOlNCASH -
Aug-17 Jan-18 May-18 Sep-18 Jan-19 Jun-19 Oct-19 Feb-20 Jun-20 Network H/s Current Supply Block Reward
MVBCH 3,392,518,714,518,286,000.0 18,460,908 6.3
*Performance since inception is annualized
Data as of 30 June 2020
31 No part of this material may be reproduced or referred to in any other publication without express
written permission of MV Index Solutions. All rights are reserved.MVIS CryptoCompare Dash Index (MVDASH)
The MVIS® CryptoCompare Dash Index covers the performance of a digital Component
assets portfolio which invests in Dash
Dash 100.00%
Total market capitalization – USD 0.65 billion
Index history back to 28 February 2014
DigitalCash (Dash) uses a new chained hashing algorithm approach, with
many new scientific hashing algorithms for the proof-of-work Liquidity
Dash aims to be the first privacy-centric cryptographic currency with fully Top 5 Components Period Volume (USD)
encrypted transactions and anonymous block transactions. (PrivateSend)
Average 1 Month June Review 45,068,271
PrivateSend mixes Dash coins with other users who are also using this
feature making transactions untraceable
Users can earn DigitalCash rewards by hosting a master node to help Fundamental Data
maintain the blockchain. One must have a balance of at least 1000 DASH in
order to host a Dash master node. This collateral is required to avoid 51% Index Performance Value Index Records Value
attacks on the network Year-to-Date Performance 62.70% All Time High/Low 25,358 / 9
1-Year Performance -56.84% 52-Weeks High/Low 2,961 / 727
27,000
Since Inception 114.67% Quarter High/Low 2,471 / 751
24,000 Month High/Low 1,459 / 1,251
21,000
18,000
Index Values (USD)
Digital Asset Specifications
15,000
12,000 Max Supply Algorithm Proof Type
22,000,000 X11 PoW/PoS
9,000
Difficulty Adj. BlockRR. BlockNo.
6,000 DGW 0.5 1303625
3,000 Start Date Twitter Website
0 18.01.2014 @Dashpay -
Feb-14 Dec-14 Sep-15 Jul-16 Apr-17 Feb-18 Nov-18 Sep-19 Jun-20 Network H/s Current Supply Block Reward
MVDASH 5,751,351,504,313,740.0 9597641 2.9
*Performance since inception is annualized
Data as of 30 June 2020
32 No part of this material may be reproduced or referred to in any other publication without express
written permission of MV Index Solutions. All rights are reserved.MVIS CryptoCompare Ethereum Index (MVETH)
The MVIS® CryptoCompare Ethereum Index covers the performance of a Component
digital assets portfolio which invests in Ether.
Ethereum 100.00%
Total market capitalization – USD 25.10 billion
Index history back to 31 August 2015
Ethereum is a decentralized platform that runs smart contracts: applications
that run exactly as programmed without downtime, censorship, fraud or third Liquidity
party interference.
Top 5 Components Period Volume (USD)
In the Ethereum protocol and blockchain there is a price for each operation. Average 1 Month June Review 1,430,733,660
In order transfer or execute data on the network, you have to consume or
burn gas.
The digital asset underlying the Ethereum network is called Ether and is Fundamental Data
used to pay for computation time and for transaction fees.
Index Performance Value Index Records Value
Year-to-Date Performance 73.70% All Time High/Low 11,188 / 3
1-Year Performance -25.12% 52-Weeks High/Low 2,592 / 924
11,190
Since Inception 196.01% Quarter High/Low 2,367 / 924
Month High/Low 2,053 / 1,885
8,952
Index Values (USD)
Digital Asset Specifications
6,714
Max Supply Algorithm Proof Type
4,476 - Ethash PoW
Difficulty Adj. BlockRR. BlockNo.
2,238 Per 1 Block - 10451934
Start Date Twitter Website
0 30.07.2015 @ethereum -
Aug-15 Apr-16 Nov-16 Jun-17 Jan-18 Sep-18 Apr-19 Nov-19 Jun-20 Network H/s Current Supply Block Reward
MVETH 188,805,429,796,042.3 111,741,930 2.0
*Performance since inception is annualized
Data as of 30 June 2020
33 No part of this material may be reproduced or referred to in any other publication without express
written permission of MV Index Solutions. All rights are reserved.MVIS CryptoCompare IOTA Index (MVIOT)
The MVIS® CryptoCompare IOTA Index covers the performance of a digital Component
assets portfolio which invests in IOTA
Total market capitalization – USD 0.61 billion IOTA 100.00%
Index history back to 31 July 2017
IOTA is an open-source distributed ledger protocol that goes 'beyond
blockchain' through its core invention of the blockless ‘Tangle’ Liquidity
The IOTA Tangle is a quantum-proof Directed Acyclic Graph, with no fees
Top 5 Components Period Volume (USD)
on transactions, no fixed limit on how many transactions can be confirmed
per second in the network. Throughput grows in conjunction with activity in Average 1 Month June Review 13,253,191
the network; the more activity, the faster the network.
Unlike blockchain architecture, IOTA has no separation between users and
Fundamental Data
validators. Validation is an intrinsic property of using the ledger, thus
avoiding centralization. IOTA is initially focused on serving as the backbone
Index Performance Value Index Records Value
of the emerging Internet-of-Things (IoT).
Year-to-Date Performance 36.97% All Time High/Low 18,929 / 401
1-Year Performance -45.48% 52-Weeks High/Low 1,551 / 401
20,000
Since Inception -5.59% Quarter High/Low 1,343 / 401
17,500 Month High/Low 952 / 804
15,000
Index Values (USD)
12,500 Digital Asset Specifications
10,000
Max Supply Algorithm Proof Type
7,500 2,779,530,283 - Tangle
Difficulty Adj. BlockRR. BlockNo.
5,000
- - -
2,500 Start Date Twitter Website
0 00.01.1900 - -
Jul-17 Dec-17 Apr-18 Sep-18 Jan-19 May-19 Oct-19 Feb-20 Jun-20 Network H/s Current Supply Block Reward
MVIOT - 2,779,530,283 -
*Performance since inception is annualized
Data as of 30 June 2020
34 No part of this material may be reproduced or referred to in any other publication without express
written permission of MV Index Solutions. All rights are reserved.MVIS CryptoCompare LiteCoin Index (MVLTC)
The MVIS® CryptoCompare LiteCoin Index covers the performance of a Component
digital assets portfolio which invests in LiteCoin.
LiteCoin 100.00%
Total market capitalization – USD 2.68 billion
Index history back to 30 September 2013
LiteCoin LTC - provides faster transaction confirmations (2.5 minutes on
average) and uses a memory-hard, script-based mining proof-of-work Liquidity
algorithm to target the regular computers and GPUs most people already
Top 5 Components Period Volume (USD)
have - which are its main differences to Bitcoin.
Average 1 Month June Review 148,676,004
The coin was created by a Google employee, Charles Lee. LiteCoin is in
second spot to Bitcoin and has spawned numerous clones - however it has
solid support and dedicated development team.
Fundamental Data
Index Performance Value Index Records Value
Year-to-Date Performance -0.89% All Time High/Low 13,876 / 43
1-Year Performance -68.32% 52-Weeks High/Low 5,210 / 1,314
15,000
Since Inception 51.46% Quarter High/Low 3,269 / 1,314
Month High/Low 1,902 / 1,650
12,500
10,000
Index Values (USD)
Digital Asset Specifications
7,500
Max Supply Algorithm Proof Type
84,000,000 Scrypt PoW
5,000
Difficulty Adj. BlockRR. BlockNo.
2016 blocks 0.5 1876303
2,500
Start Date Twitter Website
0 13.10.2011 @litecoin -
Sep-13 Aug-14 Jun-15 Apr-16 Feb-17 Dec-17 Oct-18 Aug-19 Jun-20 Network H/s Current Supply Block Reward
MVLTC 264,828,783,301,494.00 65,451,808 12.5
*Performance since inception is annualized
Data as of 30 June 2020
35 No part of this material may be reproduced or referred to in any other publication without express
written permission of MV Index Solutions. All rights are reserved.MVIS CryptoCompare Monero Index (MVXMR)
The MVIS® CryptoCompare Monero Index covers the performance of a Component
digital assets portfolio which invests in Monero
Monero 100.00%
Total market capitalization – USD 1.13 billion
Index history back to 31 January 2015
Monero (XMR) is a cryptonight algorithm-based alternative digital asset.
XMR is based on Proof of Work and has a block reward that varies Liquidity
smoothly.
Top 5 Components Period Volume (USD)
The difficulty retargets every block with a sixty second block target. Monero Average 1 Month June Review 21,373,767
uses a Ring Signature system to protect privacy, allowing users to make
untraceable transactions.
Fundamental Data
Index Performance Value Index Records Value
Year-to-Date Performance 41.22% All Time High/Low 14,866 / 8
1-Year Performance -31.35% 52-Weeks High/Low 3,534 / 1,152
16,000
Since Inception 170.97% Quarter High/Low 3,264 / 1,152
14,000 Month High/Low 2,365 / 2,172
12,000
Index Values (USD)
10,000 Digital Asset Specifications
8,000
Max Supply Algorithm Proof Type
6,000 - CryptoNight-V7 PoW
Difficulty Adj. BlockRR. BlockNo.
4,000
2 blocks - 2141395
2,000 Start Date Twitter Website
0 02.06.2014 @monero -
Jan-15 Oct-15 Jun-16 Feb-17 Oct-17 Jun-18 Feb-19 Oct-19 Jun-20 Network H/s Current Supply Block Reward
MVXMR 1,469,166,318.7 17,630,010.3 1.6
*Performance since inception is annualized
Data as of 30 June 2020
36 No part of this material may be reproduced or referred to in any other publication without express
written permission of MV Index Solutions. All rights are reserved.MVIS CryptoCompare NEM Index (MVXEM)
The MVIS® CryptoCompare NEM Index covers the performance of a digital Component
assets portfolio which invests in NEM
NEM 100.00%
Total market capitalization – USD 0.38 billion
Index history back to 31 March 2015
NEM (XEM) is a peer-to-peer crypto platform. It is written in Java and
JavaScript with 100% original source code. Liquidity
NEM has a stated goal of a wide distribution model and has introduced new Top 5 Components Period Volume (USD)
features in blockchain technology in its proof-of-importance (POI) algorithm. Average 1 Month June Review 4,197,193
NEM also features an integrated peer-to-peer secure and encrypted
messaging system - Multisignature accounts and an Eigentrust++ reputation
system. Fundamental Data
Index Performance Value Index Records Value
Year-to-Date Performance 34.33% All Time High/Low 44,710 / 2
1-Year Performance -54.24% 52-Weeks High/Low 2,294 / 779
44,715
Since Inception 142.43% Quarter High/Low 1,843 / 779
Month High/Low 1,168 / 1,008
35,772
Index Values (USD)
Digital Asset Specifications
26,829
Max Supply Algorithm Proof Type
17,886 8,999,999,999 - PoI
Difficulty Adj. BlockRR. BlockNo.
8,943 - - -
Start Date Twitter Website
0 31.03.2015 @NEMofficial -
Mar-15 Nov-15 Jul-16 Mar-17 Nov-17 Jul-18 Mar-19 Oct-19 Jun-20 Network H/s Current Supply Block Reward
MVXEM - 8,999,999,999 -
*Performance since inception is annualized
Data as of 30 June 2020
37 No part of this material may be reproduced or referred to in any other publication without express
written permission of MV Index Solutions. All rights are reserved.MVIS CryptoCompare NEO Index (MVNEO)
The MVIS® CryptoCompare NEO Index covers the performance of a digital Component
assets portfolio which invests in NEO
NEO 100.00%
Total market capitalization – USD 0.71 billion
Index history back to 30 September 2016
NEO is a platform in which users can issue and trade assets. NEO has been
rebranded from the original 'Antshares‘. Liquidity
NEO tokenizes proof of ownership of an asset and not the asset itself, thus Top 5 Components Period Volume (USD)
taking into account all of the legal complications and obligations that may Average 1 Month June Review 48,665,436
come with the transfer of shares, equity and assets.
NEO represent an ownership of the NEO platform and allows users to buy
NEO and to vote on protocol changes on the NEO blockchain. NEOs are Fundamental Data
100% pre-mined and issued on the NEO's genesis block.
Index Performance Value Index Records Value
Year-to-Date Performance 15.11% All Time High/Low 4,598 / 3
1-Year Performance -42.26% 52-Weeks High/Low 473 / 141
4,600
Since Inception 140.50% Quarter High/Low 436 / 141
Month High/Low 330 / 266
3,680
Index Values (USD)
Digital Asset Specifications
2,760
Max Supply Algorithm Proof Type
1,840 100,000,000 - N/A
Difficulty Adj. BlockRR. BlockNo.
920 - - -
Start Date Twitter Website
0 01.08.2017 @neo_blockchain -
Sep-16 Mar-17 Sep-17 Feb-18 Aug-18 Feb-19 Jul-19 Jan-20 Jun-20 Network H/s Current Supply Block Reward
MVNEO - 100,000,000 -
*Performance since inception is annualized
Data as of 30 June 2020
38 No part of this material may be reproduced or referred to in any other publication without express
written permission of MV Index Solutions. All rights are reserved.MVIS CryptoCompare XRP Index (MVXRP)
The MVIS® CryptoCompare XRP Index covers the performance of a digital Component
assets portfolio which invests in XRP
XRP 100.00%
Total market capitalization – USD 7.75 billion
Index history back to 31 January 2015
Ripple (XRP) is a distributed peer-to-peer network - transactions occur
immediately across the network. The network is resilient to systemic risk. Liquidity
XRP is not mined - unlike Bitcoin and others. However, each transaction Top 5 Components Period Volume (USD)
destroys a small amount of XRP which adds a deflationary measure into the Average 1 Month June Review 147,172,679
system.
Currently, there are 40 billion XRP
Fundamental Data
Index Performance Value Index Records Value
Year-to-Date Performance -8.30% All Time High/Low 22,591 / 29
1-Year Performance -56.52% 52-Weeks High/Low 2,902 / 1,019
24,000
Since Inception 59.69% Quarter High/Low 2,366 / 1,019
21,000 Month High/Low 1,490 / 1,262
18,000
Index Values (USD)
15,000 Digital Asset Specifications
12,000
Max Supply Algorithm Proof Type
9,000 100,000,000,000 - N/A
Difficulty Adj. BlockRR. BlockNo.
6,000
1 block - -
3,000 Start Date Twitter Website
0 02.02.2013 @Ripple -
Jan-15 Oct-15 Jun-16 Feb-17 Oct-17 Jun-18 Feb-19 Oct-19 Jun-20 Network H/s Current Supply Block Reward
MVXRP - 99,991,850,794 -
*Performance since inception is annualized
Data as of 30 June 2020
39 No part of this material may be reproduced or referred to in any other publication without express
written permission of MV Index Solutions. All rights are reserved.MVIS CryptoCompare Zcash Index (MVZEC)
The MVIS® CryptoCompare Zcash Index covers the performance of a digital Component
assets portfolio which invests in Zcash
Total market capitalization – USD 0.48 billion Zcash 100.00%
Index history back to 30 November 2016
Zcash (ZEC) is a privacy-driven digital asset. It uses the Equihash as an
algorithm, which is an asymmetric memory-hard Proof of Work algorithm Liquidity
based on the generalized birthday problem.
Top 5 Components Period Volume (USD)
It relies on high RAM requirements to bottleneck the generation of proofs
and making ASIC development unfeasible. Average 1 Month June Review 56,600,352
Zcash uses zero-knowledge Succinct Non-interactive Arguments of
Knowledge (zk-SNARKs) to ensure that all information (sender, receiver,
Fundamental Data
amount) is encrypted, without the possibility of double-spending.
The only information that is revealed regarding transactions is the time in Index Performance Value Index Records Value
which they take place.
Year-to-Date Performance 85.54% All Time High/Low 11,981 / 348
1-Year Performance -50.58% 52-Weeks High/Low 1,549 / 348
12,500
Since Inception -7.18% Quarter High/Low 1,076 / 348
Month High/Low 855 / 734
10,000
Index Values (USD)
Digital Asset Specifications
7,500
Max Supply Algorithm Proof Type
5,000 21,000,000 Equihash PoW
Difficulty Adj. BlockRR. BlockNo.
2,500 - 0.5 899786
Start Date Twitter Website
0 28.10.2016 @zcashco -
Nov-16 May-17 Oct-17 Apr-18 Sep-18 Feb-19 Aug-19 Jan-20 Jun-20 Network H/s Current Supply Block Reward
MVZEC 7,038,023,024.00 9,583,663 6.3
*Performance since inception is annualized
Data as of 30 June 2020
40 No part of this material may be reproduced or referred to in any other publication without express
written permission of MV Index Solutions. All rights are reserved.Contacts
Management/Business Development Media Relations and Marketing
Thomas Kettner, Managing Director Séverine Thäsler-Jäger, Marketing Manager
Phone: +49 69 4056 695 31 Phone: +49 69 4056 695 53
Email: thomas.kettner@mvis-indices.com E-mail: media-enquiries@mvis-indices.com
Website
www.mvis-indices.com
41 No part of this material may be reproduced or referred to in any other publication without express
written permission of MV Index Solutions. All rights are reserved.Important Disclosures
Copyright © 2019 by MV Index Solutions GmbH (“MVIS”). All rights reserved. MVIS is a registered trademark of Van Eck Associates Corporation that has been
licensed to MV Index Solutions GmbH. Redistribution, reproduction and/or photocopying in whole or in part are prohibited without written permission. All information
provided by MVIS is impersonal and not tailored to the needs of any person, entity or group of persons. MVIS receives compensation in connection with licensing its
indices to third parties. You require a license from MVIS to launch any product that is linked to an MVIS index to use the index data for any business purpose and for
all use of the MVIS name or name of the MVIS index. Past performance of an index is not a guarantee of future results.
It is not possible to invest directly in an index. Exposure to an asset class represented by an index is available through investable instruments based on that index.
MVIS does not sponsor, endorse, sell, promote or manage any investment fund or other investment vehicle that is offered by third parties and that seeks to provide
an investment return based on the performance of any index. MVIS makes no assurance that investment products based on the index will accurately track index
performance or provide positive investment returns. MVIS is not an investment advisor, and it makes no representation regarding the advisability of investing in any
such investment fund or other investment vehicle. A decision to invest in any such investment fund or other investment vehicle should not be made in reliance on any
of the statements set forth in this document.
Investments into crypto currencies and/or digital assets are subject to material and high risk including the risk of total loss. The calculated prices may not be achieved
by investors as the calculated price is based on prices from different trading platforms. Furthermore, an investment into crypto currencies and/or digital assets may
become illiquid depending on the trading platform or investment product used for the specific investment. Investors should carefully review all risk factors disclosed by
the relevant trading platform or in the product documents of relevant investment products.
Prospective investors are advised to make an investment in any such fund or other vehicle only after carefully considering the risks associated with investing in such
funds, as detailed in an offering memorandum or similar document that is prepared by or on behalf of the issuer of the investment fund or other vehicle. Inclusion of a
security within an index is not a recommendation by MVIS to buy, sell, or hold such security, nor is it considered to be investment advice.
These materials have been prepared solely for informational purposes based upon information generally available to the public from sources believed to be reliable.
No content contained in these materials (including index data, ratings, credit-related analyses and data, model, software or other application or output therefrom) or
any part thereof (Content) may be modified, reverse-engineered, reproduced or distributed in any form by any means, or stored in a database or retrieval system,
without the prior written permission of MVIS. The Content shall not be used for any unlawful or unauthorized purposes. MVIS and its third-party data providers and
licensors (collectively “MVIS Indices Parties”) do not guarantee the accuracy, completeness, timeliness or availability of the Content. MVIS Indices Parties are not
responsible for any errors or omissions, regardless of the cause, for the results obtained from the use of the Content. THE CONTENT IS PROVIDED ON AN “AS IS”
BASIS. MVIS INDICES PARTIES DISCLAIM ANY AND ALL EXPRESS OR IMPLIED WARRANTIES, INCLUDING, BUT NOT LIMITED TO, ANY WARRANTIES OF
MERCHANTABILITY OR FITNESS FOR A PARTICULAR PURPOSE OR USE, FREEDOM FROM BUGS, SOFTWARE ERRORS OR DEFECTS, THAT THE
CONTENT’S FUNCTIONING WILL BE UNINTERRUPTED OR THAT THE CONTENT WILL OPERATE WITH ANY SOFTWARE OR HARDWARE
CONFIGURATION. In no event shall MVIS Indices Parties be liable to any party for any direct, indirect, incidental, exemplary, compensatory, punitive, special or
consequential damages, costs, expenses, legal fees, or losses (including, without limitation, lost income or lost profits and opportunity costs) in connection with any
use of the Content even if advised of the possibility of such damages).
42 No part of this material may be reproduced or referred to in any other publication without express
written permission of MV Index Solutions. All rights are reserved.You can also read