WIFIMON: COMBINING CROWDSOURCED AND PROBE MEASUREMENTS FOR WI-FI PERFORMANCE EVALUATION
←
→
Page content transcription
If your browser does not render page correctly, please read the page content below
2021 16th Annual Conference on Wireless On-demand Network Systems and Services (WONS)

      WiFiMon: Combining Crowdsourced and Probe
      Measurements for Wi-Fi Performance Evaluation
                           Nikos Kostopoulos                                Sokol Gjeçi                  Kurt Baumann
            School of Electrical & Computer Engineering                   IT Department                Network Department
               National Technical University of Athens                         RASH                          SWITCH
                           Athens, Greece                                 Tirana, Albania              Zurich, Switzerland
                   nkostopoulos@netmode.ntua.gr                            sgjeci@rash.al            kurt.baumann@switch.ch

                                Pavle V. Vuletić                                                  Kostas Stamos
       Department of Computer Science & Information Technology                  Computer Engineering & Informatics Department
         University of Belgrade, School of Electrical Engineering                            University of Patras
                             Belgrade, Serbia                                                  Patras, Greece
                        pavle.vuletic@etf.bg.ac.rs                                        kostas.stamos@gmail.com

      Abstract—We present WiFiMon, a lightweight active monitor-          Wi-Fi infrastructure, i.e. Access Points (APs) and/or Wi-Fi
   ing open source system for Wi-Fi network performance evalua-           controllers, mainly focus on determining if a Wi-Fi network
   tion and verification. Using an objective Quality of Experience        is operational on its whole. Therefore, they can provide an
   (QoE) assessment approach, WiFiMon is capable of capturing
   Wi-Fi throughput as experienced by end users without requiring         insight view into the current status of the Wi-Fi network,
   their intervention. This is possible via crowdsourced measure-         number of associated devices, channel utilization and so on.
   ments that are automatically triggered when the end users visit        However, the way end users perceive network quality is often
   websites preconfigured with WiFiMon technology. Crowdsourced           neglected and, as it will be shown in this paper, objective Wi-
   results are combined with probe measurements collected from            Fi infrastructure metrics do not always accurately represent
   small form factor devices located at fixed points within the
   monitored network; this enables Wi-Fi administrators to reach          the quality of the network service as experienced by the user.
   stronger conclusions about the performance of their networks.          There are some tools that monitor end user devices in an
   When deployed in IEEE 802.1X networks, WiFiMon provides                attempt to determine how the users experience Wi-Fi as they
   additional benefits, e.g. fine-grained performance analysis per        roam the network. However, these tests often rely on dedicated
   access point, by integrating data from available RADIUS and            applications and are triggered manually by users, which is not
   DHCP logs, which are correlated with the crowdsourced and
   probe measurements. Our system capabilities are demonstrated           always a solution that attracts users to widely adopt such tools.
   based on WiFiMon pilots, which took place in recent events with           The system described in this paper, WiFiMon, monitors the
   several hundreds of participants (TNC19 Conference, GÉANT             performance of Wi-Fi networks as experienced by their end
   Symposium 2020). We conclude that WiFiMon can effectively              users. Estimating QoE primarily assumes gathering subjective
   detect Wi-Fi performance fluctuations.                                 marks from users regarding how they perceive service quality.
      Index Terms—Wi-Fi performance monitoring and verification,
   crowdsourced and probe measurements, mobile crowd-sensing,             Objective QoE assessment is also possible as a time-efficient
   Quality of Experience (QoE), lightweight active monitoring             alternative using monitoring tools [1]. In that sense WiFiMon
                                                                          can be seen as an objective Wi-Fi network QoE estimation tool
                         I. I NTRODUCTION                                 because the monitoring process includes the complete end-to-
     Wi-Fi networks have become an essential part of our lives            end system effects that may influence user experience, i.e. end
   and one of the most common Internet access methods. The                user equipment, as well as network and service infrastructure
   constantly increasing popularity of Wi-Fi becomes evident in           [2]. As it will be described below, WiFiMon is based on mea-
   various aspects of everyday life, e.g. working environments,           surements of the HTTP service which constitutes the majority
   education facilities and recreational activities. Therefore, de-       of the average user’s traffic today. However, since the QoE
   velopment of systems that provide accurate and efficient Wi-Fi         is strongly dependent on the application, WiFiMon cannot be
   network performance monitoring is of vital importance.                 used as a QoE tool for all the services (especially interactive
     Although there are many tools that provide wireless network          voice or video). WiFiMon operates in passive objective testing
   monitoring services, they fail to effectively address Quality          mode [3], which means that the measurements are taken
   of Experience (QoE) in performance monitoring and verifi-              without the user intervention or any dedicated application.
   cation. Network Management Systems (NMS’s) that monitor                   Our system supports administrators by detecting Wi-Fi
                                                                          throughput degradation, hence allowing them to detect under-
     The work on WiFiMon receives funding from the European Union’s
   Horizon 2020 research and innovation programme under Grant Agreement   performing areas in their networks and, accordingly, enhance
   No. 856726 (GN4-3).                                                    Wi-Fi performance, e.g. by installing more APs. WiFiMon

ISBN 978-3-903176-35-5 © IFIP                                         100
2021 16th Annual Conference on Wireless On-demand Network Systems and Services (WONS)
can be used in any Wi-Fi environment, but offers addi- [12] suite of Wi-Fi tools allowing for Wi-Fi signal quality
tional benefits in the eduroam-enabled [4], or generally IEEE monitoring. Similarly, NetAlly AirMagnet WiFi Analyzer PRO
802.1X, campus networks. Crowdsourced measurements are [13] provides details about Wi-Fi network performance as well
triggered by end users, when they visit WiFiMon-enabled as issues with coverage, interference and roaming. Comparable
websites and/or use WiFiMon-enabled mobile applications. products are the Microsoft Wifi Analyzer and Scanner [14],
Although triggering measurements does not require any user Riverbed Wi-Fi Inspector [15], LizardSystems Wi-Fi Scanner
intervention or additional tools apart from the web browser, in [16], MetaGeek inSSIDer [17] and Netradar [18]. These
the WiFiMon terminology, the user’s device is called WiFiMon approaches require an installation from the end user, while the
Software Probe (WSP). WiFiMon combines crowdsourced performance results are not automatically communicated to the
measurements with deterministic ones derived from appro- network administrators, responsible for setting up the wireless
priately placed WiFiMon Hardware Probes (WHPs) at fixed network and optimizing its performance. Such approaches are
points within the monitored networks to provide complete suitable for checking Wi-Fi network quality in the premises
insight into network performance. WSP and WHP measure- of users, but not for sites with a large number of APs where
ments are correlated with the identity of end users and their a different approach is needed.
location, i.e. their associated AP. This information is exported There are several online tools/pages where users may man-
from RADIUS and DHCP logs associated with the monitored ually initiate measurements and retrieve information about the
end devices. This approach allows different forms of Wi-Fi performance of their connection, including Wi-Fi network,
network performance analyses (per user, per AP, per browser, e.g. Speedtest by Ookla [19]. Performance metrics usually in-
etc.). clude information about the download/upload throughput and
The basic principles of WiFiMon have been introduced in Round-Trip Time (RTT) [20], [21] towards a server installed
[5]. In this paper, we elaborate on new features incorporated in in a generally unknown place in the Internet. This means that
WiFiMon in the last two years. In particular, we (i) introduce test results include the impact of the cross traffic along all the
WHPs and describe their operation, (ii) detail privacy enhance- links between the user and the test server. Such online tools
ments in RADIUS/DHCP logs processing that safeguard end require that users initiate the tests and only themselves are
user sensitive data and (iii) evaluate the performance of our informed of the results and not the network administrators.
system, specifically WSPs and WHPs, in monitoring the Wi- Cnlab Speedtest [22] gathers test results executed by users
Fi network of two recent conference venues, i.e. the TNC19 in a central database and makes them available to licensees.
Conference and the GÉANT Symposium 2020. As several thousand private customers use the cnlab Speedtest
WiFiMon is offered as a service by GÉANT, the academic daily, it is possible to extract statistically relevant conclusions.
backbone interconnecting the European National Research and Research in wireless network traffic monitoring within uni-
Education Network (NREN) organizations. The documentation versity campuses also includes [23], where Pazl is proposed.
and open-sourced code of WiFiMon are available in [6]. Pazl is an indoor Wi-Fi monitoring system, which is based
The remainder of this paper is structured as follows: Section on mobile crowd-sensing to deliver low cost and automated
II describes related works; Section III includes the baseline de- wireless performance monitoring. Contrary to WiFiMon, Pazl
sign of WiFiMon; Section IV provides implementation details; requires the installation of a mobile application by end users.
Section V involves the system evaluation. Finally, Section VI In a recent study [24], Javed et al. created a system for
summarizes our work and discusses future directions. crowdsourced wireless network monitoring. However, in this
case, monitoring results are not gathered by the users and their
II. R ELATED W ORK devices, but from the APs as a channel utilization metric.
The WiFiMon approach was inspired by [7], namely to take NetBeez [25] is a network monitoring platform that ver-
advantage of opportunistic measurements. WiFiMon builds ifies end-to-end connectivity and network performance via
upon this approach and uses frequently visited websites to dedicated hardware and software agents. The agents can be
monitor how the users experience the quality of a wireless net- installed at multiple locations to monitor the status of the
work. This method differs from other approaches that monitor network and applications in real time from the end user
and verify performance using controllers to monitor stand- perspective. Network engineers can then review real-time and
alone APs and are based on ping or scripts and application historical performance data on the NetBeez dashboard. The
plugins that attempt to detect network events [8]. NetBeez platform resembles WiFiMon performance measuring
AP status can be monitored by processing SNMP objects using soft and hard probes, but differs regarding metrics and
from the Wi-Fi infrastructure. One such system that performs granularity of data analysis capabilities, while users monitored
network monitoring based on data from controllers, base by WiFiMon are not required to install additional software.
stations and the fixed network is Aruba AirWave [9]. However, WiFiMon differs from related works in that: (i) it enables
it does not take into account the end user perspective. Another "non-invasive" performance measurements without the inter-
similar tool is Paessler PRTG network monitor [10] which vention of users, (ii) there is a correlation among performance
uses SNMP, NetFlow and packet sniffing to verify device data, AP identifiers and end user information (RADIUS/DHCP
status including information from APs. Tools that focus on Logs), (iii) correlated data are posted to the same database,
the end user side include NetSpot [11] and Tarlogic Acrylic permitting a centralized view of Wi-Fi performance (complete
ISBN 978-3-903176-35-5 © IFIP 1012021 16th Annual Conference on Wireless On-demand Network Systems and Services (WONS)
history) and end user behavior within the network (heat maps). Agents installed within the RADIUS and DHCP servers, logs
are exported to the WAS for further processing. The informa-
III. BASELINE D ESIGN tion from the logs is necessary when WiFiMon Administrators
In this section we describe the overall architecture of our wish to carry out performance analysis that considers the
system and discuss its main design features. location of end devices within the network, e.g. throughput
measurements per AP in the network. Moreover, WHPs peri-
A. Overall Architecture odically collect wireless network metrics and stream them to
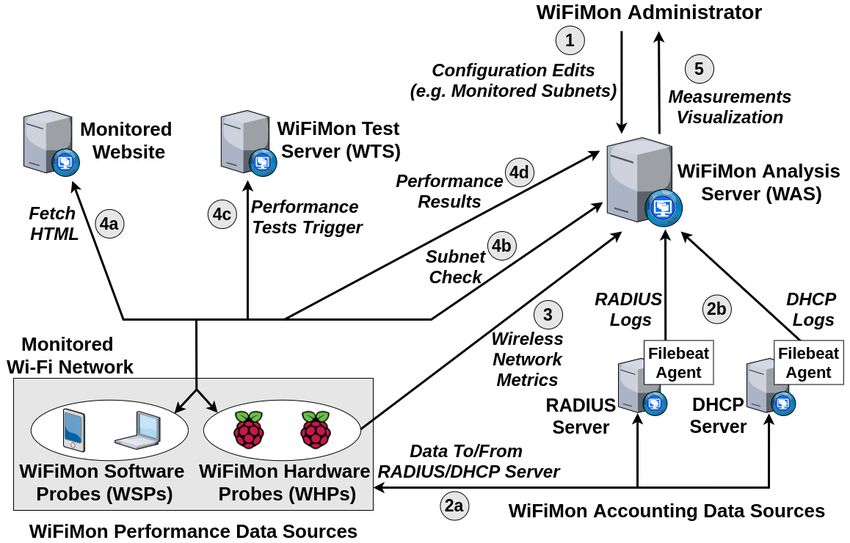
Fig. 1 depicts an overview of the WiFiMon overall architec- the WAS (step 3). Collected metrics include statistics extracted
ture. It follows the well-known monitoring system architecture from the wireless network interface of the WHPs, e.g. link
[26], which consists of monitoring agents and sources of quality and signal strength, along with information regarding
measurement data (in our case WSP, WHP and WiFiMon the surroundings of the WHP, such as the nearby ESSIDs and
Test Server - WTS) and the monitoring collector (WiFiMon statistics related to them.
Analysis Server - WAS). The WAS is responsible for data Performance data are gathered from active performance
processing, correlation, storage and visualization. It also acts tests executed by WSPs/WHPs and they provide estimations
as a monitoring system controller. of the download/upload throughput and HTTP ping round
trip time. Performance tests are initiated when Wi-Fi enabled
end devices, i.e. WSPs and WHPs, visit a monitored website
(step 4a). Upon fetching the HTML code from the monitored
website, end devices check whether they are located within
one of the monitored subnets by inspecting the configura-
tion available from the WAS (step 4b). WSPs and WHPs
monitored by the WAS trigger performance tests against the
WiFiMon Test Server (WTS) (step 4c) that holds the test
data and JavaScript code necessary for the operation of the
WiFiMon performance monitoring test tools. Test data are then
exchanged between WSPs/WHPs and the WTS, performance
results are calculated and they are, subsequently, streamed to
the WAS for further processing (step 4d). There, the results
of the measurements are correlated with the accounting data
to provide more accurate wireless network analysis.
Fig. 1: The overall architecture of WiFiMon
C. Design Features
B. WiFiMon Operation The main design features of the WiFiMon system are:
Initially, the WiFiMon Administrator provides the con- • Combination of crowdsourced and deterministic measure-
figuration required for the WAS (step 1, Fig. 1). Essential ments: WiFiMon uses measurements from both WSPs
configuration required by the WiFiMon Administrator includes and WHPs to reach stronger conclusions about the wire-
specifying the monitored Wi-Fi subnets. WiFiMon relies on less network performance. While crowdsourced measure-
end users visiting a popular website monitored by WiFiMon, ments report on how Wi-Fi is experienced by end users
e.g. the university site for campus networks. Since the mon- (WSPs), deterministic ones from probes (WHPs) monitor
itored website may be visited by various Internet users, this Wi-Fi performance from fixed points in the network.
step is required to discard performance tests originating from • Correlation with RADIUS and DHCP logs respecting end
end user devices outside the monitored Wi-Fi subnets. Thus, user privacy: The WAS correlates performance measure-
measurements from external networks are excluded, while data ments received from WSPs/WHPs with data available
from wired network segments in the same organization are not from the RADIUS and DHCP servers that hold the entries
considered as Wi-Fi monitoring results. This practice prevents of devices connecting to the Wi-Fi network. Correlation
WTS and WAS from being overloaded by processing irrelevant enables more accurate performance analysis by delivering
requests, but also enables focusing on the network segments Wi-Fi analysis reports per AP within the network. More-
that are of interest for performance evaluation. over, sensitive information originating from RADIUS and
There are three types of data processed by WiFiMon; (i) the DHCP logs, i.e. end user IP and MAC addresses, are
WiFiMon accounting data, (ii) the wireless network metrics anonymized before they are stored in the WAS in order
and (iii) the WiFiMon performance data. Accounting data are to safeguard end user privacy.
obtained from RADIUS and DHCP servers (step 2b, Fig. 1). • Independence of Wi-Fi technology and hardware vendor:
These servers hold the log entries which are created when the WiFiMon does not impose particular restrictions on the
WiFiMon performance data sources, i.e. WSPs/WHPs, con- type of monitored Wi-Fi network or specific hardware re-
nect to the monitored Wi-Fi network. Leveraging on Filebeat quirements. However, additional benefits are provided for
ISBN 978-3-903176-35-5 © IFIP 1022021 16th Annual Conference on Wireless On-demand Network Systems and Services (WONS)
IEEE 802.1X networks, e.g. eduroam, where correlation WTS is minimized. This way, the most realistic results can be
with RADIUS/DHCP logs may be performed. achieved. However, even if the placement of the WTS close to
• Lightweight, active monitoring that does not impact end the monitored network is impossible, WiFiMon will still pro-
user browsing experience: WiFiMon utilizes JavaScript- vide useful insight regarding Wi-Fi performance by capturing
based active measurement test tools. These are triggered the relative changes among the received measurements.
automatically when end devices visit a monitored web-
site, including the HTML script tags that redirect to the B. WiFiMon Software Probes (WSPs)
WTS. Test tools are based on downloading/uploading WSPs are user devices: smartphones, laptops or any other
small chunks of test data or images, hence they do not Wi-Fi enabled device in the monitored network. Devices
consume significant network bandwidth. Moreover, tests participate in the measurements when users visit the websites
are initiated after the monitored website has loaded in monitored by WiFiMon. Since the end user device’s protocol
the device of the end user. Therefore, test tools used by and software stacks (including operating system and browser)
WiFiMon do not interfere with the user Wi-Fi experience. participate in the monitoring, the results present an objective
measure of the network quality as experienced by users
IV. I MPLEMENTATION D ETAILS who surf the web [1]. WiFiMon approach does not require
In the following, we elaborate on the details pertaining to any additional software to be installed on user devices and
the WiFiMon components. measurements do not impact browsing experience. Additional
traffic that is injected into the network from active probing
A. WiFiMon Test Server (WTS)
is comparable with one average web page download. Unlike
The purpose of the WTS is to hold the code and test data WHPs which are installed at fixed locations, WSPs can capture
required for WiFiMon performance measurements. The WTS the perceived quality in any network section the user may be.
is implemented using an Apache web server and is based on As end users may repetitively visit the same web page
JavaScript technology to deliver performance analysis. The test and/or frequently refresh their browser, WiFiMon components,
tools utilized by WiFiMon are: (i) NetTest [27], (ii) Akamai i.e. the WTS and the WAS, could become overloaded with
Boomerang [28] and (iii) LibreSpeed Speedtest [29]. excessive processing. This problem is alleviated by introducing
Performance tests are initiated when end devices, i.e. WSPs a cookie with a customizable blocking time parameter (e.g. 5
and WHPs, within the monitored Wi-Fi networks visit a web- minutes) that is stored within WSPs. New tests by the same
site. This website contains HTML script tags pointing users to WSP are accepted by the WTS if the cookie parameter has
initiate the performance tests with the WTS using the available expired or has not been set yet.
JavaScript-based WiFiMon test tools. End devices exchange
test data with the WTS, calculate performance metrics and C. WiFiMon Hardware Probes (WHPs)
stream them to the WAS for further processing. Test data WHPs are small form factor single-board computers (e.g.
include either images of diverse sizes (up to 5 MB) for Raspberry Pi’s) with Wi-Fi capability. The purpose of the
NetTest and Akamai Boomerang or streams of data chunks for WHPs is to measure Wi-Fi performance from fixed loca-
LibreSpeed Speetest. Test tools provide WiFiMon with reports tions within the monitored wireless network where they
on the download/upload throughput and HTTP ping RTT as are installed. These measurements are useful for network
measured by end devices. administrators as they complement WiFiMon crowdsourced
Notably, throughput results of the WiFiMon performance measurements performed by WSPs.
measurements are expected to be lower than the maximum WHPs initiate tests to collect monitoring data about the Wi-
achievable throughput at the moment of monitoring. The Fi network and stream them to the WAS. Unlike WSPs, WHPs
reasons for this are the following: monitor the network periodically using the period defined by
• The WTS location. Increasing the distance, and hence the the WiFiMon Administrator. WHPs support two types of tests
RTT, between the WTS and WSPs/WHPs reduces the which are independent to one another. Specifically:
maximum achievable TCP session throughput between • Similarly to WSPs, WHPs trigger performance measure-
them (tests use HTTP, therefore TCP). ments with the WTS utilizing the same set of WiFiMon
• The TCP slow start and a gradually increasing conges- test tools. WHPs continuously monitor the Wi-Fi network
tion window mechanism. This prevents connections from from fixed points. Therefore, measurements of WHPs are
quickly achieving their maximum possible throughput regarded as deterministic since the distance between them
especially for smaller transfer units. and their associated AP remains relatively constant. Thus,
• The need to exchange relatively small files by the tests. a baseline comparison of the WHP measurements with
Smaller sizes reduce the network overhead created by the the crowdsourced ones is possible. Apart from the period
measurements, but impact test accuracy as the files are set by the WiFiMon Administrator, WHP test frequency
transferred while the window size still increases. is also regulated by a cookie parameter, like WSPs.
Accuracy loss of WiFiMon measurements can be reduced • WHPs collect data about the overall quality of the mon-
by placing the WTS as close as possible to the monitored itored Wi-Fi ESSID as well as the surrounding ones.
networks so that the distance between the end devices and the Metrics are collected directly from the wireless network
ISBN 978-3-903176-35-5 © IFIP 1032021 16th Annual Conference on Wireless On-demand Network Systems and Services (WONS)
interface; these involve the signal level, link quality, bit event timestamp. From the DHCP logs Logstash extracts the
rate and transmission (TX) power reported by the WLAN IP and MAC addresses of end users as well as the DHCP event
NIC. Moreover, WHPs track nearby Wi-Fi ESSIDs and timestamp. Personally Identifiable Information (PII), i.e. user
record their associated APs and signal strengths. IP and MAC addresses, are hashed using the HMAC-SHA-512
implementation of the Logstash fingerprint plugin [31] and a
D. WiFiMon Analysis Server (WAS)
secret password known to the WiFiMon Administrator. Thus,
The WAS collects data from the monitored wireless net- PII is stored anonymized in the WAS. Additionally, the logs
works, processes them, correlates them with the available are secured in transit using a TLS-encrypted channel based on
accounting data and provides visualizations to the WiFiMon the X-Pack Elastic Stack extension [32]. The overall procedure
Administrator. This component receives (i) log records from of obtaining and processing the logs is illustrated in Fig. 3.
the RADIUS and DHCP servers associated with the end The WiFiMon Agent receives wireless network metrics
users of the monitored network (accounting data), (ii) wireless and performance measurements from the monitored networks.
network metrics from WHPs and (iii) performance test results Wireless metrics from WHPs are simply converted into the
from WSPs and WHPs (performance data). The location of appropriate storage format and they are fed in Elasticsearch.
the WAS does not affect measurement result accuracy. The Performance measurements received from WSPs/WHPs are
overall functionality of the WAS is depicted in Fig. 2. correlated with the exported logs. Thus, identifying perfor-
mance per network AP becomes possible. WiFiMon Admin-
istrators may opt between two types of correlation: based on
(i) Framed-IP-Address, i.e. the end device IP, thus depending
solely on RADIUS logs, or (ii) Calling-Station-Id, i.e. the end
device MAC address, therefore utilizing both RADIUS and
DHCP logs. Concerning the first option, when a performance
measurement is received, the available RADIUS logs are
searched to determine the most recent record containing a
Framed-IP-Address that matches the observed end device IP.
As the Framed-IP-Address attribute may not always be present
in RADIUS logs, there is a second option that leverages on
DHCP logs. When a performance measurement is received,
DHCP logs are searched to find the MAC address of the end
device based on the observed IP. Then, RADIUS logs are
utilized to locate the most recent record including a Calling-
Station-Id that equals the MAC address of the end device.
Fig. 2: The operation of the WiFiMon Analysis Server (WAS) Since Logstash stores sensitive data extracted from logs
anonymized, correlation comparisons in the WiFiMon Agent
There are two modules that carry out the operations of the are performed directly on hashed strings. Thus, the IP ad-
WAS. These are (i) the WiFiMon Agent, which is responsible dresses obtained from performance measurements are first
for collecting and processing the received monitoring data, hashed with HMAC-SHA-512 algorithm utilizing the same
and (ii) the WiFiMon User Interface (WiFiMon UI), which secret password used by Logstash fingerprint plugin. Data
depicts the results of data processing. Both of these modules from RADIUS logs are combined with the user measurements
are developed in Java and utilize the Spring Boot framework. and the correlation results are stored in Elasticsearch.
The WiFiMon Administrator initially specifies parameters Finally, the WiFiMon UI retrieves the WiFiMon dashboards
essential for the operation of the WAS through the WiFiMon from Kibana and offers visualizations of the processed data to
UI; these include (i) the subnets monitored by WiFiMon, (ii) the WiFiMon Administrator. Such visualizations are: through-
details related to the monitored APs, (iii) WiFiMon UI users put per WHP, crowdsourced measurements per monitored
and their administrative privileges and (iv) options regarding subnet and measurements per operating system and browser.
data correlation. The aforementioned choices of the WiFiMon
Administrator are stored within a PostgreSQL database. V. E VALUATION
RADIUS and DHCP logs, exported from the corresponding In this section, we demonstrate the capabilities of WiFiMon
servers using Filebeat Agents, are preprocessed by the WAS in detecting Wi-Fi performance degradation. The evaluation is
Logstash instance. Logstash detains the data required for corre- based on two WiFiMon pilots that took place in major GÉANT
lations and stores them in the WAS Elasticsearch. Information networking events with several hundreds of participants; the
extracted from the RADIUS logs includes the IP and MAC TNC19 Conference and the GÉANT Symposium 2020.
address of end devices, i.e. the Framed-IP-Address and the In the sequel, we elaborate on details regarding the pilots,
Calling-Station-Id RADIUS attributes [30], the IP and MAC present their results and discuss their outcomes. Notably, the
address of the associated AP, i.e. the NAS-IP-Address and results depicted hereafter are averaged over all WiFiMon test
Called-Station-Id RADIUS attributes [30] and the RADIUS tools, i.e. NetTest, Boomerang and Speedtest.
ISBN 978-3-903176-35-5 © IFIP 1042021 16th Annual Conference on Wireless On-demand Network Systems and Services (WONS)
Fig. 3: Exporting and processing RADIUS and DHCP logs
A. WiFiMon Pilot at TNC19 with multiple devices. Between 14:00 and 15:20, during the
The first WiFiMon pilot was held in Tallinn, Estonia, during lightning talks session in the main hall which attracted nearly
TNC19 [33], June 17-19 2019. The conference had more than all conference participants, the WHP reported almost zero
800 participants. The pilot monitored the conference Wi-Fi throughput. Notably, apart from measurements reporting low
network that was setup for the conference days using only throughput, we observed that many measurements were lost
WHPs. Wi-Fi at the venue was based on Cisco Aironet 3700 during this time interval, presumably due to lost connectivity
with the controller installed locally. of the WHP. The installed APs were not able to connect all
During the pilot, five WHPs (Raspberry Pi 3 model B the users’ devices in the main hall. Between 15:20 and 16:30,
devices), have been distributed across the rooms of the venue. we noticed that the venue was less crowded since lots of
These rooms included (i) the main hall which hosted the participants had left the conference. Consequently, we observe
opening/closing plenary sessions and other major sessions, e.g. that the Wi-Fi performance was restored during this period.
lightning talks which gathered the majority of the conference Then, the average download throughput dropped again at 17:00
participants, (ii) the area where the coffee/lunch breaks and an when the opening reception, which was organized in the same
opening ceremony took place as well as (iii) other rooms of space, started. Finally, the Wi-Fi performance was restored
the venue that hosted smaller sessions. Each WHP triggered after 18:00 when most of the participants had left the venue.
performance measurements every 20 minutes. The WTS com-
ponent was installed in the Tallinn University of Technology,
while the WAS was hosted at SWITCH, the Swiss NREN.
This setup met the requirements of WiFiMon as the WTS was
placed close to the conference venue, hence the RTT between
the WHPs and the WTS was small (less than 4 msec).
Fig. 5: Average download throughput reported by the WHP placed
within the room of the TNC19 venue where coffee/lunch breaks and
the opening ceremony took place
Fig. 5 depicts the average download throughput of the WHP
placed in the room where the coffee/lunch breaks and the
opening ceremony happened for the larger part of the con-
Fig. 4: Average download throughput reported by the WHP placed
ference duration (Day 1 13:00 up to Day 3 15:00). Similarly,
within the main hall of the TNC19 venue it can be observed that the Wi-Fi performance degraded when
people were at the venue, while the throughput was higher
Fig. 4 depicts the average download throughput measured and more stable when participants were absent. In the periods
by the WHP placed in the main hall during the first conference when the venue was empty, download throughput fluctuated
day between 14:00 and 20:40 hours. Notably, APs were not between 4 and 5 MBit/s, with an average value of 4.61MBit/s
installed directly in the main hall and Wi-Fi connectivity there and standard deviation of 0.35 MBit/s. This value can be
was provided by those present in the adjacent spaces where considered as a baseline value for the achievable download
coffee/lunch breaks and the opening ceremony occurred. throughput of our setup which should be used to estimate later
Fig. 4 shows the expected throughput metrics behavior the performance degradation. This throughput is by no means
during an event where a lot of participants gather in one the maximum achievable throughput in the Wi-Fi network. It
place at the same time: throughput fell down in those places is the metric obtained in this specific situation in which the
where participants gathered and used Wi-Fi heavily, often WTS was not at the venue and with relatively small transfer
ISBN 978-3-903176-35-5 © IFIP 1052021 16th Annual Conference on Wireless On-demand Network Systems and Services (WONS)
files selected in order not to create a too large traffic overhead. After 17:00, most people left the venue as the symposium day
had ended. This is apparent in the crowdsourced measurement
B. WiFiMon Pilot at GÉANT Symposium 2020
results since Wi-Fi performance raised to greater levels.
The second WiFiMon pilot took place in Ljubljana, Slove- Fig. 7 depicts the average download throughput reported by
nia, during the GÉANT Symposium 2020, February 4-5 2020. WHPs #2 and #5 during the same day as on the measurements
During the pilot, WiFiMon monitored the performance of of Fig. 6. We observe that both WHPs follow similar trends
the eduroam ESSID. The Wi-Fi setup was the same as in and they were able to conceive the throughput drops reported
Tallinn, however on a smaller scale as there were around 250 by the WSP measurements of Fig. 6 around 11:00 and 16:00
participants at the symposium and the venue was a hotel. hours. WHPs were placed near the available power plugs of
During the pilot, we placed seven WHPs (Raspberry Pi the venue which were typically farther from the APs than the
3 model B devices), across the rooms of the symposium audience. Thus, WHPs reported less throughput than WSPs.
venue. Similarly to our first pilot, these rooms included the
main hall that hosted the major sessions, the room in which
coffee and lunch were served and rooms with smaller sessions.
WHPs triggered a measurement every 5 minutes. In addition
to TNC19, the pilot added measurements performed by WSPs,
thus combining crowdsourced results with deterministic ones
obtained from WHPs. The necessary HTML lines to perform
the WSP measurements were injected in the symposium
agenda which was often visited by the symposium participants;
their consent was obtained via the online registration platform.
Both the WTS and WAS were installed in ARNES (Slovenian
NREN) premises, just a couple of kilometers from the venue,
and were connected with an uncongested 1Gbps link.
Fig. 7: Average download throughput of WHPs #2 and #5 placed
within the main hall of the GÉANT symposium 2020 venue
Finally, Table I provides the average values of the wireless
network metrics and the averages of the performance measure-
ments as reported by each WHP of our setup. Wireless metrics
included signal level, bit rate, link quality and TX power,
while performance measurements involved download/upload
throughput and ping latency. The considered time interval
is the first symposium day between 10:00 and 18:00 hours.
We observe that the trends of the wireless network metrics
did not necessarily follow those of the performance measure-
ments. Indicatively, while WHP #1 reported the best average
Fig. 6: Average download throughput of the crowdsourced measure- link quality, its throughput results were among the worst.
ments in the GÉANT Symposium 2020 pilot Moreover, while WHP #5 had the worst link quality, the
measured throughput results were among the best. Correlation
Fig. 6 depicts the average download throughput reported by coefficients between the throughput and the wireless interface
the crowdsourced measurements (WSPs) during the first sym- metrics time series for the measurements given in Fig. 7
posium day between 10:00 and 17:30. The average download were in the range between -0.12 and 0.1, meaning almost
throughput dropped significantly in two time periods, between no correlation at all. This brings us to a conclusion that for
11:00 and 11:40 as well as between 15:30 and 16:00. As both the proper evaluation of Wi-Fi performance it is necessary
periods followed a coffee break, we may assume that more to combine multiple sources of performance information:
participants were visiting the symposium agenda at approxi- Crowdsourced and deterministic measurements from WSPs
mately the same time and position within the venue to decide and WHPs respectively are essential to reach solid conclusions
the next session to attend. A notable drop also exists between about the Wi-Fi performance and perceived network quality
12:30 and 14:00 hours, i.e. during and right after lunch time as high values of signal strength and link quality do not
when most participants gathered in less space. Around 12:20 necessarily guarantee high Wi-Fi throughputs [34].
and 15:20, higher levels of download throughput were reported
by crowdsourced measurements since participants were dis- VI. C ONCLUSION & F UTURE W ORK
tributed across many different sessions within the symposium We described WiFiMon, an open source system for mon-
venue and, presumably, specific APs were not overloaded. itoring Wi-Fi performance without requiring the intervention
ISBN 978-3-903176-35-5 © IFIP 1062021 16th Annual Conference on Wireless On-demand Network Systems and Services (WONS)
TABLE I: Wireless network metrics and performance results reported by WHPs in the GÉANT Symposium 2020 pilot
Average Average Average Average Average Average
WHP Average
Signal Level Bit Rate TX Power Download Throughput Upload Throughput Ping Latency
No Link Quality
(dBm) (Mbps) (dBm) (KBps) (KBps) (msec)
1 -43 71 67/70 31 1588 763 48
2 -52 49 58/70 31 2883 1500 30
3 -59 78 51/70 31 2644 1429 44
4 -59 59 51/70 31 1431 650 41
5 -66 75 44/70 31 2678 1514 23
6 -62 65 48/70 31 1758 890 41
7 -55 66 55/70 31 2730 1562 32
of end users. WiFiMon combines crowdsourced measurements [11] NetSpot, https://www.netspotapp.com/, accessed 2/2021
collected from end users with deterministic ones gathered from [12] Acrylic Wi-Fi, https://www.acrylicwifi.com/en/, accessed 2/2021
[13] NetAlly AirMagnet WiFi Analyzer PRO,
hardware probes placed at fixed locations within the network. https://www.netally.com/products/airmagnet-wifi-analyzer/, accessed
Moreover, WiFiMon correlates performance measurements 2/2021
with data available from the RADIUS and DHCP logs as- [14] Wifi Analyzer and Scanner, Microsoft,
https://www.microsoft.com/en-us/p/wifi-analyzer-and-scanner/
sociated with the end devices within the monitored networks, 9nblggh5qk8q?activetab=pivot:overviewtab, accessed 2/2021
therefore delivering fine-grained analytics. We validated the [15] Riverbed Wi-Fi Inspector, https://www.riverbed.com/au/archives/forms/
capabilities of our system based on data obtained from recent trial-downloads/xirrus-wifi-inspector.html, accessed 2/2021
[16] LizardSystems Wi-Fi Scanner, https://lizardsystems.com/wi-fi-scanner/,
WiFiMon pilots in highly attended events, i.e. TNC19 and accessed 2/2021
GÉANT Symposium 2020. Based on the outcomes of our [17] MetaGeek inSSIDer, https://www.metageek.com/products/inssider/,
pilots that monitored a large number of diverse users and accessed 2/2021
[18] S. Sonntag, J. Manner and L. Schulte, "Netradar - Measuring the
devices, we conclude that our system is capable of detecting Wireless World", in the 11th Int. Symposium and Workshops on
performance fluctuations in Wi-Fi networks. Modeling and Optimization in Mobile, Ad Hoc and Wireless Networks
In the future, we plan to enrich the capabilities of WiFiMon. (WiOpt), IEEE, pp. 29-34, Tsukuba Science City, Japan, 2013
[19] Speedtest by Ookla, https://www.speedtest.net/, accessed 2/2021
Specifically, we will investigate the utilization of time series [20] A. Saeed, S. F. Naseem and Z. R. Zaidi, "Mobility Estimation for
analysis and/or machine learning methods to promptly pre- Wireless Networks using Round Trip Time (RTT)", in the 6th
dict Wi-Fi outages. Furthermore, we will research additional International Conference on Information, Communications and Signal
Processing (ICICS), IEEE, pp. 1-5, Singapore, Singapore, 2007
options suitable for Wi-Fi performance monitoring, thus en- [21] S. Park, H. S. Ahn and W. Yu, "Round-Trip Time-based Wireless
riching the current WiFiMon toolset. Finally, we will install Positioning without Time Synchronization", in the 2007 International
WiFiMon in campus/enterprise networks and, thus, test our Conference on Control, Automation and Systems, IEEE, pp.
2323-2326, Seoul, Korea, October 2007
system for longer time periods, while including information [22] cnlab Speedtest, https://speedtest.cnlab.ch/en/, accessed 2/2021
from RADIUS and DHCP logs, omitted from our pilots. [23] V. Radu, L. Kriara and M. K. Marina, "Pazl: A Mobile Crowdsensing
Based Indoor WiFi Monitoring System", in the 9th International
R EFERENCES Conference on Network and Service Management (CNSM 2013),
IEEE, pp. 75-83, Zurich, Switzerland, October 2013
[1] ITU-T Recommendation G.1011, "Reference Guide to Quality of [24] Z. Javed, Z. Khan, J. J. Lehtomäki, H. Ahmadi and E. Hossain,
Experience Assessment Methodologies", July 2016, "Eliciting Truthful Data From Crowdsourced Wireless Monitoring
https://www.itu.int/rec/T-REC-G.1011-201607-I/en, accessed 2/2021 Modules in Cloud Managed Networks", in IEEE Access, Vol. 8, pp.
[2] ITU, "Quality of Service Regulation Manual", 2017, 173641-173653, September 2020
https://www.itu.int/pub/D-PREF-BB.QOS REG01-2017, accessed [25] NetBeez Wi-Fi Monitoring, https://netbeez.net/wireless-monitoring/,
2/2021 accessed 2/2021
[3] T. Hoßfeld and S. Wunderer, eds., "White Paper on Crowdsourced [26] P. Eardley et al., "A Framework for Large-Scale Measurement of
Network and QoE Measurements – Definitions, Use Cases and Broadband Performance (LMAP)", RFC 7594, September 2015
Challenges (2020)", March 2020, Würzburg, Germany, doi: [27] NetTest Code Repository, https://code.google.com/archive/p/nettest/,
10.25972/OPUS-20232 accessed 2/2021
[4] eduroam Homepage, https://www.eduroam.org/, accessed 2/2021 [28] Akamai Boomerang GitHub Repository,
[5] C. Bouras, K. Baumann, V. Kokkinos, N. Papachristos and K. Stamos, https://github.com/akamai/boomerang, accessed 2/2021
"WiFiMon: A Tool for Wi-Fi Performance Monitoring and [29] LibreSpeed Speedtest GitHub Repository,
Verification", in the Int. Journal of Wireless Networks and Broadband https://github.com/librespeed/speedtest, accessed 2/2021
Technologies (IJWNBT), IGI Global, Vol. 8, Iss. 1, pp. 1-18, 2019 [30] P. Congdon, B. Aboba, A. Smith, G. Zorn and J. Roese, "IEEE
[6] WiFiMon Homepage, https://wiki.geant.org/display/WIF 802.1X Remote Authentication Dial In User Service (RADIUS) Usage
[7] H. Ma, D. Zhao and P. Yuan, "Opportunities in Mobile Crowd Guidelines", RFC 3580, September 2003
Sensing" in IEEE Communications Magazine, Vol. 52, Iss. 8, pp. [31] Logstash Fingerprint Filter Plugin, https://www.elastic.co/guide/en/
29-35, August 2014 logstash/current/plugins-filters-fingerprint.html, accessed 2/2021
[8] D. R. Choffnes, F. E. Bustamante and Z. Ge, "Crowdsourcing [32] X-Pack Elastic Stack Extension, https://www.elastic.co/guide/en/
Service-Level Network Event Monitoring", in the ACM SIGCOMM elasticsearch/reference/current/setup-xpack.html, accessed 2/2021
2010, pp. 387-398, New Delhi, India, August 2010 [33] TNC19 Conference, https://tnc19.geant.org/, accessed 2/2021
[9] Aruba AirWave, https://www.arubanetworks.com/products/ [34] CommScope Blog, "Understanding Wi-Fi Signal Strength vs. Wi-Fi
network-management-operations/airwave/, accessed 2/2021 Speed", https://www.commscope.com/blog/2015/
[10] Paessler PRTG Network Monitor, understanding-wi-fi-signal-strength-vs.-wi-fi-speed/, accessed 2/2021
https://www.paessler.com/wifi-monitoring, accessed 2/2021
ISBN 978-3-903176-35-5 © IFIP 107You can also read