VMWARE VIEW 3 DESIGNING A SCALABLE SERVER AND STORAGE ARCHITECTURE WITH VMWARE INFRASTRUCTURE 3, DELL EQUALLOGIC PS5000XV, AND DELL POWEREDGE 2950 ...
←
→
Page content transcription
If your browser does not render page correctly, please read the page content below
VMware® View 3
Designing a Scalable Server and Storage Architecture with VMware
         Infrastructure 3, Dell EqualLogic PS5000XV, and
                   Dell PowerEdge 2950 Servers

                                               November 2008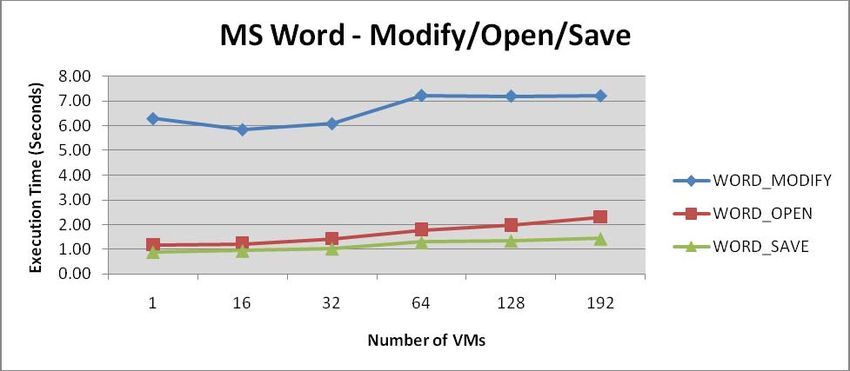
VMware Inc.                                                                                                                                                           Virtual Desktop Infrastructure

Contents

Executive Overview.......................................................................................................1
Introduction....................................................................................................................1
  Purpose and Use of this Document.......................................................................................................................................1
  Related Documents .........................................................................................................................................................................1
      Dell Publications .................................................................................................................................................................................................2
      VMware Publications ........................................................................................................................................................................................2

Business Challenge .......................................................................................................3
Virtualization Technology Solution ...........................................................................3
  Step-by-Step: Sizing the Solution............................................................................................................................................4
Target Worker Profile ...................................................................................................5
VMware View Server and Storage Building Block...................................................6
Solution Architecture....................................................................................................7
  VMware Infrastructure (Layer 1)................................................................................................................................................7
  Dell EqualLogic PS5000XV iSCSI Storage (Layer 2)........................................................................................................9
      Estimating Performance Requirements ..................................................................................................................................................9
      Estimating Capacity Requirements ...........................................................................................................................................................9
      Choosing a Disk Drive ................................................................................................................................................................................... 11
      Choose a RAID Level ...................................................................................................................................................................................... 11
      Choose an iSCSI Initiator.............................................................................................................................................................................. 12
      Adding Additional Capacity and Performance ................................................................................................................................ 12
      Snapshots ............................................................................................................................................................................................................ 12
      Thin Provisioning............................................................................................................................................................................................. 13
      Other Considerations .................................................................................................................................................................................... 13
  Dell PowerEdge Servers (Layer 3) .........................................................................................................................................14
  VMware View Manager and Clients (Layer 4)................................................................................................................15
      Virtual Desktop Configuration .................................................................................................................................................................. 16

Other Considerations................................................................................................. 17
Deploying the First Building Block............................................................................... 17
Conclusion ................................................................................................................... 18
Appendix A: Performance Data ............................................................................... 19
Appendix B: Hardware and Software Resources.................................................. 23

Technical White Paper                                                                                                                                                                                                     ii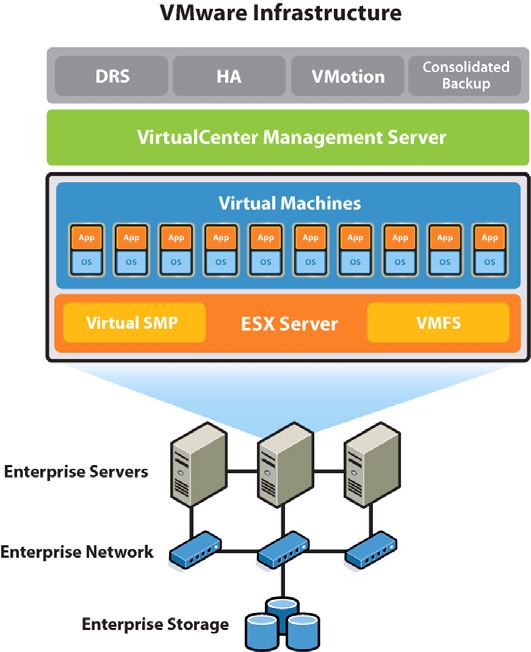
VMware Inc.                                                                        Virtual Desktop Infrastructure

Executive Overview
This document describes the results of work done by VMware in conjunction with Dell to create a scalable
server and storage architecture for VMware View environments. The configuration presented here uses a
building block approach for sizing VMware View environments built on VMware Infrastructure 3, Dell
PowerEdge 2950 servers and Dell EqualLogic PS5000X iSCSI storage arrays.
Each building block has been designed and tested to support 64 virtual desktops (8 per core) running a
workload commonly referred to as a “knowledge” or “information worker” (workload characteristics will be
defined later in this document). This worker profile runs a set of business applications common to many
corporate desktops today and is an ideal candidate for desktop virtualization.
Designing and testing a server and storage building block for a typical worker profile allows organizations
to use the configuration presented here as a reference for their own deployments. The building block has
been sized and tested according to both VMware and Dell best practices. This reduces the time, effort and
complexity of initial sizing exercises and allows IT staff to focus on deployment using a proven server and
storage configuration as a baseline.

Introduction
This document describes the approach used by VMware in developing a VDI server and storage
architecture. In this particular example, we have built the architecture using Dell-EqualLogic servers and
storage. This paper assumes that the reader already has a good understanding of desktop virtualization
and has reached the point where they are ready to begin sizing their server and storage architecture. In
this document, we begin by describing the worker profile that will be used as the basis for sizing the
environment. We then present the physical server and storage building block architecture designed for
this worker profile along with the approach used in our sizing exercises. This is followed by results of
performance testing done to validate the configuration.
The solution contains four primary layers:
•   Layer 1: VMware Infrastructure 3
•   Layer 2: Dell EqualLogic PS5000XV storage array
•   Layer 3: Dell PowerEdge 2950 servers
•   Layer 4: VMware Virtual Desktop Manager and Clients
The configuration and sizing of each layer is described in detail in the appropriate sections.

Purpose and Use of this Document
This document is intended for VMware and Dell personnel and their respective authorized partners.
Detailed implementation instructions are beyond the scope of this document.

Related Documents
Documents listed here provide additional information relevant to the solution described in this document.

Technical White Paper                                                                                         1
VMware Inc.                                          Virtual Desktop Infrastructure

Dell Publications
The following technical papers are available on the Dell website:
•   Dell PowerEdge Servers
•   Dell Resource website on VMware Infrastructure products
•   Dell EqualLogic website on EqualLogic in a VMware environment
•   VMware ESX™ 3.x Considerations, Configuration and Operation Using an EqualLogic PS Series SAN

VMware Publications
The following technical papers are available on the VMware website:
•   SAN System Design and Deployment Guide
•   ESX Performance Tuning Best Practices
•   iSCSI SAN Configuration Guide
•   iSCSI Design Considerations and Deployment Guide
•   VMwareView Manager 3 2.1 Reviewers Guide

Technical White Paper                                                                               2

VMware Inc.                                           Virtual Desktop Infrastructure

Business Challenge
Proper server and storage capacity planning is a critical component of a successful VMware View
deployment. VMware View presents its own unique set of sizing challenges with which many IT
professionals are not yet familiar. Traditional server and storage sizing best practices do not always apply
to virtual desktop environments, and there are a number of considerations specific to VMware View that
need to be considered. Many VMware View projects experience problems due to errors in sizing servers
and storage that result in an unsatisfactory end-user experience. These problems are often incorrectly
attributed to poor performance of virtual desktop technology, when in fact they are a result of poor server
and storage sizing.
In addition, choosing the inappropriate server and storage can negatively affect the ROI of the solution.
High-power servers with multiple cores and high-memory density can be very costly and drive up the cost
per virtual machine. Conversely, underpowered servers may not be able to support enough virtual
desktops per ESX host and also affect the cost per virtual machine. The right server hardware must balance
the cost per virtual machine with the overall number of ESX hosts that need to be managed as part of the
VMware View environment.
The right storage solution also plays a large part in overall cost of the VMware View solution. Sizing
VMware View storage is much different then sizing for traditional server workloads and presents some
unique design challenges. The right storage solution needs to consider the unique requirements for
VMware View environments while providing adequate performance, capacity and scalability at the lowest
possible cost.

Virtualization Technology Solution
This document outlines a proven approach to sizing servers and storage to address many of the challenges
mentioned above. VMware and Dell have created a server and storage design using a building block
approach. Each building block has been designed to support approximately 64 desktop virtual machines
running a workload that is representative of a user running a common set of business applications.
The building block has been designed according the best practices specific to VMware View environments.
The building blocks have been pre-sized and tested and can be fine-tuned to meet the specific
requirements of each unique environment in which they will be deployed.

Technical White Paper                                                                                     3
VMware Inc.                                             Virtual Desktop Infrastructure

Step-by-Step: Sizing the Solution
Sizing a desktop virtualization environment that uses VMware Infrastructure software and Dell server and
storage platforms depends on several key factors. On the client side, the desktop configuration and user
workload profile largely determine how many desktops can be hosted on a single VMware ESX host.
Administrators must appropriately size the Dell PowerEdge™ servers hosting the desktops and the Dell
EqualLogic storage area network (SAN) storing the virtual disks to help ensure that an optimal number of
desktops can run wit h adequate user response times. The following steps can help collect the necessary
information:
1.   Measure physical desktop usage: Understanding how different applications affect physical
     processor, memory, network and storage resources is of key importance when sizing the virtual
     desktop servers and storage. The Windows Performance Monitor tool can be used to collect required
     information on a typical Windows desktop. In larger environments, VMware Capacity Planner can
     collect the physical metrics that help estimate virtual machine requirements.
2.   Estimate processor requirements: To estimate processor requirements, Administrators can use
     Windows Performance Monitor to measure average processor utilization for the physical desktop, then
     multiply the measurement by the targeted number of virtual desktops for each VMware ESX host.
     Other factors to consider include storage and network virtualization overhead, remote display
     connection protocol overhead, and incorporating sufficient headroom to account for period for spikes.
3.   Estimate memory requirements: Because memory usage can vary based on VMware ESX page
     sharing, calculating memory requirements requires some estimates. The high-water mark can be
     estimated by ignoring the effect of page sharing. For example, to create 64 virtual machines with 512
     MB of RAM each, a hypervisor without page sharing would require at least 32 GB of RAM. With page
     sharing on the ESX host, actual memory requirements in production will be much lower. In our testing
     of 64 virtual desktops with 512MB RAM each on an ESX host machine with 32GB of physical RAM,
     actual memory consumption on the ESX host was approximately 19GB, with 13GB reclaimed by ESX
     page sharing.
4.   Calculate network requirements: Dividing the estimated traffic by the speed of the network
     interface card (NIC) yields the number of NICs typically required. To avoid large queuing delays, it is
     better to size for about 70% utilization on the NICs (0.7 * NIC speed). Administrators should also
     consider the type of NICs used, multimedia applications, shared folders, and the connection broker
     protocol. Additional NICs should be added for appropriate levels of hardware redundancy.
5.   Estimate storage capacity and performance requirements: Typical VMware View deployments will
     separate the system drive from the data drive on each desktop so that minimal user data is stored
     inside the system disk itself. When calculating storage requirements, both system drive storage and
     user data storage need to be considered. For performance requirements, consider both the I/O per
     second (IOPS) and storage throughput data gathered from the physical workload. Given the significant
     capacity of disk drives today and modest throughput requirements of many common VMware View
     workloads, in practice, administrators should give careful attention to creating a storage configuration
     with enough disk drives to meet the aggregate IOPS requirements. We present an example for sizing
     storage capacity and performance requirements using full clones and linked clones later in this
     document.
Using the information acquired in these steps, IT organizations can create an optimal configuration for
virtual desktop environments. As a final step, administrators should deploy the configuration in a proof-of-
concept pilot test environment to monitor and validate performance.

Technical White Paper                                                                                          4
VMware Inc. Virtual Desktop Infrastructure Target Worker Profile Our building block has been designed to support 64 virtual desktops running a common set of business applications performing common functions. The worker profile and associated applications have been identified by research done by VMware to study the most common type of desktop worker. In particular, the configuration was designed and tested with the following applications: • Microsoft Word (open, modify random pages, save and close) • Microsoft Excel (writing to cells, sorting, formulas, charts) • Microsoft PowerPoint (slideshow and edit slides) • Adobe Acrobat (Open and browse random pages) • Microsoft Internet Explorer (browse plain-text and web album) • WinZip (install/uninstall) • McAfee VirusScan (continuous on-access scan) To simulate a real-world VMware View environment, VMware used software from AutoIT (for more information, go to http://www.autoitscript.com) to simulate desktop workers running the applications and functions listed above. The AutoIT workload randomizes these applications and functions on each virtual desktop and keeps multiple applications open simultaneously to mimick actual user work patterns. The AutoIT workload has the following configurable parameters: • Knowledge/Power user (different size of files and number of application instances) • Think time (time between operations) • Variable words/minute type rate • Number of iterations • Run with/without virus scan in the background Each virtual desktop runs the applications and tasks listed above in a random order, with a random “think time” variable inserted to simulate human usage patterns. This allows the workload to closely resemble human activity on a virtual desktop that uses a common set of Office business applications. Using this workload, VMware was able to test various scenarios to determine the optimal number of virtual desktops that can run on a given ESX host and storage configuration while maintaining satisfactory performance and end-user experience. Every VMware View environment will have its own unique performance characteristics based on the specific end-user requirements. There is no “one-size-fits-all” configuration for server and storage. However, this configuration provides a reference for organizations looking to virtualize desktops with similar requirements as those described here. For results on performance testing the building block with 64 virtual desktops per server, see Appendix A. On a physical desktop, a similar workload measured with Windows Performance Monitor would show approximately the resource usage described in Table 1. Technical White Paper 5
VMware Inc. Virtual Desktop Infrastructure
Table 1. Measuring resource requirements for target worker profile on a physical desktop
Resource Measurement Measured Value (Average)
CPU Usage Perfmon: Processor\% Processor Time 2.79% (130MHz)
Memory Consumption Perfmon: Memory Available Mbytes 254MB (512MB total)
Storage Throughput Perfmon: Physical Disk\Bytes Transferred/sec 117760
Storage IOPS Perfmon: Physical Disk\Transfers/sec (IOPS) 5
Network Throughput Perfmon: Network Interface: Bytes Transferred/sec 245
These numbers will be used as examples in our sizing calculations for the remainder of this paper.
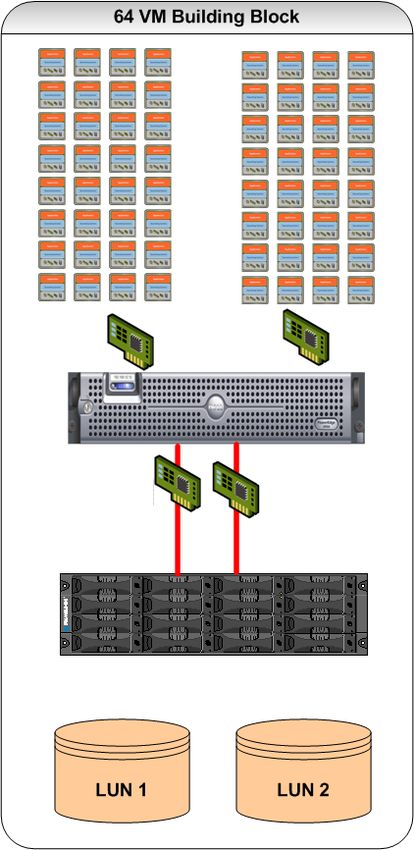
VMware View Server and Storage Building Block
Figure 1 below represents the building block that has been designed and tested to support 64 virtual
desktops running our target worker profile described above. In the following sections, we will outline the
approach used to size this configuration.
• 64 virtual desktops per ESX host machine
• Dell PowerEdge 2950
- ESX 3.5 Update 2
- Dual quad-core Xeon @ 2.67GHz
- 32GB RAM
• 2 x 1GB NICs for virtual machine network
• 2 x 1GB NICs for iSCSI network
• EqualLogic PS5000XV storage array
• 146GB SAS drives
- 2 x 410GB LUNs
- 32 virtual desktops per LUN
Figure 1. 64 Virtual Desktop Building Block
Technical White Paper 6VMware Inc. Virtual Desktop Infrastructure
Solution Architecture
We will take an in-depth look at the core components that make up the Dell-VMware VMware View
reference configuration. For simplicity, the solution can be broken down into four primary layers, each one
building on the one below it and all layers working together to provide a complete platform for a VMware
View deployment for mid-size enterprises. The four layers of the solution are the following:
• Layer 1: VMware Infrastructure 3
• Layer 2: Dell EqualLogic PS series array
• Layer 3: Dell PowerEdge servers
• Layer 4: VMware Virtual Desktop Manager and Clients
The sections that follow are not intended to provide a detailed implementation guide, but serve instead as
a reference that can be used for similar deployments modeled on the architecture built and tested by
VMware and Dell. Every environment is different and many organizations may already have deployed some
or all of the components outlined in this guide. Organizations can decide which components they need to
achieve their desired VMware View environment.
VMware Infrastructure (Layer 1)
The building block configuration was designed and tested using VMware Infrastructure 3 as the foundation
to create a virtualized desktop infrastructure. VMware Infrastructure 3 abstracts processor, memory, storage
and networking resources into components that can serve multiple virtual machines, providing greater
hardware utilization and flexibility. Figure 2 describes the core components of VMware Infrastructure.
Figure 2. VMware Infrastructure
Technical White Paper 7VMware Inc. Virtual Desktop Infrastructure
The VMware View configuration presented here was built as follows:
Enterprise storage:
• Dell EqualLogic PS5000XV storage array
• 146GB 15K SAS drives
• Storage Array Firmware v3.2.4
Enterprise network:
• VLAN 1: Virtual machine network
- 2 x 1GB NICs
- 32 virtual machines per NIC
• VLAN 2: iSCSI network
- 2 x 1GB NICs
Enterprise servers:
• Dell PowerEdge 2950
- Dual quad-core Intel Xeon at 2.67GHz
- 32GB RAM
- 4 x 1GB NICs (2 for virtual machine network, 2 for iSCSI)
ESX Host:
• VMware ESX 3.5.0 (build 110268)
Virtual Machines:
• Windows XP Pro SP2
• 1 vCPU
• 512MB RAM
VirtualCenter Management Server:
• Dell PowerEdge 1850
• VirtualCenter 2.5.0 (Build 104215)
VMotion/DRS/HA/VCB:
• Enterprise features for virtual machine management and availability
• Limited testing was done to validate functionality
Technical White Paper 8VMware Inc. Virtual Desktop Infrastructure
Dell EqualLogic PS5000XV iSCSI Storage (Layer 2)
Solution storage is based on the Dell EqualLogic PS Series storage subsystem. iSCSI provides an ideal
solution for VMware View environments by providing cost-effective storage with excellent performance.
Storage building blocks were designed with the following characteristics:
Table 2. Storage building block characteristics
VMs per LUN 32
Disk drive 146GB SAS
RAID type RAID 50
iSCSI initiator ESX s/w initiator
The following approach was used to size storage for the 64 virtual machine building block:
1. Estimate performance requirements
2. Estimate capacity requirements
3. Choose a disk drive type
4. Choose a RAID level
5. Choose an iSCSI Initiator
Estimating Performance Requirements
The best method for assessing performance requirements is to collect disk performance statistics on a
user’s desktop system during normal operation. This information can help size the performance
requirements of the virtual environment.
From Table 1, our target worker profile was measured on a physical desktop and shown to generate, on
average, five I/O per second (IOPS) and 115KBps throughput. Using this information to size 64 virtual
desktops we can estimate the following:
• 64 VMs x 5 IOPS per VM = 320 IOPS
• 64 VMs x 115KBps = 7360 KBps
These numbers represent a starting point for storage sizing performance requirements. Different disk drive
types (SAS, SATA etc) have different performance characteristics in terms of IOPS and throughput, so the
performance requirements above are important when selecting a disk drive and designing a storage
solution that can provide sufficient performance.
It is also important to consider sizing based on average and peak performance requirements. Appendix A
provides information from our performance testing of 64 virtual desktops and compares average and peak
performance requirements. For the purposes of our sizing exercise, we will continue to base designs on
average values, however it is recommended to include sufficient headroom in the storage solution to
accommodate spikes. One of the benefits of the EqualLogic PS-series array is its ability to allow easy
expansion of performance headroom simply by adding additional disk drives to the array.
Estimating Capacity Requirements
To begin estimating capacity requirements, the size of the system drive that will be allocated to each
virtual desktop needs to be determined. Typically, this will range from 10-20GB and depends primarily on
the operating system and applications that will be installed. Our building block allocated 10GB to each
virtual machine for the system drive.
Technical White Paper 9VMware Inc. Virtual Desktop Infrastructure
We must also decide on how many virtual machines will be deployed on each LUN. This decision is usually
dependent on the particular storage array that will be used. For VMware View environments, some general
recommendations are as follows:
• 30-40 .vmdk for average I/O virtual machines
• 15-20 .vmdk for heavy I/O virtual machines
For a more detailed discussion on this topic, please see the following whitepaper:
http://www.vmware.com/resources/techresources/1059
Since our target worker profile falls into the “average” I/O category, we have sized the building block with
32 virtual machines per LUN. We can use a basic formula for estimating our capacity requirements for 64
virtual machines, which will be spread across two LUNs, each containing 32 virtual machines:
Capacity Requirement = (Size of vmdk) + (VM RAM) + (suspend/resume) + (100MB per VM for logs)
Applying this formula to our building block with 32 virtual machines per LUN:
• 32 VMs x 10GB (size of .vmdk) = 320GB
• 32 VMs x 512MB (Amount of RAM allocated to each VM) = 16GB
• 32 VMs x 512MB (suspend/resume) = 16GB
• 32 VMs x 100MB (logs) = 4GB (rounded)
• Base requirement for 32 virtual machines per LUN = 356GB
• Adding 15% free space to the LUN 410GB
The calculation shown above is an example of sizing storage using full clones, where each virtual desktop
will have its own persistent virtual disk. While this is a simple solution to size and deploy, it can result in
greater cost as the solution scales up with additional building blocks. To reduce the cost of VMware View
storage as the solution scales, there are additional options that can be used:
1. Snapshots: EqualLogic storage arrays can take a snapshot of a LUN at a point in time and provide it to
VMware ESX as a new writable datastore. All changes to the snapshot are written into a different
location on the array; however, all reads can access both the changed information and the original
datastore. This feature allows the creation of virtual machines such as those used in VMware
Workstation and VMware Lab Manager, where a base read-only disk is used to generate each virtual
machine, and all changes are written to “delta” disks. Storage savings can be achieved by creating a
datastore with, for example, 32 Windows XP images, and then copying the datastore as a snapshot and
presenting it to VMware ESX multiple times. This presents the VMware View environment with virtual
machines ready for sysprep, renaming, and deployment. The on-disk usage is that of the original VMDK
instances and only the changes are written to the individual virtual machines.
2. VMware View Composer: VMware released VMware View 3, the next generation of VMware View on
Dec. 2, 2008. VMware View Composer, is one of the new components included in this bundled solution
and it provides the following benefits when deployed in a VMware View environment:
• Reduces storage costs from 40 to 90%.
• Reduces desktop provisioning from 15 minutes to just seconds.
• Manages hundreds of desktops from a single central image, retaining user settings when updating
or patching service packs, application updates or even OS upgrades.
• Rolls back instantaneously, enabling customers to streamline management and guarantee that all
user systems are up to date.
• Reduces the number of images to manage.
It should be recognized that these technologies need to be applied carefully, as they potentially incur an
impact to performance, by inducing a greater load on a more limited set of shared storage resources. A
classic storage sizing tradeoff exists between configuring storage to optimize cost and capacity at the
Technical White Paper 10VMware Inc. Virtual Desktop Infrastructure
expense of performance. The performance requirements as defined by our workload in this study indicates
that the aggregate I/O workload of a virtual desktop infrastructure is non-trivial, requiring storage sizing to
consider both cost and IOPS performance. For information on deploying storage solutions based on
VMware View Composer, please contact your VMware or Dell representative.
Choosing a Disk Drive
Choosing the right disk drive for enterprise storage is a two-pronged decision. The first choice between
performance and capacity is largely determined by the application and expected duty cycle and workload
environment. The second decision is the drive’s interface.
One of the most important parameters for improving performance is the higher spindle speed, which
improves the internal data rate and reduces latency. The main way to decrease access time is to increase
rotational speed, while the main way to increase throughput and storage capacity is to increase arial
density.
In considering the best choice of disk drive for enterprise or desktop applications between Serial Attached
SCSI (SAS) and Serial ATA (SATA), performance, cost, capacity, integrity, scalability and flexibility all have to
be factored into the decision. SATA drives can be suitable for entry- level enterprise applications, and disk
enhanced backup or reference data. For mission critical applications requiring a high level of performance
and data integrity, SAS drives are the preferred choice due to higher rotational speed, and given their
lower density, the likelihood of a greater number of spindles in use to achieve a given capacity point. SATA
drives also may be appropriate, but the performance impact of fewer, higher density, slower drives must
be considered.
Testing our storage building block in the lab was based on using the 146 GB, 15K RPM SAS drives. Results
on basic testing can be found in Appendix A. For solutions based on other disk drive models, ensure the
solution can meet the base performance and capacity requirements described above.
Choose a RAID Level
Dell EqualLogic PS Series storage arrays protect data by using RAID technology and spare disks. The PS
Series storage arrays offer RAID 5/10/50 support.
• RAID-10. Striping on top of multiple RAID 1 (mirrored) sets, with 1 or 2 spare disks (depending on the
total number of disks in the array). RAID-10 provides good performance for random writes, in addition
to the highest availability. However, since the disks are mirrored, RAID 10 provides the least capacity.
• RAID-50. Striping on top of two RAID 5 (distributed-parity) sets, with 1 or 2 spare disks (depending on
the total number of disks in the array). RAID-50 provides for performance, reliability and capacity.
• RAID-5. One RAID 5 set, with one spare disk. RAID-5 is similar to RAID-50, with more capacity (two
additional disks) but lower availability and random write performance when compared with the other
RAID types.
When adding a member to a PS Series group, choose the RAID policy for that member. After adding an
array to a group, the storage in the member will be available once you set the RAID policy. The disks are
automatically configured according to the designated RAID level, with the appropriate number of spare
disks.
Consider the workload in the virtual environment to determine which RAID level to use for the PS Series
storage. Determining which RAID level is best for an application depends on the workload (heavy or light)
and how the application performs I/O (small random transfers or large sequential transfers). Both RAID 10
and RAID 50 provide excellent reliability for data, in addition to overall high performance. RAID 50 provides
the most storage capacity, while RAID 10 provides the best performance for workloads that are mostly
small random writes. RAID 5 provides the greatest capacity at the expense of performance.
We chose RAID 50 since it provides a balance of performance, availability and capacity.
Technical White Paper 11VMware Inc. Virtual Desktop Infrastructure
Choose an iSCSI Initiator
With the advent of VMware Infrastructure 3, iSCSI initiators are integrated into the ESX kernel, allowing
native access to iSCSI storage directly from ESX host machines. Both hardware initiators (QLogic™
QLA404xC, QLA406xC) and software initiators are available. NIC teaming (multiplexing a single logical
connection across multiple interfaces) is supported with the software initiator. The hardware initiator
includes support for multipathing as well as boot from SAN.
Hardware iSCSI Features and Limitations
Below are some items to consider when using the iSCSI hardware initiator:
• ESX host booting from iSCSI SAN is possible only with hardware iSCSI initiator.
• Multipathing support is available for failover only, not load-balancing.
• Support is available for VMware vMotion, VMware HA, and VMware DRS.
• Support is available for RDMs.
Software iSCSI Features and Limitations
Below are some items to consider when using the iSCSI software initiator:
• No support is availabe for booting the ESX host from software iSCSI.
• Software initiator supports a single storage interface (vmhba32).
• Multipathing support is for failover only, not load balancing, by using multiple physical network
adapters (NIC teaming).
• Support is available for VMware vMotion, VMware HA, and VMware DRS.
• Support is available for RDMs.
The decision between hardware and software initiators is essentially a trade-off between price and
performance. With network adapters costing about $100 each and iSCSI HBAs costing about $550, the
potential savings of $450 needs to be weighed against the impact on both throughput and CPU utilization.
Appendix A contains results of comparing CPU utilization on an ESX host running our 64 virtual machine
building block with both software and hardware iSCSI initiators. Given the relatively modest I/O
requirements of our target VMware View workload, performance was relatively even between both initiator
choices.
Adding Additional Capacity and Performance
Storage administrators can add EqualLogic arrays online without disruption, and data are automatically
load balanced across disks, controllers, cache, and network ports. At the same time, the SAN retains the
single device view – not only to servers accessing data, but also to administrators, who have a single point
of management regardless of the number of arrays. Multiple arrays join together (transparently to
applications) to act as a single device. When arrays are added, the PS Series automatically and continuously
distributes and balances workloads across the environment to optimize performance. A PS Series SAN uses
a peer-storage architecture that can grow incrementally and can be comprised of different units that fully
interoperate as a single pool or multiple tiers of storage.
Snapshots
Dell EqualLogic PS Series arrays provide snapshots that support up to 512 snapshots per volume,
thousands of snapshots per array, and read-only as well as read/write snapshots. Auto-Snapshot
Manger/VMware Edition (ASM/VE) creates space efficient copies of virtual machines for business
continuance planning and recovery. ASM/VE leverages VMware snapshot technology to place virtual
machines in the native snapshot mode, takes a SAN-based snapshot and then returns the environment to
its normal state. Integrated directly with standard VMware and EqualLogic application programming
Technical White Paper 12VMware Inc. Virtual Desktop Infrastructure
interfaces (APIs), Auto-Snapshot Manager/VMware Edition understands the relationships and location of
virtual machines, VMFS Datastores, and PS Series SAN-based volumes.
With intuitive SAN and VMware-centric navigation and a built-in scheduler, the VMware administrator can
simply and flexibly set snapshot creation schedules of individual virtual machines, groups of virtual
machines, or even all virtual machines in a VMware Datacenter, coordinating snapshot creation across all
SAN-based volumes upon which the virtual machines reside. Utilizing the SAN based snapshots while
virtual machines are in snapshot mode provides hypervisor-aware protection for faster restores and
scalable protection required in virtualized server deployments.
Thin Provisioning
Thin provisioning is an approach to storage provisioning that simplifies managing growth while adding
some additional management requirements. It is best suited for two kinds of environments: Those with
significant planned storage growth, and those for which stranded storage is likely to be an issue. Thin
provisioning allows administrators to reduce the total purchased storage at any given time by reducing
stranded storage allocated to servers. The result is an increase in storage utilization rates. When additional
physical storage is needed, it can be added easily without server/application management or downtime.
The operating system sees a consistent logical volume size, and the increase in physical storage allocation
to the volume is transparent to operations. Administrators can monitor and manage storage utilization at
the PS Series pool level and plan to add physical storage resources as needed.
Other Considerations
Proper storage sizing in VMware View environments starts with an understanding of the VMware View I/O
workload characteristics. Here are some important points to consider about the VMware View workload:
• Sizing can be tricky as there are large variances between average and peak I/O. I/O requirements are
generally very low during normal operation, which leads to a low average utilization. However, most
disk activity is the result of the user opening/closing/saving applications. If multiple virtual desktops
on an ESX host perform these actions at the same time, the result is “bursty” I/O with high spikes. If the
storage is not designed to handle these spikes, end-user performance may suffer. When sizing storage,
examine average and peak requirements and size based on your SLAs.
• Consider other factors that can cause spikes in disk I/O. Be sure to account for the factors that can
negatively affect storage performance and ultimately have an impact on the end-user experience.
Important considerations include:
- Guest OS patching: Patching all the virtual desktops on a single LUN at the same time can cause
a spike in disk I/O to that LUN. Consider staggering patch rollouts or performing them during off
hours or maintenance windows.
- Manual virus scans: The ability for users to initiate their own virus scans can cause increased disk
I/O, especially if multiple users are doing these scans simultaneously.
- Desktop search tools: Desktop search tools installed inside the guest OS can also cause increases
in disk I/O.
- De-fragmentation: If users have the ability to run their own disk defrag during normal business
hours, increases in disk I/O can result, affecting all users sharing the same LUN for their virtual
desktops.
- Cold boot, suspend/resume operations: Consider the effects if all users start work at the same
time and all boot their desktops simultaneously. Suspending desktops is preferred over cold
shutdown as the desktop can resume from suspend operations much quicker with less impact on
the disk subsystem.
Technical White Paper 13VMware Inc. Virtual Desktop Infrastructure
Dell PowerEdge Servers (Layer 3)
In this design example, Dell PowerEdge servers were selected. Figure 3 below shows how the environment
was built in the lab using three building blocks based on the Dell PowerEdge 2950.
Virtual VDM Domain
Center Server Controller
Building Block 1
®
Building Block 2
®
Building Block 3
®
®
IP WAN
PS-Series
1Gb Switch 1Gb Switch
Vmotion Network
Production Network iSCSI Network 2
VLAN
Figure 3. VMware View Test Lab Setup
Selecting the proper server for VMware View environments requires careful consideration and attention to
the following criteria:
• Cost per virtual machine: The cost per virtual machine can be estimated as the overall cost of the
physical server divided by the number of virtual desktops it can support in a production VMware View
environment. The right server selection provides a balance between overall cost and number of virtual
desktops it can run in a production VMware View environment.
Under-powered servers may not be able to run enough virtual desktops per ESX host to provide
satisfactory ROI. Conversely, choosing a server with too many processor cores and too much memory
density may allow more virtual desktops per ESX host, but the cost of the additional CPU and RAM can
outweigh the benefit of the additional desktops. This will also have a negative impact on ROI for the
VMware View project.
• Number of ESX host machines to manage: Cost per virtual machine should also be balanced with
the number of ESX host machines that are required to support the virtual desktop environment. Very
large VMware View deployments may favor servers with more processor and memory to allow more
desktops per ESX host and hence less ESX host machines to manage. For example, the building block
presented here scales in increments of 64 virtual desktops per ESX host. A 2000-user VMware View
deployment would require at least 32 ESX host machines.
• PCI slots: Ensure the server has enough PCI slots for network and storage connectivity for high
availability and resiliency.
Technical White Paper 14VMware Inc. Virtual Desktop Infrastructure
• VMotion compatibility: Ensure all servers in the VMware View cluster have compatible processors for
VMware vMotion, especially if the VMware View servers will be part of an existing ESX cluster. Check
the VMware vMotion compatibility guide for the latest information:
http://www.vmware.com/resources/techresources/1022
Our building block uses the Dell PowerEdge 2950 with dual quad-core processors (Intel Xeon 2.67GHZ)
and 32GB RAM. This configuration provides a nice balance of overall server hardware cost with enough
compute power to support 64 virtual desktops running our target worker profile and sufficient headroom
to support future growth.
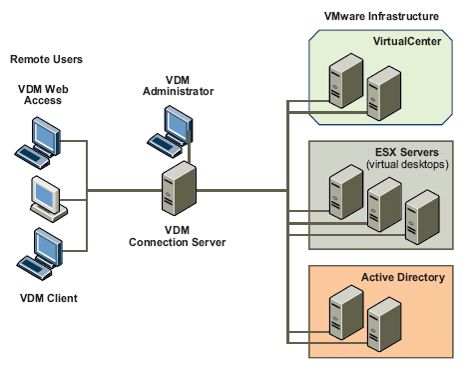
VMware View Manager and Clients (Layer 4)
The final layer in this solution is VMware View Manager. Administrators run an enterprise desktop
management server that connects remote clients to centralized desktops and manages virtual desktop
environments. VMware View Manager is an enterprise-class desktop management server that securely
connects users to virtual desktops in the data center and provides an easy to use web-based interface to
manage VMware View environments.
VMware View Manager 3 requires a dedicated physical or virtual server with following specifications for
running View Manager 3:
• A minimum of a Pentium IV 2.0Ghz processor. VMware recommends dual processors.
• A minimum of 2GB RAM. VMware recommends 3GB RAM for deployments of 50 or more desktops.
• A minimum of one 10/100Mbps NIC. VMware recommends a 1Gbps NIC.
VMware View Manager Connection Server can be installed on either 32•bit or 64•bit hardware. For high
availability deployments, eachView Manager Connection Server host requires a dedicated physical or
virtual server with similar specifications.
VMware View Manager uses existing AD infrastructure for authentication and user management.View
Manager integrates with VMware vCenter to manage virtual desktops running on VMware ESX hosts.
VMware View Manager has the following main components:
• VMware View Manager Client – User-facing component that connects toView Manager Connection
Server to connect to virtual desktops. It is a feature-rich, native windows application.
• VMware View Manager Web Access – User-facing component that connects toView Manager 3
Connection Server to connect to virtual desktops.View Manager Web Access installs the client (on a
Windows client) the first time you connect and connects to virtual desktops using a Web browser.
• VMware View Manager Administrator – Web application that is the primary mechanism for
configuringView Manager and managing users and desktops.
• VMware View Manager Connection Server – Software that acts as a connection broker and provides
management and user authentication for virtual desktops. TheView Manager Connection Server
directs incoming remote desktop user requests to the appropriate virtual desktop and enhances the
user experience.
• VMware View Manager Agent – Software that installs on desktop virtual machines and enables
features such as RDP connection monitoring, remote USB support, and single sign on. All guests
(desktop virtual machines) require the agent to be installed to runView Manager.
Technical White Paper 15VMware Inc. Virtual Desktop Infrastructure
Figure 4. High-Level View of aView Manager Environment
Virtual Desktop Configuration
Each virtual desktop was built with the following configuration:
• 1 Virtual CPU
• 512 Mbytes Memory
• 10 GB Disk Space (C drive > operating system and applications)
• Microsoft Windows XP SP2
• VMware View Manager Agent
• Microsoft Office 2003
Technical White Paper 16VMware Inc. Virtual Desktop Infrastructure
Other Considerations
In this section, we present some other areas to consider when planning your VMware View environment:
• VMware vMotion/HA/DRS: Advanced features of the VMware Infrastructure platform bring
enterprise-level flexibility and availability to the desktop environment. Ensure these features are
included in the design phase of the VMware View server and storage environment:
- VMware vMotion: Migrates live, running virtual machines from one physical server to another
with no loss of service.
- VMware Distributed Resource Scheduler (DRS): Dynamically load balances all of the VMware
virtual machines in the environment across the entire pool of server resources.
- VMware High Availability (HA): Automatically restarts all virtual machines on another ESX host in
the event of server hardware failure.
• Optimizing the Guest OS Build: Once virtualized, a desktop operating system no longer requires
many of the drivers, services and other add-ons typical of a physical desktop. Removing these can
optimize performance of the Guest OS, reduce storage requirements and improve overall performance.
Tools such as nLite and vLite (http://www.nliteos.com/) can be used to optimize the Guest OS.
• Optimize ESX host performance: Examples include disabling graphical screen savers, disconnecting
unused or unnecessary USB, COM, CD, floppy etc., on both the ESX host and guest operating system.
For information on ESX performance tuning and optimization, please see:
http://www.vmware.com/pdf/vi_performance_tuning.pdf
Deploying the First Building Block
Deploying the first building block should ideally be done as a proof-of-concept with a group of pilot end-
users. This provides the opportunity to do baseline performance measurements on the system to ensure
sizing estimates are in line with actual usage in production.
Scaling the Solution
As additional building blocks are deployed into the VMware View environment, the following design
criteria should be considered:
• VMware configuration maximums: Always check the latest configuration maximums, particularly in
large VMware View deployments. The latest information can be found at:
http://www.vmware.com/pdf/vi3_35/esx_3/r35/vi3_35_25_config_max.pdf
• ESX host cluster design: A decision will need to be made on whether the ESX host machines running
the virtual desktop environment will form their own ESX cluster, or whether they will be part of an
existing ESX cluster containing other server workloads. At the time of this writing, current ESX clusters
support a maximum of 32 ESX hosts and up to 2,000 virtual machines.
• VirtualCenter instances: Consider whether the virtual desktops will be managed by their own
dedicated VMware vCenter instance or be managed by an existing VMware vCenter instance that may
already be managing other non-VMware View systems. A single VMware vCenter instance currently
support a maximum of 2,000 virtual machines, so larger environments will need to consider multiple
VMware vCenter Instances.
• Monitoring performance: Ongoing performance monitoring of the VMware View environment can
be used to maintain proper performance levels and identify potential performance bottlenecks.
Monitoring ESX host performance can be done through VMware vCenter or by using the esxtop
command line utility. Areas to watch for include ESX host CPU (% Processor time), memory (Free
Mbytes, page sharing, swapping), network (Bytes transferred) and disk (reads/sec, writes/sec,
Technical White Paper 17VMware Inc. Virtual Desktop Infrastructure
throughput). Additionally, performance of the EqualLogic storage arrays can be done using the PS
Series Monitor program. This tool can provide further analysis on performance of the storage array.
Conclusion
Organizations today must support a wide variety of users: Local, mobile, and remote. Those users normally
access sensitive information assets on a range of equipment, including desktop, laptops and unmanaged
personal computers, making it difficult to support end users in a consistent and secure manner. VMware
View addresses the desktop management challenges by tightening the control of corporate assets and
simplifying desktop management. This approach extends powerful VMware Infrastructure 3 capabilities,
such as business continuity and disaster recovery, to the desktop; streamlines desktop management to
reduce operations costs and increase control; and delivers complete desktop environments with greater
application compatibility.
Combining the benefits of VMware virtualization, the cost-effective, reliable Dell EqualLogic PS5000XV
storage subsystem and 64-bit Dell PowerEdge 2950 servers provide a very robust platform for desktop
virtualization. The “building block” solution is designed to optimally support desktop environments in
multiples of 64 and can easily scale as environment and business needs grow.
Technical White Paper 18VMware Inc. Virtual Desktop Infrastructure
Appendix A: Performance Data
Extensive performance testing was done using VMware View Performance test program along with
VMware vCenter, esxtop, and the EqualLogic PS Series Performance Monitor program. The VMware View
performance test program is used to simulate a light-to-average user workload on a typical desktop
environment. The following should be monitored during the POC phase to ensure proper sizing and
performance:
1. Processor utilization: Testing with 64 virtual desktops showed CPU utilization on the ESX host
averaging approximately 50% with spikes as high as 90%. It should be noted that our testing did not
include CPU overhead on the ESX host created by the remote display protocol, so actual CPU
utilization in production environments may be slightly higher than what was observed in our testing.
Figure 5. CPU utilization on ESX host running 64 virtual desktops (measured using esxtop)
In our testing, we compared CPU utilization when using both the VMware software iSCSI initiator as
well as a Q-Logic hardware iSCSI initiator. Due to the relatively light disk I/O in the VMware View
workload, only a 5-7% reduction in CPU overhead was observed when using the hardware initiator.
2. Disk I/O per second (IOPS) and throughput (KB/s): To measure disk performance requirements, we
used the EqualLogic PS Series Performance Monitor tool. When running 64 virtual desktops against the
EqualLogic PS-5000X array, we observed the following performance metrics (see Figure 6).
Technical White Paper 19VMware Inc. Virtual Desktop Infrastructure
Figure 6. Storage IOPS and throughput measured on the EqualLogic PS5000XV
Actual IOPS during testing saw averages of approximately 185 with peaks at 650. Throughput average
was approximately 3530 KB/s with peaks at 13733 KB/s. In the earlier section on storage sizing, we
estimated our IOPS requirement at 320 IOPS and the estimated throughput requirement was 7360
KB/s. The VMware View disk I/O workload is very “bursty” which makes exact sizing very difficult. Using
average values as described in the previous sections is a good starting point. One of the benefits of
the EqualLogic PS Series array is that VMFS Datastore volumes are virtualized, that is, striped across all
disk drives in the array, thus distributing the aggregate virtual desktop workloads across all storage
resources. Additional performance capacity can be added simply by expanding the SAN with an
additional storage array (seamlessly added to the EqualLogic Group). The PS Series will automatically
re-distribute the data volume and disk I/O across the additional controller, network ports, memory
cache and disk spindles.
Technical White Paper 20VMware Inc. Virtual Desktop Infrastructure
3. ESX host memory observations: Each of the 64 virtual desktops was configured with 512MB RAM and
the ESX host machines were configured with 32GB of total physical RAM. Actual memory requirements
will vary in production due to the ESX memory page sharing feature. As shown in the graph below,
actual memory usage on the ESX host averaged approximately 19GB:
Figure 7. ESX memory utilization measured by esxtop when running
64 virtual desktops on a single Dell PowerEdge 2950 with 32GB RAM
With memory page sharing, the ESX host machine was able to reclaim approximately 13GB of memory
over the course of a 4-hour test run. The graph shows actual memory consumption and page sharing
increasing and decreasing slightly during the test run as virtual desktops open and close common
applications. As the test progresses, there are more common pages found in memory for all the virtual
machines. This shows efficiency in the memory being used.
Note: Based on these results, there is still headroom on the ESX host to either support additional
virtual desktops or perhaps allocate additional memory to virtual machines that require more than the
512MB initially allocated. It is also possible to provision memory to the virtual machines beyond the
amount of physical memory on the ESX host itself. This process is known as memory over-commit and
can allow even higher desktop consolidation ratios. If you plan to over-commit memory on the ESX
host, monitor performance to ensure the ESX host is not swapping.
4. In-guest response time: The workload used for testing also allows measurement of the response
times for each operation within the virtual desktops. This can be used as an indicator of end-user
experience. Using these measurements, we can scale up the number of virtual desktops per ESX host
and ensure user response times remain acceptable. Sample performance metrics when running
multiple building blocks of 64 virtual desktops each on our test systems resulted in the following
measurements (see Figure 8).
Technical White Paper 21VMware Inc. Virtual Desktop Infrastructure
Figure 8. Response times measured inside the virtual desktops for common functions.
The graphs show response time for various Microsoft Word and Adobe Acrobat operations as we scale
up to 64 desktops on a single ESX host, and then scale out to two and three ESX host machines, each
running 64 desktops. Response times increase slightly on the first building block as the number of
virtual machines increases to 64, but overall repsonse times remain accpetable. The data points at 128
and 192 virtual machines indicate linear scalability as additional building blocks are added to the
environment.
Technical White Paper 22VMware Inc. Virtual Desktop Infrastructure
Appendix B: Hardware and Software Resources
Building Block Host Server Hardware:
Quantity Description
1 Dell PowerEdge 2950 – dual quad-core Xeon @ 2.67 GHz, 32GB RAM
1 ESX 3.5
Storage Hardware:
Quantity Description
1 EqualLogic PS-series 5000XV
VirtualCenter Server andView Manager 3 Server:
# of Servers Server Make/Model
1 Physical or virtual servers according to VMware supported configurations:
http://www.vmware.com/support/pubs/vi_pubs.html
http://www.vmware.com/support/pubs/vdi_pubs.html
Technical White Paper 23You can also read