Draft Animals, Farm Machines and Sustainable Agricultural Production: Insight from China - MDPI
←
→
Page content transcription
If your browser does not render page correctly, please read the page content below
sustainability

Article
Draft Animals, Farm Machines and Sustainable
Agricultural Production: Insight from China
Xiaoshi Zhou 1      ID
                         , Wanglin Ma 2    ID
                                                and Gucheng Li 1, *
 1    College of Economics & Management, Huazhong Agricultural University, Wuhan 430070, China;
      Xiaoshi.Zhou@outlook.com
 2    Department of Global Value Chains and Trade, Faculty of Agribusiness and Commerce, Lincoln University,
      Lincoln 7647, Christchurch, New Zealand; Wanglin.Ma@lincoln.ac.nz
 *    Correspondence: lgcabc@mail.hzau.edu.cn; Tel.: +86-027-87286896

 Received: 19 July 2018; Accepted: 22 August 2018; Published: 24 August 2018

 Abstract: Although draft animals have been playing an essential role in agricultural production
 worldwide, in recent decades there has been a trend towards replacing draft animals with farm
 machines. In the areas facing labour shortage due to rural-to-urban migration, the use of farm
 machines is especially expected to enhance agricultural production and productivity. However,
 little is known about the extent to which the farm machine use substitutes draft animal use and
 how the two production activities jointly affect agricultural performance. To fill this gap, this paper
 attempts to examine the long-run and short-run effects of farm machine use on draft animal use
 using a pooled mean group estimator, and to estimate the joint effects of farm machine use and draft
 animal use on agricultural productivity using a panel production function model. The empirical
 results show that a 1% increase in farm machine use rate tends to decrease draft animal use by
 2.82% in the long-run, but it does not have a statistically significant impact on draft animal use in
 the short-run. In addition, we find that output elasticity of farm machine use has increased from
 −0.161 in 1978 to 0.170 in 2012, while that of draft animal use has decreased from 0.185 to −0.129 over
 the same time period. Our findings highlight the importance of government’s efforts in promoting
 an agricultural transition from animal power to machine power in order to increase sustainable
 agricultural production.

 Keywords: draft animals; farm machines; agricultural productivity; pooled mean group (PMG);
 panel production function

1. Introduction
     Traditionally, draft animals have played an essential role in agricultural production in many
developing and transition countries. Kienzle et al. [1] estimated that around 55% of the smallholder
farmers in Swaziland still rely on draft animal power for land cultivation, and more than 88% of
draft animals found on the Swazi National Land are cattle. Animal power is generally affordable
and accessible to the smallholder farmers. The availability of animal power enables rural laborers to
increase production efficiency and productivity. Available evidence has revealed that relative to maize
farmers who used hand hoes in Kenya, those who used draft animal power obtained higher yields
and operated at a higher economic efficiency [2].
     However, with the emergence and development of farm machines, the role of draft animals
in agricultural production has been gradually replaced by farm machines. A number of possible
reasons for this trend have been identified. Mrema et al. [3] summarized five reasons that explain
the shift from animal power to machine power in agricultural production, including (a) expansion of
the area under cultivation; (b) facilitation of timely farm operations to increase productivity; (c) the

Sustainability 2018, 10, 3015; doi:10.3390/su10093015                     www.mdpi.com/journal/sustainability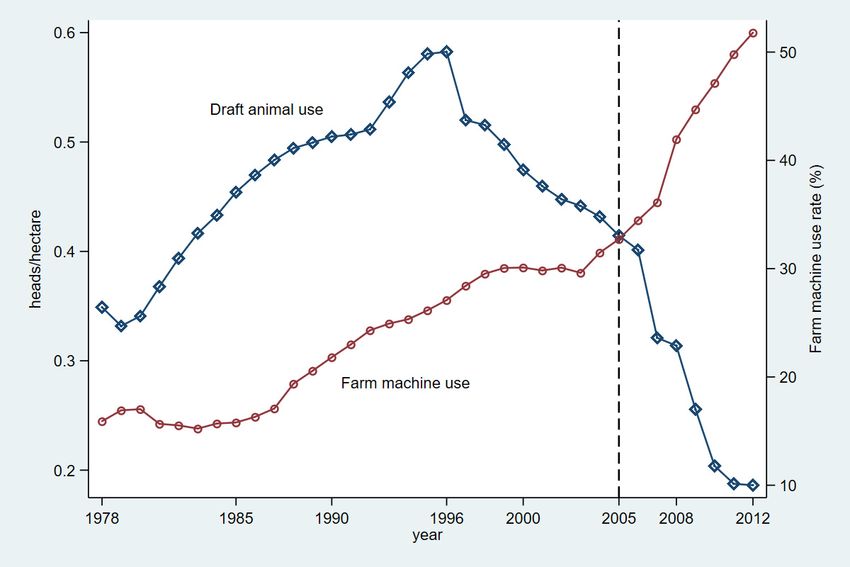
Sustainability 2018, 10, 3015                                                                     2 of 16

multi-functional use of mechanization; (d) overcoming seasonal labor shortages; and (e) reduction
of the drudgery associated with the use of human muscle power for tasks such as hand hoeing for
primary tillage. Some empirical studies have demonstrated that farm machines can not only help
address labour shortage issues (due to, primarily rural-to-urban migration for seeking higher salary
opportunities) facing farm households, but also save farmers’ time used for farm activities and allow
them to reallocate additional time to off-farm activities [1,4–7]. Ahmed and Goodwin [4] showed that
adoption of labour-saving technologies such as tractors and power tillers increases the probability of
participation in the rural off-farm sector in Bangladesh. A study on China by Wang et al. [5] also found
that there exists a substitution effect between rural labour and machines through estimating frontier
production function.
      In addition to the substituive effects of farm machines on rural labour usage and re-allocation,
farm machine use appears to have a positive impact on agricultural production. Several studies
have shown that farm machine use increases agricultural productivity [8–12]. Rahman et al. [11]
revealed that the yield of wheat under mechanization (2.65 ton/ha) is higher than that of traditional
farms (2.57 ton/ha) in northern Bangladesh. Ma et al. [9] found that farm machine use has a positive
and statistically significant impact on maize yields in China. In their analysis on Ghana, Benin [12]
showed a positive relationship between the use of mechanization services by farming households and
farm yields. Farm machine use can not only facilitate the intensification of agricultural production
through quicker turnaround time, timely use of water, better plant protection, and more efficient
harvesting, but also reduce drudgery. In their investigation of sub-Saharan African smallholders,
Sims et al. [7] also showed that the use of farm machines enables smallholders to increase farm yields
through the adoption of intensification, conservation agriculture, and other climate-resilient, labour-
and energy-efficient, and gender-friendly practices.
      Although the use of farm machines has become increasingly important and dominant for effective
and efficient farm operations, farm machine use may have different impacts on draft animal use in
different production stages such as ploughing, sowing and harvesting due to differences in terms
of farm machine availability, production conditions, and requirements of power intensity [9,13].
Understanding the substitutive effects of farm machine use in different production stages on draft
animal use would provide important implications for public policy efforts to promote farm machine
use and enhance sustainable agricultural production in the long-run. However, there is currently
a lack of knowledge about the extent to which the farm machine use substitutes draft animal use.
Moreover, most of the studies mentioned previously have either analysed the association between
draft animal use and agricultural production [2,14], or the impact of farm machine use on agricultural
productivity [5,9,12,15]. The estimates may be biased if households are jointly making decisions
to use draft animals and to use farm machines in their efforts to enhance agricultural production.
However, very few have considered the joint effects of draft animal use and farm machine use on
agricultural productivity.
      The primary objective of this study is, therefore, to analyse the interactive relationship between
draft animal use, farm machine use, and agricultural productivity, using data collected by the National
Bureau of Statistics of China from 28 provinces of China for the period 1978–2012. We attempt to
contribute to the literature in two ways. First, we provide a first attempt to analyse the impact
of farm machine use on draft animal use, with a particular focus on different production stages
including ploughing, sowing and harvesting. In doing so, we shed light on the long-run and short-run
relationship between farm machine use and draft animal use by employing a pooled mean group (PMG)
estimator. Previous studies have only focused on the qualitative analysis or evaluated the average
effect of farm machine use on draft animal use [16], but have not distinguished the short-run and
long-run relationship between farm machine use and draft animal use. For the purpose of comparisons,
we also present the results estimated from fixed effects (FE) and first difference approaches. Second,
we analyse the joint effects of draft animal use and farm machine use on agricultural productivity,
by using a panel production function model with fixed effects.
Sustainability 2018, 10, 3015                                                                     3 of 16

     The rest of the paper is structured as follows. Section 2 presents the background information
regarding the agricultural production transition from draft animal use to farm machine use. Section 3
presents the data and descriptive statistics. The empirical models are presented in Section 4, and the
empirical results are discussed in Section 5. Section 6 concludes with policy implications.

2. The Agricultural Production Transition from Draft Animal Use to Farm Machine Use
      In many developing countries, draft animals have been identified a significant tool in providing
farmers with farm power to facilitate agricultural production. Draft animals are usually considered
the most critical and costly piece of capital in pre-mechanized agriculture [17]. In some hilly and
mountainous regions where farm machinery services and the development of farm machines that
match the local production conditions have lagged, agricultural production relies heavily on draft
animal power. Moreover, the draft animal also provides a possibility for farmers to use farmyard
manure or compost to replenish or maintain soil nutrients. A study on China showed that the
production elasticity of farm manure is 0.17 on average, highlighting the importance of farmyard
manure in enhancing agricultural productivity [18].
      Despite the significant role draft animals play in agricultural production, the development of
advanced technologies such as farm machines gradually shows a more critical role in agricultural
production areas facing labour shortages due to rural-to-urban migration [5,9,19,20]. Farm machines
can facilitate increased output of higher value products while eliminating the drudgery associated
with human and/or animal muscle-powered agricultural production. In rural regions, men usually
migrate in search of higher incomes while women are left in charge of household farm production.
It is reported that women contribute to 60–80% of the labour for food production in sub-Saharan
Africa, while farm machines can provide women in rural areas with opportunities to adapt to
cultural, social and traditional work norms, and to the overall development of local economies [7].
In China, the real wage of labour has been rapidly growing with a double-digit annual increase since
2003, which induces the substitution of farm labour and animal power by machinery power [21].
In the past two decades, China has witnessed an increase in agricultural mechanisation and a decrease
in draft animal use. Due to the introduction of subsidy for purchasing agricultural machinery and the
release of the Agricultural Mechanization Promotion Law of the People’s Republic of China in 2004,
the mechanisation level of agricultural production increased by 19% from 2005 to 2012 in China, while
the number of draft animals decreased by 57% during the same time period. Nevertheless, animal
power use is still inevitable in China due to hilly and mountainous characteristics of farmland in some
regions. It is estimated that more than 30 million head of draft animals were being used in agricultural
production in China by the end of 2012.

3. Data and Descriptive Statistics

3.1. Data Source
      The data used in the present study are mainly from China’s Rural Statistics Yearbooks (1978–2013),
China Yearbook of Rural Household Survey (1980–2013) and China’s Education Statistical Yearbook
(1988–2013), which are all collected by National Bureau of Statistics of China. In the present study,
we focus on our analyses using the panel data of 28 provinces (Anhui, Beijing, Shanghai, Tianjin,
Yunnan, Inner Mongolia, Sichuan, Ningxia, Shandong, Shanxi, Guangdong, Guangxi, Xinjiang, Jiangsu,
Jiangxi, Hebei, Henan, Zhejiang, Hubei, Hunan, Gansu, Fujian, Guizhou, Shaanxi, Qinghai, Liaoning,
Jilin and Heilongjiang) for the period of 1978–2012 due primarily to two reasons. First, the data on
draft animal use were not collected after 2012 by the National Bureau of Statistics of China, but our
primary objective in this study is to investigate the interactive relationship between draft animal use,
farm machine use, and agricultural productivity. Second, we focus only on the analysis of 28 provinces,
because the other parts of China (e.g., Tibet, Chongqing and Hainan province) had data missing and
administrative division issues during the period of 1978–2012.
Sustainability 2018, 10, 3015 4 of 16
The variables used in the present study are mainly selected from the National Bureau of Statistics
of China. In particular, the draft animal use variable refers to the total number of animals recorded
at the end of each survey year. The information on draft animals including horses, donkeys, farm
cattle, buffaloes, calves and camels are purposively collected by National Bureau of Statistics of
China during the surveys, because those animals can provide power for farm operations such as
ploughing, transportation, and milling. Farm machine use is a variable that is measured by the
accumulated farm machine use rate in three crucial production stages including ploughing, sowing
and harvesting. Although some previous studies have used total machine power in their efforts to
analyse the impact of farm machine use on farm performance [22,23], it is worth mentioning here that
the total machine power does not capture the information of farm machines used through purchased
services, which can only capture the partial effects of farm machine use. As highlighted by Ji et al. [6]
and Wang et al. [5], purchasing machinery and/or buying machinery services are two primary means
for smallholder farmers to get access to farm machines during agricultural production in China. Thus,
it is more reasonable to employ farm machine use rate rather than total machine power. Agricultural
productivity refers to the gross value obtained from agricultural production, which is measured at a
per hectare base. The variables including labour, fertilizer, transportation, off-farm income, education,
ploughing, sowing and harvesting are also selected in consideration of data availability and included
in the analysis.
3.2. Descriptive Statistics
The definition and descriptive statistics of the variables are presented in Table 1. It can be
observed from Table 1 that every province used about 0.45 head of draft animals per hectare of land.
The farm machine use rate on cultivated land is 27.2% on average. The agricultural productivity is
4623 Yuan/hectare on average. The average number of labourers engaged in agricultural production is
about 2 persons per hectare, and the fertiliser used for agricultural production is around 225 kg/hectare.
The average rural residents have 6.87 years of schooling. With respect to the mechanisation rate in
different production stages, the results presented in Table 1 show that the mean use rate of farm
machines for ploughing in agricultural production is 40.1%, whereas the mean use rates for sowing
and harvesting are 23.4% and 14.4%, respectively.
Table 1. Definition and descriptive statistics of variables.
Variables Definition Mean S.D.
Draft animal use Draft animal use per hectare (head) 0.448 0.312
Farm machine use The farm machine use rate 0.272 0.202
Agricultural productivity Gross agricultural production value per hectare (Yuan) a 4622.578 4815.123
Labour Labour input per hectare (person) 1.987 0.724
Fertiliser Fertiliser input (kg/hectare) 224.553 121.782
Transportation The road length per square kilometre (km/km2 ) 0.360 0.337
The proportion of off-farm income to rural households’
Off-farm income 0.323 0.175
total income per capita
Education The average schooling year of rural people (year) 6.868 1.503
Ploughing The rate of land ploughed by machines 0.401 0.243
Sowing The rate of land sowed by machines 0.234 0.254
Harvesting The rate of land harvested by machines 0.144 0.245
aYuan is the Chinese currency, with 1 USD = 6.78 Yuan in 2018; the original value of agricultural productivity was
deflated to a base year of 1978 using the agricultural gross values index released by the National Bureau of Statistics
of China.
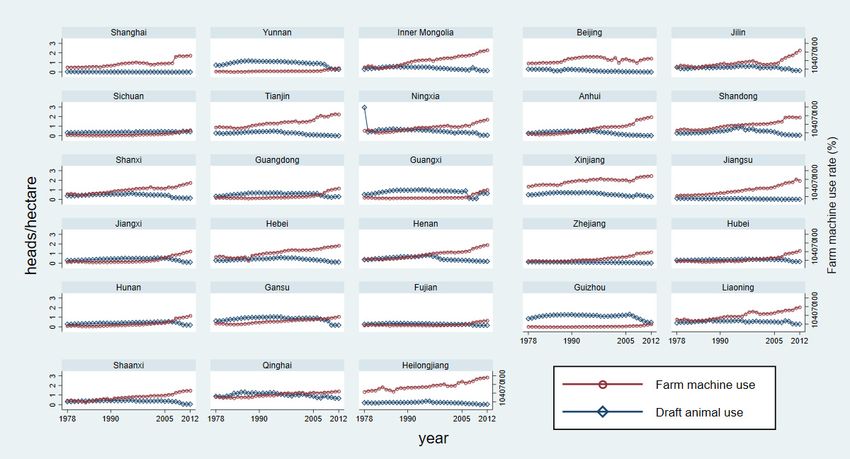
Figure 1 demonstrates the negative relationship between draft animal use and farm machine
use rate from 1978 to 2012 at the national level. The information illustrated in Figure 1 shows that
the number of draft animal used was increasing before 1996, then experienced a sharp decrease.
The reason for the sharp decline in draft animal use between 1996 and 1997 is potential because
the National Bureau of Statistics of China made official adjustment to the data based on the second
agricultural census results in 1997. In particular, the number of draft animals used per hectare ofSustainability 2018, 10, 3015 5 of 16
land has decreased from 0.58 head in 1996 to 0.19 head in 2012. In comparison, farm machine use
was dramatically
Sustainability increasing
2018, 10, x FOR PEERover time. The use rate of farm machines in 1978 was 15.91% and
REVIEW 5 of then
16
increased to 51.80% in 2012, an increase of approximately 225.58%. The dramatic increase of farm
increased
machine useto 51.80%
is not in 2012,because
surprising, an increase
overoftime
approximately 225.58%.
more and more rural The dramaticbecome
households increase of farm
aware of the
machine use is not surprising, because over time more and more rural households become aware of
benefits associated with farm machines, and also because farm machines and machinery services have
the benefits associated with farm machines, and also because farm machines and machinery services
become gradually available on the markets in rural regions. In their survey for 453 rural households in
have become gradually available on the markets in rural regions. In their survey for 453 rural
Anhui province of China, Ji et al. [6] showed that more than half of the surveyed households (54.5%)
households in Anhui province of China, Ji et al. [6] showed that more than half of the surveyed
possessed certain kinds of farm machines such as small tractors for towing and ploughing, seeders
households (54.5%) possessed certain kinds of farm machines such as small tractors for towing and
and/or transport equipment.
ploughing, seeders and/or transport equipment.
Figure 1. The changes of draft animal use and farm machine use rate from 1978 to 2012.
Figure 1. The changes of draft animal use and farm machine use rate from 1978 to 2012.
To facilitate our understanding regarding the relationship between draft animal use and farm
To facilitate
machine use, weour understanding
plotted the changesregarding the relationship
in draft animals between
and farm machine usedraft
rate animal use and
at provincial farm
levels
and presented
machine use, wethe results
plotted inchanges
the Figure 2.in The Figure
draft 2 shows
animals andthat
farmthere is a noticeable
machine use rate decrease
at provincialin terms
levels
andof presented
draft animal
theuse, and in
results a dramatic
Figure 2.increase
The Figure in farm machine
2 shows that use rate
there is at provincial decrease
a noticeable levels, which is
in terms
of largely consistent
draft animal use, with
and athe observation
dramatic in Figure
increase in farm 1. To exploreuse
machine whether
rate atthe significant
provincial changes
levels, which of is
farm machine
largely consistentusewith
and the
draftobservation
animal use is indue to the
Figure 1. changes of farm
To explore size, we
whether theplotted the changes
significant changes of of
the growth rate of land from 1978 to 2012 and presented the results in Figure
farm machine use and draft animal use is due to the changes of farm size, we plotted the changes A1 in Appendix A. This
of shows that the
the growth rate
rate ofof landfrom
land used1978
for crop
to 2012cultivation has no big
and presented thefluctuation,
results in suggesting
Figure A1 in that land size A.
Appendix
change is not a main factor contributing to the changes of draft animal use and farm machine use
This shows that the rate of land used for crop cultivation has no big fluctuation, suggesting that land
over time.
size change is not a main factor contributing to the changes of draft animal use and farm machine use
In addition, Figure 2 also shows that the magnitudes of the substitutive relationship between
over time.
draft animal use and farm machine use vary across different provinces. This is not surprising, because
In addition, Figure 2 also shows that the magnitudes of the substitutive relationship between
there exist obvious differences in terms of institutional environments, social-economic conditions,
draft animal use and farm machine use vary across different provinces. This is not surprising, because
and geographical characteristics among those provinces. For example, Heilongjiang, Jilin and
there exist obvious
Liaoning differences
are located in terms
the plain regions of institutional
endowed with environments, social-economic
favorable production conditions,
conditions, the
and geographical characteristics among those provinces. For example, Heilongjiang,
mechanization level of agricultural production is relatively higher than other provinces. Jilin and Liaoning
In
arecomparison,
located the Guizhou
plain regions endowed
and Yunan are with
locatedfavorable production
in mountainous andconditions,
hilly areas, the mechanization
in which level
it is difficult
of to
agricultural
apply farmproduction
machines in is relatively production
agricultural higher than other provinces. In comparison, Guizhou and
practices.Sustainability 2018, 10, 3015 6 of 16
Yunan are located in mountainous and hilly areas, in which it is difficult to apply farm machines in
agricultural production practices.
Sustainability 2018, 10, x FOR PEER REVIEW 6 of 16
Figure 2. The changes of draft animal use and farm machine use rate at the provincial levels from
Figure 2. The changes of draft animal use and farm machine use rate at the provincial levels from 1978
1978 to 2012.
to 2012.
Overall, the results presented in Figures 1 and 2 tend to suggest that farm machine use plays an
Overall,
increasing roletheinresults presented
agricultural in Figures
production, 1 and
but 2 tend
the role of to suggest
draft animalthat
usefarm machine useHowever,
is diminishing. plays an
increasing role in agricultural production, but the role of draft animal use is diminishing.
the questions as to what extent that farm machine use affects draft animal use in rural China and howHowever,
the questions
draft animal useas toand
what extent
farm that farm
machine machine
use jointly use affects
determine draft animal
agricultural use in rural
productivity haveChina and
not been
how draft animal use and farm machine use jointly determine agricultural
answered. The present study attempts to find answers to these questions. productivity have not been
answered. The present study attempts to find answers to these questions.
4. Empirical Models
4. Empirical Models
4.1. Pooled Mean Group (PMG) Model
4.1. Pooled Mean Group (PMG) Model
The first objective of this study is to analyze the impact of farm machine use on draft animal use,
The first objective of this study is to analyze the impact of farm machine use on draft animal
using a PMG model. Compared with other methods such as the fixed effects model and first
use, using a PMG model. Compared with other methods such as the fixed effects model and first
difference model, which only capture the static long-run effects of farm machine use on draft animal
difference model, which only capture the static long-run effects of farm machine use on draft animal
use, the pooled mean group model has the ability to explore both long-run and short-run effects of
use, the pooled mean group model has the ability to explore both long-run and short-run effects of
farm machine use. To begin with, we express the autoregressive distributive lag (ARDL) dynamic
farm machine use. To begin with, we express the autoregressive distributive lag (ARDL) dynamic
panel specification for separating the long-run and short-run effects as follows:
panel specification for separating the long-run and short-run effects as follows:
∆ , = +∑ , , +∑ , , +∑ , , + + , (1)
p q q
where , ∆DA
is the = α0 + of
i,t number ∑ draft
λi,j DAanimals ∑ βi,jper
i,t− j + used i,t− j + ∑
MEhectare, withγi,j Xi,t − j + µi +toε i,tthe number(1)
referring of
provinces included in the analysis j=1 and referring j=0 to the year;j =∆0 , is the first order difference
of , ; , refers to the lag term of draft animal use with -th order lag; , is the farm
where DA i,t is the number of draft animals used per hectare, with i referring to the number of provinces
machine use rate with -th order lag; is a -th order lag vector of control
included in the analysis and t referring to, the year; ∆DAi,t is the first order difference of DAi,t ; DA variables that include
i,t− j
labour
refers to use,
the lagfertiliser
term ofuse, drafttransportation,
animal use with off-farm income,
j-th order lag; ME and education; is the time-invariant
i,t− j is the farm machine use rate with
fixed-effects
j-th order lag; for Xi,t−the province ; is a constant term; , , , and , are parameters to be
j is a j-th order lag vector of control variables that include labour use, fertiliser use,
estimated; , off-farm
transportation, is the idiosyncratic,
income, andtime- and state-varying
education; error term. After
µi is the time-invariant including
fixed-effects for athe one lag order
province i;
term for draft animal use variable to both sides of Equation (1), Equation (1) can be
α0 is a constant term; λi,j , β i,j and γi,j are parameters to be estimated; ε i,t is the idiosyncratic, time- andre-parameterized
into an error-correction model as follows:
∗ ∗
∆ , = , − , − , +∑ , ∆ , +∑ , ∆ , +
∗ (2)
∑ ∆ , + + ,
where the coefficient is the error-correcting speed of adjustment term, which reveals how strongly
the dependent variable reacts to the deviation from the long-term level. If = 0, this would suggestSustainability 2018, 10, 3015 7 of 16
state-varying error term. After including a one lag order term for draft animal use variable to both
sides of Equation (1), Equation (1) can be re-parameterized into an error-correction model as follows:
p −1
∗ ∆DA q −1 ∗
∆DAi,t = ϕi ( DAi,t−1 − θi MEi,t−1 − τi Xi,t ) + ∑ j = 1 λi,j i,t− j + ∑ j = 1 β i,j ∆MEi,t− j +
p −1 (2)
∑ j = 1 γij∗ ∆Xi,t− j + µi + ε i,t
where the coefficient ϕi is the error-correcting speed of adjustment term, which reveals how strongly the
dependent variable reacts to the deviation from the long-term level. If ϕi = 0, this would suggest that
farm machine use and other control variables have no long-run effects on draft animal use. The PMG
estimator allows us to estimate the homogenous effects of farm machine use on draft animal use in the
long-run, and to estimate the heterogeneous effects across different provinces in the short-run [24,25].
In particular, the parameter vectors, θi and τi , capture the long-run effects of farm machine use and
other control variables on draft animal use, respectively. The short-run effects of farm machine use and
other control variables on draft animal use are captured by the parameters β∗i,j and γi,j ∗ , respectively.
The PMG approach has been applied in previous studies. For example, using the PMG approach,
Kangasniemi et al. [26] analysed the relationship between migration and productivity for Spain and
the UK, and Bachewe and Headey [27] investigated how food price affects wage increase in Ethiopia.
The direct estimation of Equation (2) would be problematic if the draft animal use and farm
machine use are non-stationary. For a stationary ε i,t , it must be the case that the variables are integrated
in one order, denoted by I(1). We formally test the non-stationarity of draft animal use, farm machine
use and other covariate variables, using the unit root (IPS) test proposed by Im, Pesaran and Shin [28].
The IPS test is a very popular first-generation panel unit root test, which has been used to test whether
the variables used for empirical analysis are non-stationary and possess a unit root. The IPS test
does not account for cross-sectional dependence, but allows for heterogeneity across panels. The null
hypothesis of the IPS test is that all panels contain a unit root. Rejection of the null hypothesis would
suggest that a non-zero fraction of the panels represents stationary processes.
To evaluate if the variables are cointegrated, we employ both the Westerlund test and the Pedroni
test [29,30]. The Westerlund test is designed to test whether the error correction in a conditional
error correction model is equal to zero, while in the Pedroni test the estimated slope coefficients are
permitted to vary across individual members of the panel. The null hypothesis of the two tests is the
same, and both of them assume that there is no cointegration. Failing to accept the null hypothesis
would suggest that draft animal use, farm machine use and other covariate variables are cointegrated
in all panels with a panel-specific cointegrating vector.
Another issue that needs to be accounted for is the potential endogeneity issue associated with
farm machine use, given the fact that farmers decide themselves on whether or not to use machines on
their farms [9]. Usually, the endogeneity issue can be addressed by using instrumental approaches
such as the two-stage least squares (2SLS) regression model. However, the endogeneity issues of
explanatory variables can be safely ignored in the present study, because the ARDL model can produce
consistent estimates as long as the lag order is appropriately selected [24]. The appropriate lag order
can be selected based on the Akaike information criterion (AIC) and the Bayesian information criterion
(BIC). After the pre-tests, we find that the first lag order is the most suitable lag length, which is thus
used in the present study. For the purposes of comparison, we also presented the results estimated
from the fixed effects and first difference models.
4.2. Production Function Model with Fixed Effects
The second objective of this study is to analyse the joint effects of farm machine use and draft
animal use on agricultural productivity, using a production function model with fixed effects. To begin
with, we consider that a production process uses n inputs to produce one output and express the
production function as follows:
Yit = f ( x1,it , · · · , · · · xn,it , T ) (3)Sustainability 2018, 10, 3015 8 of 16
where Yit refers to agricultural productivity per hectare of land for province i in year t, which is
measured by the gross value per hectare obtained from agricultural production. xn,it is the n-th input
used in the province i in year t. T is used to capture the technological progress (a linear time trend).
In empirical studies, both the Cobb–Douglas form and translog functional form have been used
to estimate the output elasticity of inputs [31,32]. In particular, the Cobb–Douglas form is mainly
used to measure and compute constant production elasticity, while the translog functional form is
used to represent the production function and track time-varying elasticity changes. To identify an
appropriate functional form for this study, both the Cobb–Douglas form and the translog functional
form are estimated in our preliminary tests. The results for a likelihood ratio test, AIC and BIC,
which are presented at the bottom of Table 3, show that the Cobb–Douglas form is not nested in the
translog functional form, suggesting the validity of using the translog functional form in the present
study. Therefore, the translog functional form is used to estimate the production function (3), which is
specified as follows:
ln(Yit ) = a0 + ai + α T t + ∑nj β j ln x j,it + 21 ∑nj ∑nk β j,k ln x j,it × ln( xk,it )+
(4)
∑nj β Tj ln( xit ) × t + β T t2 + υit
where ln(Yit ) represents the log-transformed agricultural productivity, with i refering to the number of
provinces and t referring to the year; ln x j,it or ln( xk,it ) refers to the log-transformed inputs including
labour, draft animal use, farm machine use and fertiliser; i or j is the i- or j-th number of input; t is a
time trend variable used to capture technological progress (1978 = 1 . . . . . . , 2012 = 35); ai refers to the
fixed effects varying among provinces; α0 , α T , α j , β j,k , β Tj and β T are parameters to be estimated.
Taking the first derivative of Equation (4) with respect to a specific input j, the output elasticity of
this input j can be calculated as follows:
n
∂ ln(Yit ) 1
Ex j = = α j + ∑ β jk × ln( xk,it ) + β Tj × t (5)
∂ ln x j,it k
2
where Ex j represents the output elasticity of input x j .
5. Empirical Results and Discussions
5.1. Results for Unit Root (IPS) Test and Cointergration Tests
Table A1 in Appendix A presents the results estimated from the IPS test. The results show that
the statistical values with and without inclusion of the time trend variable are statistically significant
at 1% level, suggesting that the null hypothesis of non-stationarity can be rejected and all the variables
used in our empirical models are integrated in the order of one I(1). Table A2 in Appendix A presents
the results of the cointeragretion tests for the draft animal use equation and production function
equation, relying mainly on the Westerlund test and Pedroni test. All the tested statistics including
the variance ratio, modified Philips–Perron test, Philips–Perron test, and Augmented Dickey–Fuller
test are statistically significant, suggesting that the null hypothesis of no cointegration can be rejected.
Overall, the results presented in Tables A1 and A2 confirm the validity and appropriateness of using a
pooled mean group model and panel production function model to conduct the empirical analyses in
the present study.
5.2. Impact of Farm Machine Use on Draft Animal Use
The results for the long-run and short-run effects of farm machine use on draft animal use, which
are estimated using the PMG model, are presented in Table 2. In particular, Model (1) presents the
results of the impact of aggregated farm machine use on draft animal use. For a better understanding,
we also estimated the impact of farm machine use in different production stages including ploughing,
sowing and harvesting on draft animal use in Model (2), Model (3) and Model (4), respectively.Sustainability 2018, 10, 3015 9 of 16
Our estimates show that the long-run coefficient of the farm machine use variable is negative
and statistically significant, suggesting that farm machine use does have a statistically significant and
negative impact on draft animal use. The findings suggest that in the long-run, a 1% increase in farm
machine use rate tends to decrease draft animal use by 2.82%. However, the short-run coefficient of the
farm machine use variable suggests that farm machine use does not affect draft animal use significantly
in the short-run. The results, which are presented in columns 3–5 of Table 2, show that farm machine
use rate at different production stages including ploughing, sowing and harvesting affects draft animal
use differently, suggesting the presence of heterogeneous effects of farm machine use in agricultural
production. In particular, the long-run coefficients of variables representing ploughing, sowing and
harvesting suggest that a 1% increase in farm machine use rate in ploughing, sowing and harvesting
tends to significantly decrease draft animal use by 1.19%, 1.26% and 2.88%, respectively. However, in
the short-run, farm machine use in ploughing, sowing and harvesting has no statistically significant
impact on draft animal use.
Table 2. The impact of farm machine use on draft animal use: pooled mean group estimation.
Variables Model (1) Model (2) Model (3) Model (4)
Adjustment coefficients −0.184 (−4.19) *** −0.170 (−4.27) *** −0.170 (−3.98) *** −0.224 (−4.87) ***
Long-run coefficients
Farm machine use −2.818 (−4.88) ***
Ploughing −1.194 (−2.27) **
Sowing −1.256 (−2.83) ***
Harvesting −2.876 (−6.95) ***
Labour 0.215 (0.93) 0.377 (1.43) 0.050 (0.18) 0.409 (2.04) **
Fertiliser 0.165 (1.17) 0.061 (0.44) 0.115 (0.80) 0.086 (0.71)
Transportation −5.136 (−8.92) *** −5.907 (−8.94) *** −7.162 (−9.23) *** −2.991 (−7.56) ***
Off-farm income −0.362 (−1.54) −0.291 (−1.08) −0.576 (−2.39) ** −0.451 (−2.00) **
Education 0.083 (1.67) * 0.018 (0.31) 0.026 (0.45) −0.004 (−0.08)
Short-run coefficients
Farm machine use 0.587 (1.34)
Ploughing 0.284 (1.53)
Sowing 3.717 (1.07)
Harvesting −0.079 (−0.07)
Labour 0.191 (1.40) 0.105 (0.70) 0.119 (0.78) 0.130 (0.93)
Fertiliser 0.123 (3.05) *** 0.104 (2.03) ** 0.135 (2.71) *** 0.158 (3.25) ***
Transportation 0.539 (2.24) ** 0.590 (2.14) ** 0.942 (2.66) *** 0.432 (1.88) *
Off-farm income 0.014 (0.31) −0.005 (−0.07) 0.063 (1.06) 0.067 (1.16)
Education −0.071 (−1.81) * −0.040 (−0.90) −0.052 (−1.34) 0.047 (1.09)
Constant −0.085 (−3.34) *** 0.094 (4.19) *** 0.145 (4.91) *** 0.014 (0.63)
Log Likelihood 655.712 651.438 667.195 663.056
Observation 952 952 952 952
Note: t statistics in parentheses; * p < 0.1, ** p < 0.05, *** p < 0.01.
With respect to other factors that also affect draft animal use, the long-run coefficient of
the transportation variable is negative and statistically significant, suggesting that convenient
transportation appears to reduce the number of draft animals used. Access to better rural infrastructure
enables farmers to migrate easily to seek better salaries and rely less on agricultural production, leading
to reduced demand for draft animals. However, transportation affects draft animal use positively and
significantly in the short-run. The long-run coefficients of off-farm income variable in columns 4–5
are negative and statistically significant, suggesting that increased income from off-farm activities
appears to reduce draft animal use in sowing and harvesting by 7.16% and 2.99%, respectively. To some
extent, our findings are in line with the findings of Ji et al. [6], who show that off-farm employment
in rural China is more likely to reduce production assets such as small-sized machinery. We do not
find a significant impact of fertiliser on draft animal use in the long-run, but we find that fertiliser
has a positive and statistically significant impact on draft animal use in the short-run. Our estimated
results show that fertiliser increases draft animal use at ploughing, sowing and harvesting in theSustainability 2018, 10, 3015 10 of 16
short-run by 0.10%, 0.14%, 0.16%, respectively. Given the chemical fertiliser use has an adverse effect
on environmental performance such as microbial biomass decreasing and soil acidification, farmers
may choose to use farmyard manure produced by draft animals as a supplementary soil amendment
to improve soil quality [33–35].
For the purpose of comparisons, we also estimated the impact of farm machine use on draft
animal use, using fixed effects and first difference approaches. The results, which are presented in
Table A3 in Appendix A, show that farm machine use has a statistically significant and negative impact
on draft animal use, a finding that is consistent with our findings in Table 2. However, fixed effects and
first difference approaches, which did not take into account the correlation between the error term and
the explanatory, may produce biased estimates. For example, the results estimated by fixed effects and
first difference models show that a 1% increase in farm machine use rate tends to decrease draft animal
use by 1.61% and 0.98%, respectively, which are significantly smaller than the values we observed in
Table 2.
5.3. Impact of Draft Animal Use and Farm Machine Use on Agricultural Productivity
The results regarding the joint impacts of draft animal use and farm machine use on agricultural
productivity are presented in Table 3. In particular, the results estimated from the Cobb–Douglas form
are presented in the second column of Table 3, while the results obtained from the translog functional
form are presented in the last column of the same table. As discussed earlier, the likelihood ratio (LR)
test suggests that the null hypothesis that the Cobb–Douglas form is nested in the translog functional
form can be rejected at the 1% significance level, suggesting the production model should be estimated
under a translog form. The further analyses show that the values of AIC and BIC in the translog
functional form estimation are smaller than that estimated from the Cobb–Douglas form, confirming
the validity of using the results estimated from the translog form for detailed interpretation.
Table 3. Estimation results of the production function.
Variable Cobb–Douglas Form Translog Form
Draft animal use 0.047 (3.707) *** 0.270 (3.386) ***
Farm machine use −0.041 (−2.086) ** −0.130 (−1.129)
Labour −0.044 (−0.883) −0.716 (−2.381) **
Fertiliser 0.048 (1.918) * 0.735 (4.275) ***
t 0.064 (37.263) *** 0.039 (4.600) ***
Draft animal use × Draft animal use 0.008 (0.730)
Draft animal use × Farm machine use 0.010 (0.614)
Draft animal use × Labour 0.024 (1.011)
Draft animal use × Fertiliser 0.048 (2.184) **
Draft animal use × t −0.008 (−6.994) ***
Farm machine use × Farm machine use −0.010 (−0.586)
Farm machine use × Labour −0.080 (−1.367)
Farm machine use × Fertiliser −0.078 (−2.586) ***
Farm machine use × t 0.010 (6.275) ***
Labour × Labour −0.038 (−0.261)
Labour × Fertiliser −0.309 (−4.599) ***
Labour × t 0.036 (10.034) ***
Fertiliser × Fertiliser 0.137 (3.147) ***
Fertiliser × t −0.001 (−0.388)
t×t −0.002 (−9.948) ***
Constant −1.998 (−22.473) *** −0.889 (−2.322) **
R2 0.919 0.953
Likilyhood Ratio (LR) test Chi2(15) = 525.080 ***
AIC −460.661 −955.738
BIC −431.336 −853.099
Observation 980 980
Note: t statistics in parentheses; *** p < 0.01, ** p < 0.05, * p < 0.1; All variables (except for time trend variable, t) are
expressed as log-transformed forms and measured at per hectare base.Sustainability 2018, 10, 3015 11 of 16
The results show that the coefficient of draft animal use variable is positive and statistically
significant, while the coefficient of the interaction term between draft animal use and the time trend
variable draft
(i.e.,2018,
Sustainability 10,animal use ×REVIEW
x FOR PEER t) is negative and statistically significant. The findings suggest that draft
11 of 16
animal use has a positive and significant effect on agricultural productivity, and the effect is declining
drafttime.
over animal Theuse has a positive
coefficient of farmand significant
machine effect on
use variable agricultural
is negative andproductivity,
insignificant,and thethat
while effect is
of the
declining over time. The coefficient of farm machine use variable is negative
variable representing farm machine use × t is positive and statistically significant, highlighting that the and insignificant, while
that of
effect of farm
the variable
machine representing
use on agriculturalfarm machine use ×is tincreasing
productivity is positive overand statistically significant,
time.
highlighting
With respect to other factors that affect agricultural productivity, ouris results
that the effect of farm machine use on agricultural productivity increasingshowover time.
that the
With respect to other factors that affect agricultural productivity, our
coefficient of labour is negative and statistically significant, suggesting that labour exerts a negative results show that the
coefficient
and significantof labour
impactison negative and statistically
agricultural productivity. significant, suggesting
The finding that labour
of the negative exerts a negative
relationship between
and significant impact on agricultural productivity. The finding of the
labour and agricultural productivity may be partially explained by the existence of surplus labour negative relationship between
inlabour
ruraland areas.agricultural
However, productivity
the coefficient may be ofpartially
interactionexplained
term of bylabour
the existence
with timeof surplus labourand
is positive in
rural areas. suggesting
significant, However, the coefficient
that of interaction
labour increases term of labour
agricultural with timeover
productivity is positive
time. andThesignificant,
coefficient
of fertiliser is positive and statistically significant, indicating that the quantity of fertiliser use hasisa
suggesting that labour increases agricultural productivity over time. The coefficient of fertiliser
positive
direct and statistically
positive significant,
effect on agricultural indicating that
productivity, the quantity
a finding ofline
that is in fertiliser use has astudies
with previous direct positive
[5,18,36].
effect on agricultural productivity, a finding that is in line with
For example, Wang et al. [5] showed that fertiliser use significantly increases the average yieldsprevious studies [5,18,36]. Forof
example,
wheat, corn,Wang et al. rice,
japonica [5] showed
soybean, that fertiliser
cotton, anduse significantly
rapeseed increases
in China. The timethe average yields of
trend variable wheat,
is positive
corn, japonica rice, soybean, cotton, and rapeseed in China. The time trend variable is positive and
and statistically significant, suggesting the existence of technological progress over time.
statistically significant, suggesting the existence of technological progress over time.
To ease the understanding, we predicted the output elasticities of draft animal use and farm
To ease the understanding, we predicted the output elasticities of draft animal use and farm
machine use using Equation (5) and presented the results in Table A4 in Appendix A and Figure 3.
machine use using Equation (5) and presented the results in Table A4 in Appendix A and Figure 3.
The information presented in Figure 3 shows that the output elasticities of draft animal use are
The information presented in Figure 3 shows that the output elasticities of draft animal use are
diminishing over time. For example, the output elasticity of draft animal use is 0.185 in 1978, and it is
diminishing over time. For example, the output elasticity of draft animal use is 0.185 in 1978, and it
only −0.001 in 1998. After 1999, the output elasticities of draft animal use become negative, achieving
is only −0.001 in 1998. After 1999, the output elasticities of draft animal use become negative,
at −0.129 in 2012. In comparison, the output elasticity of farm machine use is increasing over time.
achieving at −0.129 in 2012. In comparison, the output elasticity of farm machine use is increasing
The output elasticity of farm machine use is −0.161 in 1978, and it increases to 0.004 in 1996. Afterwards,
over time. The output elasticity of farm machine use is −0.161 in 1978, and it increases to 0.004 in 1996.
the output elasticity of farm machine use remains positive and increasing, which achieves at 0.170 in
Afterwards, the output elasticity of farm machine use remains positive and increasing, which
2012. The findings presented in Figure 3 generally confirm the substitutive effect of farm machine
achieves at 0.170 in 2012. The findings presented in Figure 3 generally confirm the substitutive effect
use on draft animal use, and highlight the importance of farm machines in increasing agricultural
of farm machine use on draft animal use, and highlight the importance of farm machines in increasing
production
agriculturaland productivity
production over time. over time.
and productivity
Figure 3. Trends of output elasticities of the draft animal use and farm machine use from 1978 to 2012.
Figure 3. Trends of output elasticities of the draft animal use and farm machine use from 1978 to 2012.
6. Conclusions and Policy Implications
Although agricultural production worldwide has been largely dependent on draft animals for a
long time, the emergence and development of farm machines is gradually replacing the role that draft
animals have played. However, little is known about the extent to which farm machine use
substitutes draft animal use, and how these two agricultural production activities jointly affectSustainability 2018, 10, 3015 12 of 16
6. Conclusions and Policy Implications
Although agricultural production worldwide has been largely dependent on draft animals for a
long time, the emergence and development of farm machines is gradually replacing the role that draft
animals have played. However, little is known about the extent to which farm machine use substitutes
draft animal use, and how these two agricultural production activities jointly affect agricultural
performance. To fill this research gap, this study analysed the long-run and short-run effects of farm
machine use on draft animal use using a pooled mean group model, as well as the joint effects of farm
machine use and draft animal use on agricultural productivity using a production function model
with fixed effects. The data used in the analyses were from 28 provinces of China for the period of
1978–2012, which were collected by the National Bureau of Statistics of China.
The empirical results showed that farm machine use has a long-run significant and negative
impact on draft animal use, which decreased draft animal use by 2.82% in the long-run. However,
we found that farm machine use at different production stages including ploughing, sowing and
harvesting impacts draft animal use differently. Our estimates revealed that farm machine use in
ploughing, sowing and harvesting in the long-run decreases draft animal use by 1.19%, 1.26% and
2.88%, respectively. However, farm machine use did not affect draft animal use in the short-run.
In addition, we found that transportation and off-farm income are also important determinants of
draft animal use.
The estimates of the panel production function with fixed effects showed that draft animal use
and farm machine use affect agricultural productivity from different directions. In particular, our
results showed that draft animal use has a positive and statistically significant impact on agricultural
productivity, while farm machine use has a negative and insignificant impact on agricultural
productivity. The findings with respect to the interaction terms of draft animal use with time and farm
machine use with time suggested that the effect of draft animal use on agricultural productivity is
decreasing over time, while the effect of farm machine use on agricultural productivity is increasing
over time. We found that the output elasticity of draft animal use decreased from 0.185 in 1978
to −0.129 in 2012, while that of farm machine use increased from −0.161 to 0.170 over the same
time period. Labour appeared to affect agricultural productivity negatively and significantly, while
the effect of labour on agricultural productivity was found to be positive and significant over time.
Fertilizer increased agricultural productivity significantly.
Our results have important implications for sustainable agricultural production. The findings
of the significant substitution effect of farm machine use on draft animal use and the positive effect
of farm machine use on agricultural productivity over time highlight the importance of developing
farm machines to support sustainable agricultural production and suggest that the government should
intensify its efforts to promote farm machine use in rural areas. Given the fact that not all machines
can be adopted in mountainous and hilly regions, the development of farm machines should take into
account regional production conditions. Because a subsidy program for farm machine purchasing
has been introduced in China, the government may think about providing related training for rural
households with respect to the functions of farm machines so as to further enhance the adoption of
the mechanical technologies. Although context specific, the results discussed in the present study are
relevant to other countries such as India, Ghana, Bangladesh and Kenya that are also making efforts to
promote agricultural mechanization with the aim of enhancing sustainable agricultural production.
For future studies, it may be significant to examine how farm machine use through different channels
such as purchasing machinery services and self-owned machines affects agricultural performance.
A limitation of this study is that due to the nature of the data used we do not have
household and farm-level information (e.g., age, gender, household size, credit access, and land
type) which may also affect farmers’ decisions to use draft animals and farm machines and then affect
agricultural productivity.Sustainability 2018, 10, 3015 13 of 16
Author Contributions: X.Z. conducted most of the original work. The paper was finalised based on W.M. and
G.L.’s comments and suggestions.
Funding: This research was funded by National Natural Sciences (grant number: 71473100), the Young Top-notch
Talent for Ten Thousand Talent Program (grant number: 2015-48-2-50), and China Rural Research Institute of
Tsinghua University (grant number: 201705).
Conflicts of Interest: The authors declare no conflict of interest.
Sustainability 2018, 10, x FOR PEER REVIEW 13 of 16
Appendix A
Appendix A
Figure A1. The changes in the growth rate of land input from 1978 to 2012. Note: with the Household
Figure A1. The changes in the growth rate of land input from 1978 to 2012. Note: with the Household
contract Responsibility System (HRS) and the arable land red line of 12,000 million hectare, China’s
contract Responsibility System (HRS) and the arable land red line of 12,000 million hectare, China’s
rural economy has been based on small farm households, and the amount of arable land can hardly
rural economy has been based on small farm households, and the amount of arable land can hardly be
be changed due to the inflexible land rental markets in China.
changed due to the inflexible land rental markets in China.
Table A1. Results of unit root test (IPS) test.
Table A1. Results of unit root test (IPS) test.
Without Time Trend With Time Trend
Variable
Without
StatisticTime Trendp-Value
Value With Time
Statistic Trendp-Value
Value
Variable
Draft animal use Statistic Value
−3.362 0.000
p-Value Statistic−6.031
Value 0.000
p-Value
Farm machine
Draft animal use use −3.362−4.751 0.0000.000 −4.817
−6.031 0.000
0.000
Agricultural
Farm machineproductivity
use −4.751
−10.991 0.0000.000 −4.817
−8.109 0.000
0.000
Agricultural
Labour −7.799
−10.991 0.0000.000 −7.101
−8.109 0.000
0.000
productivity
Fertiliser −11.884 0.000 −11.986 0.000
Labour −7.799 0.000 −7.101 0.000
Transportation
Fertiliser −7.529
−11.884 0.0000.000 −7.895
−11.986 0.000
0.000
Off-farm income
Transportation −10.046
−7.529 0.0000.000 −9.929
−7.895 0.000
0.000
Off-farm income
Education −10.046
−5.336 0.0000.000 −9.929
−6.232 0.000
0.000
Education −5.336 0.000 −6.232 0.000
Note: The variables are logarithm-transformed and first-order differenced.
Note: The variables are logarithm-transformed and first-order differenced.
Table A2. Results of cointegration test.
Draft Animal Production
Tests Statistics
Use Model Function Model
Westerlund test Variance ratio −2.429 (0.008) −1.462 (0.072)
Modified Philips-Perron test −2.947 (0.002) −4.672 (0.000)
Pedroni test Philips-Perron test −5.156 (0.000) −1.560 (0.059)
Augmented Dickey-Fuller test −5.690 (0.000) −1.285 (0.010)
Note: p-value in parentheses.Sustainability 2018, 10, 3015 14 of 16
Table A2. Results of cointegration test.
Tests Statistics Draft Animal Use Model Production Function Model
Westerlund test Variance ratio −2.429 (0.008) −1.462 (0.072)
Modified Philips-Perron test −2.947 (0.002) −4.672 (0.000)
Pedroni test Philips-Perron test −5.156 (0.000) −1.560 (0.059)
Augmented Dickey-Fuller test −5.690 (0.000) −1.285 (0.010)
Note: p-value in parentheses.
Table A3. The impact of farm machine use on draft animal use: FE and FD estimations.
Variables FE Model FD Model
Farm machine use −1.608 (−1.87) * −0.977 (−3.60) ***
Labour 0.032 (0.11) 0.507 (3.59) ***
Fertiliser 0.075 (0.55) 0.118 (3.12) ***
Transportation −1.143 (−3.56) *** −0.254 (−2.41) **
Off-farm income −0.617 (−3.10) *** −0.132 (−1.23)
Education 0.037 (0.40) −0.080 (−1.74) *
Log Likelihood −508.652 80.542
Observations 980 952
Note: t statistics in parentheses; *** p < 0.01, ** p < 0.05, * p < 0.1. FE: Fixed effects; FD: First difference.
Table A4. Trends of production elasticities of the input factors from 1978 to 2012.
Period I Period II
Year Draft Animal Use Farm Machine Use Year Draft Animal Use Farm Machine Use
1978 0.185 −0.161 1998 −0.001 0.041
1979 0.186 −0.168 1999 0.011 0.011
1980 0.186 −0.175 2000 −0.008 0.017
1981 0.169 −0.152 2001 −0.011 0.018
1982 0.159 −0.139 2002 −0.024 0.037
1983 0.145 −0.123 2003 −0.039 0.037
1984 0.130 −0.103 2004 −0.049 0.054
1985 0.105 −0.052 2005 −0.061 0.075
1986 0.103 −0.051 2006 −0.074 0.103
1987 0.097 −0.043 2007 −0.079 0.102
1988 0.087 −0.032 2008 −0.083 0.106
1989 0.082 −0.030 2009 −0.100 0.131
1990 0.090 −0.045 2010 −0.119 0.172
1991 0.069 −0.016 2011 −0.127 0.182
1992 0.055 0.002 2012 −0.129 0.170
1993 0.056 −0.012
1994 0.050 −0.005
1995 0.049 −0.011
1996 0.041 0.004
1997 0.001 0.041
References
1. Kienzle, J.; Ashburner, J.E.; Sims, B.G. Mechanization for Rural Development: A Review of Patterns and
Progress from around the World. In Integrated Crop Management (FAO) No. 20; Food and Agriculture
Organization of the United Nations: Rome, Italy, 2013.
2. Guthiga, P.M.; Karugia, J.T.; Nyikal, R.A. Does use of draft animal power increase economic efficiency of
smallholder farms in Kenya? Renew. Agric. Food Syst. 2007, 22, 290–296. [CrossRef]
3. Mrema, G.; Soni, P. A Regional Strategy for Sustainable Agricultural Mechanization: Sustainable Mechanization
across Agri-Food Chains in Asia and the Pacific Region; Food and Agriculture Organization of the United
Nations: Rome, Italy, 2014.You can also read