Fitness consequences of biochemical adaptation in Drosophila melanogaster populations under simultaneous selection for faster pre adult ...
←
→
Page content transcription
If your browser does not render page correctly, please read the page content below
www.nature.com/scientificreports
OPEN Fitness consequences
of biochemical adaptation
in Drosophila melanogaster
populations under simultaneous
selection for faster pre‑adult
development and extended
lifespan
Khushboo Sharma & Mallikarjun N. Shakarad *
In holometabolous insects like Drosophila melanogaster, critical size is an important time point during
larval life, for irreversible commitment to metamorphosis. Here, we studied the impact of restricted
growth duration in terms of selection for faster pre-adult development in Drosophila melanogaster
populations which resulted in the evolution of reduced critical size on adult life history traits. Selection
for faster pre-adult development resulted in biochemical adaptation in larval physiology with no
compromise in major biomolecules at critical size time point. The flies from the selected populations
seem to not only commit to metamorphosis on the attainment of critical size but also seem to
channelize resources to reproduction as indicated by similar life-time fecundity of CS and NS flies from
selected populations, while the Control CS flies significantly lower life-time fecundity compared to
Control NS flies. The flies from selected populations seem to achieve longevity comparable to control
flies despite being significantly smaller in size-thus resource constrained due to faster pre-adult
development.
Abbreviations
SLC Standard laboratory conditions
LSM Liquid standard media
RO Reverse osmosis
CS Critical size
NS Normal size
S Selected
C Control
LSP Larval serum protein
CNS Central nervous system
ANOVA Analysis of variance
Early life nourishment is known to affect the adult physiology and various life-history traits in Drosophila mela‑
nogaster1–3 and other holometabolous insects4. In D. melanogaster, early life is divided into pre-adult duration
consisting of mobile and voraciously feeding larval phase and non-mobile pupal phase. Further, the larval phase
is marked into two stages—(i) pre-critical stage and (ii) post-critical (terminal growth period) stage, separated
oint5,6. Larval critical size commit the larva to an irreversible process of metamorphosis,
by critical size time p
and starvation post attainment of critical size does not affect time course to undergo m etamorphosis5,7. The role
Evolutionary Biology Laboratory, Department of Zoology, University of Delhi, Delhi, India. *email: beelab.ms@
gmail.com
Scientific Reports | (2021) 11:16434 | https://doi.org/10.1038/s41598-021-95951-2 1
Vol.:(0123456789)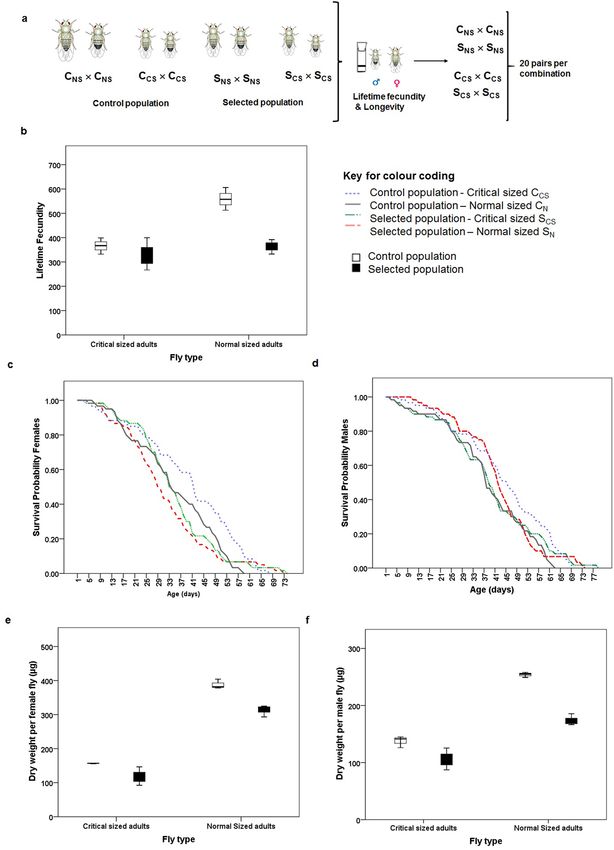
www.nature.com/scientificreports/
of critical size as “physiological switch” is well established and is marked by ecdysone p ulse7. Further, critical
size is reported to also act as “energy allocation switch” in various species of Drosophila8,9. In another dipteran
species, Aedes egypti, it has been previously reported that threshold amount of energy reserves are pre-requisite
to the process of metamorphosis in addition to ecdysone level during last larval instar, thus implying significance
of energy budgeting in the dipteran s pecies10.
‘Developmental threshold model’ states that there is always a minimum size or condition that must be sur-
passed before the life-history transition occurs in a wide variety of species undergoing metamorphosis11,12. While
larger threshold causes a negative relationship between age of transition and growth conditions, the smaller
threshold would result in a comparatively positive relationship for higher growth rate. In fast-developing indi-
viduals, once this threshold is passed then the excess of energy or resource is translated to overhead threshold
and invested in fecundity11.
In Drosophila melanogaster, this minimum developmental threshold is represented by critical size/time
point5,6,13. Being an inhabitant of rotting fruits and vegetables, it is under direct selection for faster pre-adult
development due to over-crowding and food limitation. Selection for faster pre-adult development is known to
exhibit reduced development time and subsequently results in the smaller adult body s ize13–18. In D. melanogaster,
environmental conditions during larval life are suggested to affect its adult s ize19 and adult p hysiology19,20 which
1,3,21–24
in turn affect various life-history t raits . Further, if the larval nutritional environment or developmental
diet is rich then they tend to emerge with larger adult body size and attain reproductive maturity at an early age
that has a positive implication on fi tness11,25,26. In general though not u niversal18 “bigger is better” idea prevails
with larvae spending more time in weight (equal to resource/energy) gain under good nourishment conditions,
eventually emerging as larger adults with higher fitness. Also ‘Silver-spoon h ypothesis25,27’ posits that individu-
als born in good conditions have fitness or performance advantages in later life with many examples25,27 and
those born in poor conditions are at a permanent d isadvantage27. Varying the quality or quantity of diet during
development in D. melanogaster affects adult body size and its associated life history, hence it is known to serve
as a tractable model to study dietary manipulation during pre-adult and adult s tages24,28,29.
The inverse relationship between time to maturity (metamorphosis) and size is expected in species that live
in ephemeral h abitat12. A physiological change from resource-dependent (pre-critical) to resource independent
(post-critical duration) rate of development occurs at critical size or threshold time p oint7. Further, the quality
30–33
of nutrition during developmental stages affect adult life history traits . Furthermore, quality of food during
developmental stage is also known to result in short term adaptive response where in females that were deprived
of yeast diet as larvae had reduced fecundity but mortality rate was unaltered24 suggesting that longevity-fecun-
dity trade-off may not be universal.
In the present study, we demonstrate the significance of critical size/threshold size that commit holometabol-
ous insect like Drosophila melanogaster to irreversible process of m etamorphosis5,7, on larval physiology and adult
life history traits in populations under simultaneous selection for faster pre-adult development and extended
lifespan. Of the six, Drosophila melanogaster populations used in this study, three-selected populations were
internally driven to stop feeding in about 17-h post attainment of critical size thus curtail food intake, while the
ancestral three-control populations fed for 42-h post attainment of critical size though they had similar food
intake capacity during larval life13. We observed the biochemical adaptations in larval physiology of selected
populations. There was comparable glycogen level during third larval instar while level of lipid and protein con-
tent were reduced during post-critical duration though similar at critical size time point due to selection for faster
pre-adult development. The realized life-time fecundity of the populations selected for faster pre-adult develop-
ment was significantly different when allowed to feed till natural pupation compared to the control populations
under similar conditions. Interestingly, within the selected populations, the fecundity of the adult flies that had
fed only till attainment of critical size thus under curtailed food in-take was comparable to those that fed up to
their natural pupation time suggesting that the flies from the selected populations were committing the avail-
able energy reserves to reproduction while committing themselves to irreversible process of metamorphosis.
Results
We subjected each trait data to Shapiro–Wilk normality test (data not shown). The protein content, lipid con-
tent and total energy data were non-normal and hence were subjected to log-transformations. For all data that
passed the normality test, Bartlett’s test was carried out to assess homogeneity of variance. The results indicate
homoscedasity (see Supplementary Table S1). Following this, each trait data was subjected to factorial analysis of
variance (ANOVA) with selection, larval feeding duration and gender as fixed factors, and replications as random
factors as in Prasad et al.17, unless mentioned otherwise. Since, in all cases, the population means were used as
the units of analysis, only fixed-factor effects and interactions could be tested for s ignificance17.
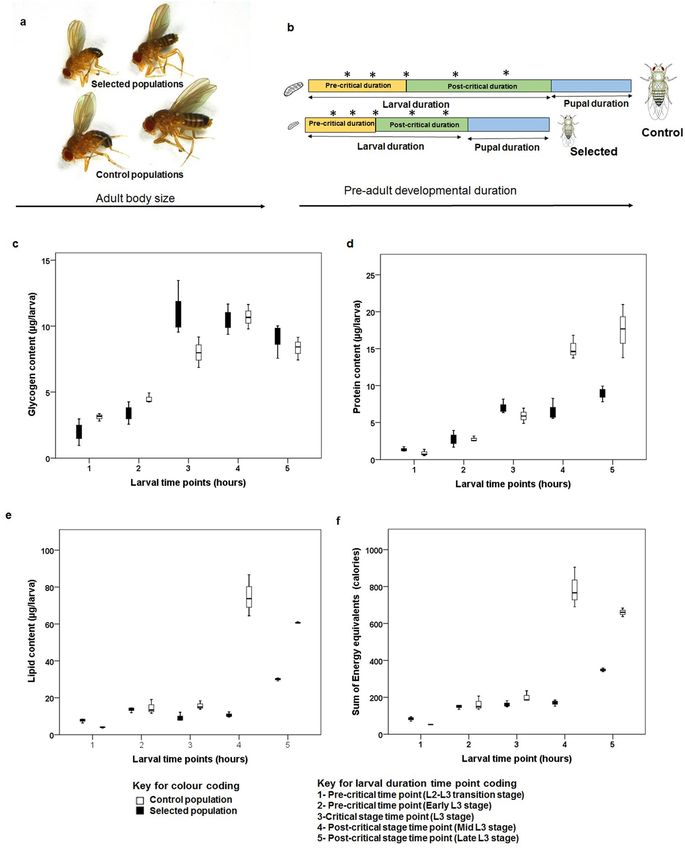
Biochemical assays during larval life. There was no significant effect of selection ( F1,20 = 0.481, p = 0.496,
Fig. 1c) on glycogen levels. However, there was a highly significant effect of larval growth time (F4,20 = 62.678,
p = 0.000) on glycogen content (Fig. 1c). Further, selection × larval growth time interaction was also signif-
icant (F4,20 = 3.724, p = 0.02). Protein and lipid content, and total energy level traits failed the normality test
and hence were log-transformed, validated for normality and then subjected to factorial ANOVA. Interest-
ingly, selection (F1,20 = 3.551, p = 0.074) showed no significant effect on protein content. However, larval growth
time (F4,20 = 95.957, p = 0.000) and selection × larval growth time interaction (F4,20 = 7.466, p = 0.001) had sig-
nificant effect on protein content (Fig. 1d). Similarly, selection (F1,20 = 85.446, p = 0.000), larval growth time
(F4,20 = 161.565, p = 0.000) and selection × larval growth time interaction ( F4,20 = 58.42, p = 0.000) had significant
effect on lipid content(Fig. 1e). The energy equivalents of the biomolecules were summed and log-transformed
before the effects of selection, larval growth time and their interaction were ascertained. There was a significant
Scientific Reports | (2021) 11:16434 | https://doi.org/10.1038/s41598-021-95951-2 2
Vol:.(1234567890)www.nature.com/scientificreports/
Figure 1. (a) Representative images of male and female flies from selected and control populations. (b)
Schematics of protocol followed for larval biomolecule assay time points in selected and control populations. (c)
Glycogen content (µg) per larva, (d) protein content (µg) per larva, (e) lipid content (µg) per larva, and (f) sum
of energy equivalent (calories). Box plot is depicting the median value along with lower and upper quartile and
the whiskers indicate the minimum and maximum values. *In (b) indicate the larval sampling time points.
Scientific Reports | (2021) 11:16434 | https://doi.org/10.1038/s41598-021-95951-2 3
Vol.:(0123456789)www.nature.com/scientificreports/
effect of selection (F1,20 = 85.143, p < 0.000; Fig. 1f), larval growth time (F4,20 = 256.753, p < 0.000; Fig. 1f) and
selection × larval growth time interaction (F4,20 = 58.338, p < 0.000).
Realized life‑time fecundity and dry weight of flies. There was equal variance among all the dataset
in present assay (see Supplementary Table S1). There was a significant effect of selection ( F1,8 = 18.772, p = 0.003,
Fig. 2b) on realized life-time fecundity. We observed significant effect of fly type on realized fecundity with
flies that emerged from larvae fed up to critical time point showing significantly lower fecundity (F1,8 = 17.972,
p = 0.003, Fig. 2b). Further, there was selection × fly type interaction effect (F1,8 = 8.731, p = 0.018). Fitting a
regression model to fecundity as a function of female dry weight using the data from control critical size and
normal flies yielded, fecundity = 232.438 + (0.844 × female dry weight). The average weight of the selected critical
size female flies was 117.876 μg and that of normal size female flies was 312.996 μg. Using the regression from
control flies, the predicted fecundity of the selected critical size and normal size flies would be 331.925 and
496.607 respectively. The observed fecundity of the selected normal flies was significantly lower than expected
from regression model (χ2 = 35.748, p < 0.001). Three way ANOVA with selection, fly type (feeding only till criti-
cal time point or feeding till natural pupation) and gender as independent variables and dry weight as depend-
ent variable indicated significant effect of selection (F1,16 = 83.635, p < 0.000), gender (F1,16 = 151.831, p < 0.000)
and fly type (F1,16 = 613.097, p < 0.000). However selection × gender (F1,16 = 0.006, p = 0.939) and selection × gen-
der × fly type (F1,16 = 0.246, p = 0.627) interactions were not significant.
Longevity and survival probability. There is no significant effect of selection and diet curtailing post
attainment of critical size on average longevity of both male and female flies. Overall, CS females had signifi-
cantly higher median longevity than NS flies. However, there was no significant effect of selection on median
longevity. The maximum lifespan of critical-sized males was significantly altered (see Supplementary Table S2).
Average, median and maximum longevity are descriptive statistics that can at best provide overall comparison.
Since our sample sizes are small compared to those of Rose et al.48 hence we compared the survival probabilities
using Kaplan–Meier Analysis—a non parametric test to assess age specific survival r ates34. There was a significant
effect of selection and fly type on survival probabilities of both male and female flies (see Table 1, Fig. 2c,d).
Discussion
Recently, it has been reported that glycogen metabolism is required during third larval instar for normal body
size growth and even the developmental delay would not rescue the arrest of body size due to reduced glycogen
levels in the larval stage35. Further, it has been evidenced that defects in glycogen metabolism are known to
affect larval physiology and hence the adult fitness35. While the fat body, muscles and Central Nervous Sys-
tem (CNS) in larva act as the site for glycogen s torage36, glycogen synthesis occurs during late larval life in fat
body36,37. Furthermore, fat bodies act as a peripheral system for ecdysone metabolism38. Despite smaller larval
size than c ontrols39, the selected populations had comparable levels of glycogen (Fig. 1c, Supplementary Table S4)
throughout the third instar suggesting that glycogen is the primary source of energy that is possibly driving the
physiological processes leading to early expression and release of ecdysone in selected p opulations39 that might
in turn facilitate faster development.
When we compared the trend of lipid content during larval life, it is comparable at first (48 h post-hatching of
synchronized eggs), 2nd (early L3) and 3rd larval time point (Critical size time point-developmental threshold/
metamorphosis commitment time point) suggesting the utilization of lipids for metabolic processes during these
periods (see Supplementary Table S4).The lower level of lipid post-critical size attainment at 4th and 5th larval
time point is perhaps due to drastic decrease in the post-critical growth duration of the selected p opulations13.
It is known that lipids are majorly stored in fat body and utilized during the pupal stage and early adult life23.
The energy equivalent (in terms of calories) of lipids are highest (see Supplementary Fig. 1c) among the three
macromolecules. Selected populations undergo early metamorphosis without compromising on pupal duration13
despite having lower energy levels towards the end of the larval phase, suggesting that the energy levels up until
critical time point might be channelized towards metamorphosis.
There was marginal effect of selection (p = 0.074) on the protein content. The comparable protein levels at
1st, 2nd and 3rd time point representing the time points of higher wet weight gain (see Supplementary Table S4)
could be responsible for the marginal effect. The low protein level at 4th and 5th larval time point in selected
populations might be due to the utilization of proteins in the growth and development of imaginal d iscs39. It
is likely that as protein content during late larval life in selected populations is catabolized for preparing the
organism for metamorphosis while the control flies continue to accumulate proteins during nearly 40 h long
post-critical duration13. For example, proteins like Larval serum protein (LSP) increases drastically in the third
larval stage, thus making it the most abundant protein during the post-critical duration that contributes to the
major wet weight of l arva40 in our control populations.
The major macromolecules and energy results indicate that our selected populations have evolved mecha-
nisms to maintain the necessary levels of molecules (and energy) till attainment of critical size-a time point at
which the organisms commit to an irreversible process of metamorphosis. This is in agreement with Hironaka
et al.8 who proposed that the investment value in larval tissue is more during the pre-critical period than ter-
minal growth period (a.k.a. post-critical duration)8. Further, supporting the view that critical size in Drosophila
melanogaster is acting as an optimal switch for energy allocation during larval l ife8,9. Furthermore, following the
model for developmental threshold- with the age of maturity (metamorphosis-in the present context) and size
at transition, it is likely that selection for faster pre-adult development evolved smaller developmental threshold
(critical size-in this case) through higher growth rate during second larval instar13 thus accumulating suffi-
cient energy reserves to sustain the development without compromising on their metamorphosis d uration11,13.
Scientific Reports | (2021) 11:16434 | https://doi.org/10.1038/s41598-021-95951-2 4
Vol:.(1234567890)www.nature.com/scientificreports/
Figure 2. (a) Specifications of pairs of flies for longevity and realized life-time fecundity assay set up. (b)
realized life-time fecundity of selected and control population under critical size and normal size conditions,
(c) survival probability of females, (d) survival probability of males, (e) dry weight (µg) per female fly, and (f)
dry weight (µg) per male fly. Box plot is depicting the median value along with lower and upper quartile and the
whiskers indicate the minimum and maximum values.
Scientific Reports | (2021) 11:16434 | https://doi.org/10.1038/s41598-021-95951-2 5
Vol.:(0123456789)www.nature.com/scientificreports/
Female Male
Population and fly type SNS and C
NS SCS and S
NS CCS and C
NS SNS and C
NS SCS and S
NS CCS and C
NS
χ2 47.78 47.67 31.38 21.87 20.41 20.10
P < 0.001 < 0.001 < 0.001 < 0.001 < 0.001 < 0.001
Table 1. Comparison of age dependent survival of males and females under selection for faster pre-adult
development and extended longevity, and larval diet curtailing at critical size.
Although the selected populations are under the physiological trigger to complete development due to higher
ecdysone levels throughout L339 they can accumulate adequate proteins and lipids to maintain their phenotypic
integrity albeit emerge as small adults13,39.
A developmental dietary history is known to influence adult p hysiology1. In general, the trade-off between
longevity and life-time fecundity are well documented in Drosophila melanogaster28,41–45 and other holometabol-
ous insects like Speyeria mormonia46. Consistent with dietary restriction studies, the control CS flies had lower
fecundity (Fig. 2b). However, exception to larval dietary manipulation has also been reported. For example in
holometabolous Lepidopteran butterfly, Speyeria mormonia, there was no independent effect of semi-starvation
on realized egg laying45 suggesting an indirect effect of larval dietary restriction on fecundity. In our study, selec-
tion for faster pre-adult development that resulted in small-sized adults (Fig. 2e,f) had significantly reduced
life-time fecundity (Fig. 2b, Supplementary Table S3) perhaps due to small sized o varies18 that in turn could have
affected the total realized life-time fecundity. Interestingly the life-time fecundity of the critical size flies from
the selected and control populations were comparable suggesting that flies might be committing certain amount
of resources to reproduction at critical time point. Further, the significantly higher fecundity of normal control
flies certainly seems to be due their increased post-critical feeding period. Our results are in agreement with
Min et al.2 where they reported the contribution of larval resources in early life fecundity in addition to adult
diet2. However, a recent study reported reduced reproductive fitness as a consequence of small adult size due to
dietary manipulation during larval growth p eriod47. Further, in agreement with Klepsatel et al.47, our selected
populations had reduced life-time fecundity owing to their small adult size perhaps due to drastic reduction in
post-critical feeding duration and thus represent the cost of rapid development.
The selected populations which is under direct selection for faster pre-adult development and reproduction
at unspecified advanced age for more than 134 generations does not show increase in longevity despite ~ 33 day
difference in the last age at which reproduction occurs in the selected populations compared to their ancestral
controls. This is in contrast to previous experimental evolution studies that have exerted this level of selection for
rapid development on age-at-reproduction and reported dramatic decrease of ~ 16 days in mortality-rate plateaus
of ACO populations compared to CO p opulations48. They reported a 14–18 day difference in average longevity
with only a 20 day difference in age-at-reproduction. While, in present study, the female control population
shows a mean longevity that is 3–5 days higher than the selected populations (Fig. 2, Supplementary Fig. S2 and
Supplementary Table S2) suggesting yet another cost the selected populations are paying for rapid development.
The reduction in life-time fecundity was accompanied by significant differences in survival probability of
females that had emerged from larvae that fed up to critical size than those that had fed till their natural pupa-
tion time. This is in sharp contrast to the study on Speyeria mormonia where larval food restriction resulted in
smaller adults and larval feeding duration affected lifespan but not realized f ecundity46. A recent study reported
the non-universal nature of the trade-off between longevity and f ecundity29. However, conscious curtailing of diet
duration post attainment of critical size in larval life resulted in significant difference in adult survival probability.
The direct selection for faster pre-adult development for more than 134 generations has led to the evolution of
smaller adult size through reduced critical size13 while indirect selection for late reproduction might be respon-
sible for non-significant difference in life span exhibiting limited trade-off44. Further, early attainment of high
ecdysteroids titer and large Prothoracic gland at comparable time points during larval development in selected
populations might be the reason for the evolution of small adult body size and reduced developmental duration39.
Conclusion
Overall, our study provides insight into the role of critical size on adult life-history in Drosophila melanogaster
populations. The populations that are under simultaneous selection for faster pre-adult development and thus
under curtailed food intake, perhaps commit their energy to reproduction and adult longevity immediately on
attainment of critical size as indicated by comparable life-time fecundity and increased survival probability of
flies that emerged from larvae fed till critical size as opposed to those that fed till natural pupation. However, the
flies from the control population that emerged from larvae fed up to critical size had reduced life-time fecundity
compared to those that emerged from larvae fed till natural pupation time. Taken together, the selected popula-
tions had evolved their physiology to commit available resources to adult fitness at the time of committing to
irreversible process of metamorphosis.
Methods
Fly husbandry. Two kinds of laboratory Drosophila melanogaster populations were used in this study. The
Control (C) populations were on 21 days egg to egg discrete generation cycle, while the Selected (S) populations
were derived from the controls by direct selection for faster pre-adult development and indirect selection for
extended longevity (Fig. 1a,b). Detailed protocols adopted in rearing and maintenance of C and S populations
Scientific Reports | (2021) 11:16434 | https://doi.org/10.1038/s41598-021-95951-2 6
Vol:.(1234567890)www.nature.com/scientificreports/
are explained previously13. Briefly, each of the three C populations were cultured in 40 vials with 6 mL standard
banana-jaggery media (SM) at a density of 40–50 eggs per vial and incubated at Standard Laboratory Condi-
tions (SLC)13 for full 12 days13. At the end of 12 days, all emerging flies from the 40 vials were transferred to pre-
labeled plexi-glass population cages and provided with fresh food every alternate day till day 18. On day 18, fresh
food plate was supplemented with live yeast-acetic acid paste. Eggs for initiating the next generation were col-
lected on day 21 from the previous egg collection day. Each of the three S populations was derived from the three
C populations by collecting 160 vials of 60–80 eggs per 6 mL banana-jaggery food vial. The vials were incubated
at SLC. The early emerging 15–20 flies (as ascertained by empty pupal cases) from each vial were transferred to
pre-labeled population cages. Two sister cages were maintained per S population to avoid adult crowding. The S
population cages too were provided with fresh food plates every alternate day till 50% mortality was noticed in
any of the cages, at which point all cages were provided fresh food plates supplemented with live yeast-acetic acid
paste for three days following which eggs for starting next generation were collected. The eggs obtained from the
two sister cages of a given population were mixed and redistributed into 160 vials.
Originally, the Control populations (also called as JB populations) were derived from IV p opulations49 and
17
are described in detail in Prasad et al. . The selected and control populations had been through 134 and 242
generations respectively at the time of being used in this study. To remove non-genetic parental effects which
might appear due to the differences in maintenance regime, both the S and C populations were run through
common rearing conditions for 1 generation at a moderate density of 50 eggs per 6 mL banana-jaggery media
vial and 40 vials per population before being used in this study. The egg collection from the S and C populations
were staggered by their developmental time difference to synchronize the emergence of adults (Fig. 1b). All
adults emerging from each of the 40 vials of a given population were transferred to pre-labeled population cage
with fresh SM plate. These populations are referred to as standardized fl ies13,17. Embryos for all the experiments
were obtained from these standardized flies (SF).
Generation of critical size adults and normal‑sized adults. Synchronized eggs were collected from
SF, evenly spread on agar–agar plates and incubated at SLC. Freshly hatched larvae (~ 22 h post-egg-laying)
were harvested using a fine camel hair brush and transferred to Petri-plates (5.5 mm diameter, Tarson) with
2000 µL of Liquid Standard Media (LSM) at a density of 30 larvae per plate13. Twenty such plates per population
were incubated at SLC. The larvae from all the 20 plates were re-harvested from LSM plates after 64 and 72 h
(post-egg-lay) for S and C populations respectively, washed with Reverse osmosis (RO) water, rolled on tissue
towel and randomly transferred (25 larvae per vial) to vials containing 6 mL non-nutritive agar–agar or SM and
incubated at SLC13. At every 6 h interval, the emerging flies from these vials were collected, sorted according to
their gender and held as virgins in pre-labeled holding vials with 6 mL SM till use in further assays. The adults
that emerged from vials containing non-nutritive agar are referred to as critical-sized (CS) adults, while those
that emerged from vials containing SM are referred to as normal-sized (NS) adults.
Macromolecule quantification during larval life. Glycogen and lipid content were estimated using Van Handel’s
method50 and the protein content was estimated using Smith’s method51 with minor modifications.
All three macromolecules were quantified at 5 larval time points (Fig. 1b)—viz., pre-critical stages (L2 to
L3 transition stage—48 h for both C and S populations; Early L3 stage-56 h and 64 h for S and C populations
respectively), critical size stage (64 h and 72 h for S and C) and post-critical stages (Late L3 stages—72 h and
104 h; before pupation L3—80 h and 112 h for S and C populations respectively) of larval life (Fig. 1b). All the
sampling time intervals mentioned are from the time of transfer of newly hatched larvae to LSM plates. The
detailed protocols used in the estimation of the macromolecules are as follows:
Glycogen estimation. Five randomly chosen larvae were homogenized in 400 µL of 2% Na2SO4. 80 µL of
homogenate was aliquoted into 5 mL Eppendorf tube, to which 184 µL of N a2SO4 and 3736 µL of the (fresh) mix-
ture of chloroform and methanol (1:1) was added. The tubes with the mix were centrifuged (Eppendorf, 5430R)
at 14,000 r.p.m. for 10 min at 4 °C. The supernatant was discarded and the pellet was air-dried for 10 min. The
pellet was resuspended in 2000 µL Anthrone reagent and heated at 90 °C in water-bath for 10 min. Aliquots were
kept on ice for 5 min following which absorbance was measured at 625 nm on ELISA plate reader (ECIL micro
scan, MS5605A). The assay was repeated in triplicate for both selected (n = 3) and control population (n = 3), and
average of triplicate were used in statistical analysis.
Protein estimation. Precipitation assay was done before quantification of protein followed by BCA method of
protein quantification52. Five randomly chosen larvae were homogenized in 400 µL of 2% N a2SO4. Then 80 µL
of homogenate was aliquoted and 500 µL of 0.15% Deoxycholate was added to the aliquot. After an incubation
period of 10 min on ice, 1000 µL 3 M Trichloroacetic acid (TCA) was added. The aliquots were centrifuged at
8500 r.p.m. (Eppendorf, 5430R) for 15 min at 4 °C. Protein was precipitated at the base of each aliquot. Pellets
were washed with HCl and air-dried. BCA reagent was added to each of the pellets, resuspended and heated in
water-bath at 60 °C for 10 min. Absorbance was recorded at 562 nm using ELISA plate reader (ECIL micro scan,
MS5605A). The assay was repeated in triplicate for both selected (n = 3) and control population (n = 3), and aver-
age of triplicate were used in statistical analysis.
Lipid estimation. Five randomly chosen larvae were homogenized in 200 µL of PBS (1×). 1 mL of freshly pre-
pared methanol and chloroform mixture (1:1) was added to the homogenate and vortexed. This was followed by
centrifugation at 4 °C at 4000 r.p.m. (Eppendorf, 5430R). Two phases of the solution were separated. From the
lower layer of solution, 200 µL of the solution was taken in an aliquot and was evaporated completely at 90 °C,
Scientific Reports | (2021) 11:16434 | https://doi.org/10.1038/s41598-021-95951-2 7
Vol.:(0123456789)www.nature.com/scientificreports/
using water-bath. 50 µL of H2SO4 was added post evaporation and incubated at 60 °C for 10 min, cooled on ice
for 5–7 min., following which 1000 µL of Vanillin reagent was added and incubated at room temperature for
30 min. Absorbance was taken at 525 nm using ELISA plate reader (ECIL micro scan, MS5605A). The assay was
repeated in triplicates per population and means of triplicate were used in statistical analysis.
All the biomolecules were converted to their energy e quivalents52 and compared.
Adult life‑history traits. Life‑time fecundity and longevity. One day old virgins from holding vials were used
in this assay. The flies were anaesthetized using C O2 and a female and male pair were transferred to fresh vials
with 3 mL SM. A total of 20 pairs per treatment i.e. 20 pairs of critical sized flies and 20 pairs of normal sized flies
were set up in both control and selected populations (Fig. 2a). Any fly that did not wake up within 1 h of transfer
was replaced with a new fly of the same gender. Further, any fly that died within the first 24 h of set up was also
replaced by a fresh fly. The pair of flies were transferred to fresh 3 mL SM vials every 24 h. The eggs laid in the
preceding 24 h were counted under stereo zoom microscope (Carl Zeiss Binocular stereo zoom microscope,
Stemi 305) and recorded. Census records were also maintained till the death of all flies. The average life-time
fecundity and lifespan were estimated from this primary data (Fig. 2a).
Dry weight. Synchronized eggs from standardized flies were incubated at SLC. Five replicate vials per popula-
tion with 50 eggs per vial were incubated in 6 mL of SM. Once blackening of pupae started, flies were observed
at a time interval of six hours and adult flies were sorted on the basis of gender. They were pooled and transferred
to pre-clean and dry vials as 10 flies per replicate population (n = 5), with a total of 50 flies per population per
gender. Fresh weight of flies was taken and they were dried in oven at 70 °C for 36 h and weighed to obtain dry
weight.
Data analysis. In all cases except survival probability function, factorial-ANOVA, was performed using
replicate population means and graphs were prepared using SPSS v. 2 253. Since population means were used as
units of analysis with selection, larval growth stage and fly gender as fixed variables and replication as a random
variable54 only fixed-factor effects and interactions could be tested for s ignificance13,17. The significance of adult
survival probability curves was analyzed using Kaplan–Meier log-rank test34. Effect of female adult size on life-
time fecundity was ascertained using linear regression analysis54.
Ethics approval and consent to participate. Not applicable.
Data availability
Following is the link for reviewer: https://datadr yad.org/stash/share/eG4xK0tSmnCIOTYYdBoRcEQrlFwIAE
0HLrykA2dlGls.
Received: 19 February 2021; Accepted: 2 August 2021
References
1. Stefana, M. I. et al. Developmental diet regulates Drosophila lifespan via lipid autotoxins. Nat. Commun. 8, 1384 (2017).
2. Min, K. J., Hogan, M. F., Tatar, M. & O’Brien, D. M. Resource allocation to reproduction and soma in Drosophila: A stable isotope
analysis of carbon from dietary sugar. J. Insect Physiol. 52, 763–770 (2006).
3. Reis, T. Effects of synthetic diets enriched in specific nutrients on Drosophila development, body fat, and lifespan. PLoS One 11,
1–12 (2016).
4. O’Brien, D. M., Boggs, C. L. & Fogel, M. L. Pollen feeding in the butterfly Heliconius charitonia: Isotopic evidence for essential
amino acid transfer from pollen to eggs. Proc. R. Soc. B Biol. Sci. 270, 2631–2636 (2003).
5. Moed, G. H. D. E., Kruitwagen, C. L. J. J., Jong, G. D. E. & Scharloo, W. Critical weight for the induction of pupariation in Drosophila
melanogaster: Genetic and environmental variation. J. Evol. Biol. 12, 852–858 (1999).
6. Mirth, C., Truman, J. W. & Riddiford, L. M. The role of the prothoracic gland in determining critical weight for metamorphosis
in Drosophila melanogaster. Curr. Biol. 15, 1796–1807 (2005).
7. Mirth, C. K., Truman, J. W. & Riddiford, L. M. The ecdysone receptor controls the post-critical weight switch to nutrition-
independent differentiation in Drosophila wing imaginal discs. Development 136, 2345–2353 (2009).
8. Hironaka, K. & Morishita, Y. Adaptive significance of critical weight for metamorphosis in holometabolous insects. J. Theor. Biol.
417, 68–83 (2017).
9. Hironaka, K., Fujimoto, K. & Nishimura, T. Optimal scaling of critical size for metamorphosis in the genus Drosophila. iScience
20, 348–358 (2019).
10. Telang, A., Frame, L. & Brown, M. R. Larval feeding duration affects ecdysteroid levels and nutritional reserves regulating pupal
commitment in the yellow fever mosquito Aedes aegypti (Diptera: Culicidae). J. Exp. Biol. 210, 854–864 (2007).
11. Day, T. & Rowe, L. Developmental thresholds and the evolution of reaction norms for age and size at life-history transitions. Am.
Nat. 159, 338–350 (2002).
12. Wilbur, H. M. & Collins, J. P. Ecological aspects of amphibian metamorphosis. Science 182, 1305–1314 (1973).
13. Sharma, K., Mishra, N. & Shakarad, M. N. Evolution of reduced minimum critical size as a response to selection for rapid pre-adult
development in Drosophila melanogaster. R. Soc. Open Sci. 7, 191910 (2020).
14. Zwaan, B., Bijlsma, R. & Hoekstra, R. F. Artificial selection for developmental time in D. melanogaster in relation to the evolution
of ageing: Direct and correlated responses. Evolution 49, 635–648 (2013).
15. Nunney, L. The response to selection for fast larval development in Drosophila melanogaster and its effect on adult weight: An
example of a fitness trade-off. Evolution 50, 1193–1204 (1996).
16. Chippindale, A. K., Alipaz, J. A., Chen, H. & Rose, M. R. Experimental evolution of accelerated development in Drosophila. 1.
Developmental speed and larval survival. Evolution 51, 536–551 (1997).
17. Prasad, N. G., Shakarad, M., Anitha, D., Rajamani, M. & Joshi, A. Correlated responses to selection for faster development and
early reproduction in Drosophila: The evolution of larval traits. Evolution 55, 1363–1372 (2001).
Scientific Reports | (2021) 11:16434 | https://doi.org/10.1038/s41598-021-95951-2 8
Vol:.(1234567890)www.nature.com/scientificreports/
18. Handa, J., Chanderashekhra, K. T., Kashyap, K., Sageena, G. & Shakarad, M. Gender based disruptive selection maintains body
size polymorphism in Drosophila melanogaster. J. Biosci. 39, 609–620 (2014).
19. Robinson, S. J. W. & Partridge, L. Temperature and clinal variation in larval growth efficiency in Drosophila melanogaster. J. Evol.
Biol. 14, 14–21 (2001).
20. Rodrigues, M. A. et al. Drosophila melanogaster larvae make nutritional choices that minimize developmental time. J. Insect Physiol.
81, 69–80 (2015).
21. Klepsatel, P., Procházka, E. & Gáliková, M. Crowding of Drosophila larvae affects lifespan and other life-history traits via reduced
availability of dietary yeast. Exp. Gerontol. 110, 298–308 (2018).
22. Shenoi, V. N., Ali, S. Z. & Prasad, N. G. Evolution of increased adult longevity in Drosophila melanogaster populations selected for
adaptation to larval crowding. J. Evol. Biol. 29, 407–417 (2016).
23. Aguila, J. R., Suszko, J., Gibbs, A. G. & Hoshizaki, D. K. The role of larval fat cells in adult Drosophila melanogaster. J. Exp. Biol.
210, 956–963 (2007).
24. Tu, M. P. & Tatar, M. Juvenile diet restriction and the aging and reproduction of adult Drosophila melanogaster. Aging Cell 2,
327–333 (2003).
25. May, C. M. & Zwaan, B. J. Relating past and present diet to phenotypic and transcriptomic variation in the fruit fly. BMC Genom.
18, 640 (2017).
26. Dmitriew, C. & Rowe, L. The effects of larval nutrition on reproductive performance in a food-limited adult environment. PLoS One
6, e17399 (2011).
27. Grafen, A. On the uses of data on life-time reproductive success. In Reproductive Success (ed. Clutton-Brock, T.) 454–471 (University
of Chicago Press, 1988).
28. Grandison, R. C., Piper, M. D. W. & Partridge, L. Amino-acid imbalance explains extension of lifespan by dietary restriction in
Drosophila. Nature 462, 1061–1064 (2009).
29. Zajitschek, F. et al. Evolution under dietary restriction decouples survival from fecundity in Drosophila melanogaster females. J.
Gerontol. Ser. A Biol. Sci. Med. Sci. 74, 1542–1548 (2019).
30. Morimoto, J. et al. Crowded developmental environment promotes adult sex-specific nutrient consumption in a polyphagous fly.
Front. Zool. 16, 4 (2019).
31. Lushchak, O. V. et al. Larval crowding results in hormesis like effects on longevity in Drosophila: Timing of eclosion as a model.
Biogerontology 20, 191–201 (2019).
32. Colasurdo, N., Gélinas, Y. & Despland, E. Larval nutrition affects life history traits in a capital breeding moth. J. Exp. Biol. 212,
1794–1800 (2009).
33. Monaghan, P. Early growth conditions, phenotypic development and environmental change. Philos. Trans. R. Soc. B Biol. Sci. 363,
1635–1645 (2008).
34. Chandrashekara, K. T. & Shakarad, M. N. Aloe vera or resveratrol supplementation in larval diet delays adult aging in the fruit fly,
Drosophila melanogaster. J. Gerentol. A Biol. Sci. Med. Sci. 66(9), 965–971 (2011).
35. Yamada, T. et al. The role of glycogen in development and adult fitness in Drosophila. Development 146, dev176149 (2019).
36. Yamada, T., Habara, O., Kubo, H. & Nishimura, T. Fat body glycogen serves as a metabolic safeguard for the maintenance of sugar
levels in Drosophila. Development 145, dev158865 (2018).
37. Garrido, D. et al. Fatty acid synthase cooperates with glyoxalase 1 to protect against sugar toxicity. PLOS Genet. 11, e1004995
(2015).
38. Hyun, S. Body size regulation by maturation steroid hormones: A Drosophila perspective. Front. Zool. 15, 44 (2018).
39. Chauhan, N., Shrivastava, N. K., Agrawal, N. & Shakarad, M. N. Wing patterning in faster developing Drosophila is associated
with high ecdysone titer and wingless expression. Mech. Dev. 163, 103626 (2020).
40. Roberts, D. B., Jowett, T., Hughes, J., Smith, D. F. & Glover, D. M. The major serum protein of Drosophila larvae, larval serum
protein 1, is dispensable. Eur. J. Biochem. 195, 195–201 (1991).
41. Churchill, E. R., Dytham, C. & Thom, M. D. F. Differing effects of age and starvation on reproductive performance in Drosophila
melanogaster. Sci. Rep. 9, 4–11 (2019).
42. Lefranc, A. & Bundgaard, J. The influence of male and female body size on copulation duration and fecundity in Drosophila
melanogaster. Hereditas 132, 243–247 (2000).
43. Kwang, P. L. et al. Lifespan and reproduction in Drosophila: New insights from nutritional geometry. Proc. Natl. Acad. Sci. U. S. A.
105, 2498–2503 (2008).
44. Wit, J. et al. Longevity for free? Increased reproduction with limited trade-offs in Drosophila melanogaster selected for increased
life span. Exp. Gerontol. 48, 349–357 (2013).
45. Travers, L. M., Garcia-Gonzalez, F. & Simmons, L. W. Live fast die young life history in females: Evolutionary trade-off between
early life mating and lifespan in female Drosophila melanogaster. Sci. Rep. 5, 1–7 (2015).
46. Boggs, C. L. & Freeman, K. D. Larval food limitation in butterflies: Effects on adult resource allocation and fitness. Oecologia 144,
353–361 (2005).
47. Klepsatel, P., Knoblochová, D., Girish, T. N., Dircksen, H. & Gáliková, M. The influence of developmental diet on reproduction
and metabolism in Drosophila. BMC Evol. Biol. 20, 93 (2020).
48. Rose, M. R. et al. Evolution of late-life mortality in Drosophila melanogaster. Evolution 56, 1982–1991 (2002).
49. Ives, P. T. Further genetic studies of the South Amherst population of Drosophila melanogaster. Evolution 24, 507–518 (1970).
50. Van Handel, E. & Day, J. F. Assay of lipids, glycogen and sugars in individual mosquitoes: correlations with wing length in field-
collected Aedes vexans. J. Am. Mosq. Control Assoc. 4, 549–550 (1988).
51. Smith, P. K. et al. Measurement of protein using bicinchoninic acid. Anal. Biochem. 150, 76–85 (1985).
52. Platt, T. & Irwin, B. Caloric content of phytoplankton. Limnol. Oceanogr. 18, 306–310 (1973).
53. IBM SPSS Statistics for Windows, version 22 (IBM Corp., Armonk, N.Y., USA)
54. Sokal, R. R. & Rohlf, F. J. Biometry: The Principles and Practice of Statistics in Biological Research 3rd edn. (W. H. Freeman and Co.,
1995).
Acknowledgements
Authors are grateful to University of Delhi for infrastructural support in successful completion of this research
work. This research work was supported by Council for Scientific and Industrial Research [CSIR-Grant number:
37(1495/11/EMR-II)]. KS is thankful to Council for Scientific and Industrial Research for funding.
Author contributions
K.S. and M.S. conceived the study, designed the experiments, analyzed the data and interpreted the results;
K.S. performed the experiments and wrote the first draft of the manuscript, and M.S. finalized the manuscript.
Authors’ read and approved the final manuscript.
Scientific Reports | (2021) 11:16434 | https://doi.org/10.1038/s41598-021-95951-2 9
Vol.:(0123456789)www.nature.com/scientificreports/
Competing interests
The authors declare no competing interests.
Additional information
Supplementary Information The online version contains supplementary material available at https://doi.org/
10.1038/s41598-021-95951-2.
Correspondence and requests for materials should be addressed to M.N.S.
Reprints and permissions information is available at www.nature.com/reprints.
Publisher’s note Springer Nature remains neutral with regard to jurisdictional claims in published maps and
institutional affiliations.
Open Access This article is licensed under a Creative Commons Attribution 4.0 International
License, which permits use, sharing, adaptation, distribution and reproduction in any medium or
format, as long as you give appropriate credit to the original author(s) and the source, provide a link to the
Creative Commons licence, and indicate if changes were made. The images or other third party material in this
article are included in the article’s Creative Commons licence, unless indicated otherwise in a credit line to the
material. If material is not included in the article’s Creative Commons licence and your intended use is not
permitted by statutory regulation or exceeds the permitted use, you will need to obtain permission directly from
the copyright holder. To view a copy of this licence, visit http://creativecommons.org/licenses/by/4.0/.
© The Author(s) 2021
Scientific Reports | (2021) 11:16434 | https://doi.org/10.1038/s41598-021-95951-2 10
Vol:.(1234567890)You can also read