Reasonably short introduction to using Linux/Unix and network measurement tools
←
→
Page content transcription
If your browser does not render page correctly, please read the page content below
Reasonably short introduction to using
    Linux/Unix and network measurement tools

           Markus Peuhkuri              D.Sc. Sebastian Sonntag

                                  2021-09-21

Background and motivation - Why Linux/Unix?
It makes very much sense to learn basics how to use Linux/Unix environment.
It’s not hard and won’t take lot of time to learn the basics.
UNIX is a trademark for operating systems. So by itself it’s not operating system
but it is a commercial certification for operating system. This certification is a
promise that that all Unix like operating systems are somewhat similar. Knowing
how one functions makes it very easy to use the other. Linux is free and open
source Unix-variant. It does not have the UNIX certification as the certification
is commercial but environment is similar.
Linux is by far the most used operating system in the world in consumer, network
and IoT devices. Almost all supercomputers and scientific machines use Linux.
Android runs on Linux. And also consider that Apple OS X and iOS are build
with BSD which is UNIX.
Practically almost all network devices run Linux and to be able to change
configurations, seeks solutions for errors, debug or develop new things you will
have to be able to work and have the basic understanding of Unix-environment.
Even if you do web, mobile programming, backend or frontend development it’s
almost impossible to avoid the Unix. Majority of servers at Microsoft Cloud
(Azure) does run Linux. Try to explain that to a timetraveller from late 1990s.
So what does it mean to know how to use the Unix? The most important user
interface is the shell. With shell the user types the commands to execute (run)
application instead of using mouse or touch. It might feel cumbersome at first
time but it’s virtually the only way to do fairly many tasks in computer science,
networks, programming and science in general.
The reason why the shell is so powerful is that you can automate tasks. Some
tasks might be easier to accomplish with graphical user interface first time but
with shell you can very easily replicate and automate the process. With shell
you can make the computer work for you.

                                        1
Figure 1: Example of Unix shell. Apple OS X terminal with bash shell.
Examples here work with reasonable recent Linux system (tested
with Ubuntu 18.04). Older releases and other Unix-like operating
systems may be missing features or have them implemented in a
different way.
Some of this information is specific for Aalto University Linux envi-
ronment, e.g. host names and ways to access.
Basic linux commands (quick guide)
There are few useful commands that you might use often. In this section, we will
briefly describe the following commands: ls, cd, mkdir, less, history, and ↑.
You can display all files in the current directory with ls command. Using
additional parameter ls -l you are also able to see the size of the files and the
file permissions, which could be useful for, e.g., crontab.
You can navigate directories with cd command: cd directory will enter to the
directory and you can come back with cd .. (move to parent directory). One
can use cd or cd ~ to go back to home directory. With mkdir newdir you can
create new subdirectories.
File and directory names in Linux came in to flavors: absolute and relative. If
2the filename starts with /, it is called absolute file name starting from the root
of file system. If it starts with ~/ it refreers to user home directory.1 Any other
character is relative to current directory.
You can use less filename to quickly read the file contents which can be useful
to see how the data structure look like before processing it. You can quit the
window with q after you have learned the contents.
With history command, you will see the previous commands you have used in
the past. This might be useful at the beginning if you forgot how to type certain
commands. Using ↑ (e.g., press the up-arrow in the keypad), you can fill the
command line with the contents of history one by one, which can be efficient to
repeat certain commands.
A philosophy for Unix command line tools is they do one thing, read data from
standard input (stdin) and output results to standard output (stdout). Error
are reported to standard error (stderr). This makes it easy to join commands
with pipe symbol | to get desired result.
For example, one would need commonly e.g. file or directory to store results.
The name should be reasonable unique, self-documenting and easy to sort. The
ISO 8601 date time is a good one, but unfortunately date prints it in extended
format including colons and timestamp information. It may result problems
when transferring files to other systems and to fix it, a common idiom to use
with bash shell would be:
#!/bin/bash
d=$(date -Isec | tr -d : | sed s/+.*//)
mkdir $d
ping -Dn -c 3 www.aalto.fi | fgrep icmp_seq= > $d/ping.txt
# other commands to follow
Of course, you can make a any format string for date: date +%Y-%m-%dT%H%M%S
would provide equivalent result.
Examples: using terminal, creating scripts
Command line and scripts are good tools to automate repeative tasks.
Example: Seek terminal
As desktop nowadays use graphical user interface (gui) thus we need special
application to access the shell. This application is usually named terminal,
console or similar. There are many graphical applications that allows using the
shell. Notice that you can run simultaneously multiple terminals; For example
running some command in one and another command in the next terminal.
1 This is actually a shell expansion and may not be supported within applications.
3Task: Seek application to access the shell.
Example: Starting application from the shell
The main purpose of the shell is to start (execute) applications. Starting
applications behaves exactly same way as when you double click the application
icon on desktop or start the your app from the menu. One benefit with shell is
that you can give parameters when starting the application. Another benefit
is that there is huge amount of applications that do not have graphical user
interface and thus doesn’t make sense to start without shell.
Let’s start by creating a new text file with a graphical text editor. Of course
you can start your favourite text editor from the graphical menus but as we are
learning the shell, let’s see how run it from there.
Type the following command to the shell and press enter (this executes the
command):
gedit
This will execute application named gedit. As you notice, you cannot type new
commands in the terminal as it’s running the gedit. You can run the application
at background by adding & at the end of the command. Background means
that there will be a new process started (forked in computer science slang) for
the application and you can continue using the shell. So let’s execute gedit at
background:
gedit &
In additiong to gedit, there are shell-based text editor which can be more
convenient to use in case of SSH connection or system daemons such as crontab.
The simplest of them is nano that is commonly available. Also vi is another
editor that is commonly available on Unix-like systems. You may want to search
for Vi cheat sheet (ESC q! exits). More advanced editors include Emacs and
Vim.
Yet another option for editing is to use your favourite text editor on your laptop
and use SCP or SFTP to copy files over to the server. When transfering files from
a different system, you may need to make sure lines are terminated correctly.
Most progammer’s editors allows you to select the right newline format.
Example: Creating Python program and executing it
Let’s demonstrate how to run Python programs via terminal. Open the terminal
and type the following command to create new Python file
gedit helloworld.py
Add the following contents for the program (notice that in Python, the indenta-
tion matters) and save the file:
4def main():
print("Hello world")
main()
Now you can run such program by typing in the terminal, and you will see the
output of the program.
python3 helloworld.py
Example: Creating R program and executing it, and li-
braries
R has its own IDE called Rstudio but in case you prefer using shell instead, we
will now demonstrate it here too. Type the following command to create new R
file to write contents.
gedit helloworld.r
Add the following contents for the program and save the file:
maindate
ping -c 1 google.fi
The file we made is called shell script. It can be executed in the shell. The shell
will run this file line by line. The first line defines this must be run with shell
/bin/bash, this is essential to be at the beginning. The rest hashtags will be
understood as comments. The echo prints what has been written after that,
in this case “Starting new session”. Command date prints current date and
time. Last line uses ping command (ICMP protocol) to measure round trip to
given server, here google.fi. The parameter -c 1 tells to send only one message.
Without -c 1 the ping would send packets indefinitely on one second interval.
Save this to your home directory and name it as run.sh.
In Unix, the file extension (.sh here) does not make scripts executable as they
do in Windows (.BAT). We have to make the file executable. You can tell the
system that this file can be executed with changing the permissions. Let’s make
the file executable using the following command:
chmod +x run.sh
Unix systems identify scripts based on #! character pair as start of file. It is
followed by path to the wanted interpreter, bash in this case. And now you can
run it:
./run.sh
This should print something like this (if not, call for help):
Starting new session
Tue Sep 12 15:19:56 EEST 2017
PING google.fi (216.58.201.163) 56(84) bytes of data.
64 bytes from arn02s06-in-f163.1e100.net (216.58.201.163): icmp_seq=1 ttl=56 time=7.50 ms
--- google.fi ping statistics ---
1 packets transmitted, 1 received, 0% packet loss, time 0ms
rtt min/avg/max/mdev = 7.509/7.509/7.509/0.000 ms
Congratulations! This is very handy skill you have acquired. Life will be easier
now on. With such script files, you can automate all your needs (see the next
example).
ps Seems like the round trip time (time to the packet to go to google.fi
and one to come back) is 7.5 ms. It’s okayish.
Example: Run script every 10 minutes
The next and final step here is that our computer will run this script for us time
to time automatically.
Many Linux setups have daemon called cron installed (daemon is yet again
computer slang, it means application that is meant to be run at the background
6all the time, usually started during boot time). With cron you set computer to
run you shell command frequently. Let’s see how it’s done.
Adding tasks for cron requires using command crontab (it’s an application too).
Unfortunately the setup is bit strange because crontab requires using text editor
in a way that crontab starts default editor defined by environment with crontab
user permission. Don’t worry if you didn’t get it all, it’s tricky. Fortunately it’s
still easy to do:
export EDITOR=nano
crontab -e
The first line: export EDITOR=nano sets default editor in your shell (until you
close it) to nano. The second command runs crontab with parameter -e telling
that we want to edit the configuration.
Now you should have text editor open in your shell. It’s not graphical editor as
we have been using earlier but it’s still easy to use.
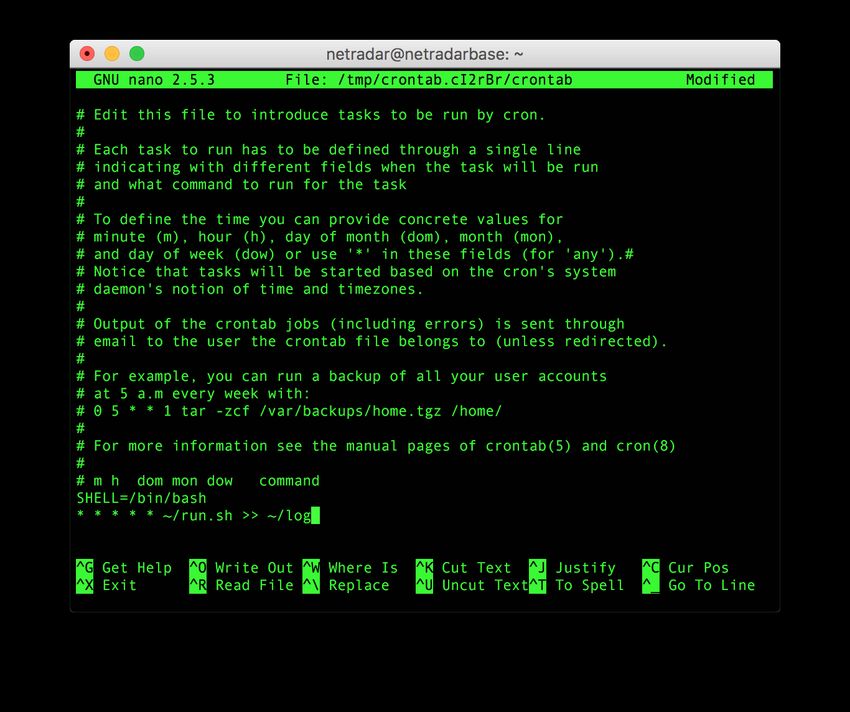
Figure 2: Text editor nano open in shell. Editing crontab through command
crontab -e.
There might be lines starting with # (hashtag), they are comments and will not
7be inspected nor executed. Add the following text to the editor. Be careful that
you type it correctly.
SHELL=/bin/bash
* * * * * ~/run.sh >> ~/log 2>&1
After you have typed it in, save it by pressing CTRL-x (first press CTRL button
down and keep it down, then press x and lift your fingers) to exit nano editor.
The editor will ask you if you want to save the file. Press Y for yes, and then
press Enter to confirm filename. If everything went correctly you should be back
in the shell with message “Crontab installed” or similar. If not, try the steps
again and/or call for help.
Regarding the things we just wrote, first line defines that the cron jobs (command
you wish to run) will run shell called bash. Bash is one the most used shell
environment, however many other shells exists.
The interesting line here is the second line we wrote:
* * * * * ~/run.sh >> ~/log 2>&1
This line consist of two parts: execution time and the command.
The first 5 stars defines the execution time and the text ~/run.sh >> ~/log is
the command to be run. This sets the command to execute the run.sh script
every minute, every hour, every month, every weekday. The output of the script
will be appended to the log file.
The execution time is defined like this:
* * * * * command to be executed
- - - - -
| | | | |
| | | | +----- day of week (0 - 6) (Sunday=0)
| | | +------- month (1 - 12)
| | +--------- day of month (1 - 31)
| +----------- hour (0 - 23)
+------------- min (0 - 59)
Let’s analyze few examples regarding this. With the following line, this would
execute the script 12:00 o‘clock, every day, every month, but only Mondays
(1=Monday):
0 12 * * 1 ~/run.sh >> ~/log 2>&1
With the following line, this would execute the script when minutes at the
computer clock is 10, every day, every month, every week day. So once per hour,
10 minutes past. Effectively 24 times per day.
10 * * * * ~/run.sh >> ~/log 2>&1
If you want to execute the script every 10 minutes, use the following command:
8*/10 * * * * ~/run.sh >> ~/log 2>&1
The command part defines script to be executed. The cron does not know which
directory you have the script run.sh, thus you have to define the path to the
script. Bash shell have handy shortcut for your home directory, that is ~/. We
stored run.sh in your home directory, thus the file is located ~/run.sh. (You
can check your current directory with command pwd).
The >> ~/log 2>&1 is very handy part. It will take the output from run.sh
and store it to ~/log. This will create a new file under your home directory if
the log does not exists, and append the output every time the run.sh is executed
by the command.
The redirection comes in few flavours: > creates each time a new file while
>>appends to a file (and creates file if it does not exits. The 2>&1 redirects
standard error (filehandle number 2) to the standard output (filehandle number
1). The order of redirect operations matters: if the order is 2>&1 >> log.txt
then the error and diagnostic messages are printed into terminal and not to the
a file.
Okay, now everything should be in place. Let’s check what we have in the log
(if one minute has passed since you stored the crontab with * * * * *).
less log
There should be something like this:
Wed Sep 13 10:54:08 EEST 2017
PING google.fi (172.217.18.131) 56(84) bytes of data.
64 bytes from arn02s05-in-f3.1e100.net (172.217.18.131): icmp\_seq=1 ttl=57 time=6.62 ms
--- google.fi ping statistics ---
1 packets transmitted, 1 received, 0% packet loss, time 0ms
rtt min/avg/max/mdev = 6.620/6.620/6.620/0.000 ms
Now you have script that is run time to time and the output is stored to a log.
Tip: there is a website https://crontab.guru/ where you can test the
crontab syntax if still unsure.
Last, final and the most important tip. There are three main sources of informa-
tion.
1. Program manual pages installed on system you are using. There are tens
if not more variations of ping command for example. There are different
options available in different versions and behaviour may differ. Manual
pages are views with man command, like man ping. Many programs also
provide short a help if run with --help option.
Note that some commands are shell build-in or aliases so there may not
match for the one manual page describes. You can check for example which
echo command is executed in bash: type -a echo. If the command is
shell build-in, you need to check shell manual for usage details.
92. Programming language and library documentation for python and R.
3. Use Google (or search engine of your choice). We do it all the time. No-one
knows all the commands, parameters and applications, so search for them.
Web search what you want to do (for example “crontab run every hour”)
or how to do it (for example: “bash show my home directory” or “shell
send email”In the following command, we are able to access school’s brute server remotely.
There are also other servers available, such as kosh, lyta, and force. These
servers are usually online 24/7. Especially brute and force servers were imple-
mented for heavy computational purposes, so you are allowed to run scripts all
day using them (note: only for educational purposes, bitcoin mining etc. will
not be allowed).
Also classroom Linux computers can be accessed via ssh but not directly from out-
side of campus. One need to first log in to above servers via ssh or use the Virtual
Desktop connection and from there log in to e.g. cavalieri.org.aalto.fi.
This can be especially useful if you would not rather keep your personal device
turned on all time. The -X parameter ensures that you are able to run remotely
some applications, such as Matlab or gedit (even if you don’t have installed
them on your personal device). Replace AALTO_USERNAME part with your aalto
username like students3.
ssh -X AALTO_USERNAME@brute.aalto.fi
Terminal will prompt you to feed it password. After feeding the password, you
are able to navigate your school directory just as you were locally there. When
you are done, just close the terminal window or use the command
exit
If you want to avoid typing your password every time, you can use public key
based authentication. Search you favourite search engine for “setup ssh keys”.
Note that many instructions show how to generate RSA keys while now is
recommended to use ED25519 keys. Note that the private key allows access to
your account so protect it with passphrase.
One drawback of using ssh key authentication is that access to /work/courses
directory requires kerberos ticket. This is only received when login happens with
password authentication. If you have trouble accessing course directory, check
with klist command if you have valid ticket. If there is no valid tickets (or
No credentials cache found), you can run kinit command. It will ask for your
password.
Network measurement
Example: Delay measurements with ping
One of first tools to check network characteristics is to use ping command that is
available practically every system. It utilises ICMP protocol that is a mandatory
part of IP standard, i.e. every host must reply to ICMP Echo Request with
ICMP Echo Response. Not all do, but more about that later.
ping www.aalto.fi
11would first resolve IP address of www.aalto.fi using DNS and then it will
start sending ICMP Echo Requests one second intervals. It will print out when
it receives an response. You can stop it by pressing Ctrl-C and it will print
summary statistics. You can also define number of requests sent with -c option
which is useful for scripted traffic. In Windows the default is to send 4 requests
and stop.
Example: Throughput measurement with iperf
Iperf is a simple and easy to use tool for measuring network capacity. The same
program can be run as a server (-s) or as a client (-c host.example.com). It
requires that server is run at the other end.
There are two versions available that are incompatible with each other. The
version 3 iperf3 has more reliable end-to-end control but unfortunately a single
server cannot run multiple clients simultaneously. This is a design choice.
Both versions provide machine-readable reports, version 2 as CSV and 3 as
JSON. By default the client is sending data but this can be changed with -R
option.
iperf3 -c iperf.funet.fi
Example: Internet packet capturing with tcpdump
In many cases it is important to know traffic in network. For this we would need
a program to capture packets from the network. In this area, the best tools are
freely available.
Traffic capture is a privileged operation and typically requires superuser rights
(or capability for capture) as it makes easy to eavesdrop other users. It is not
allowed in Aalto server or classroom computers for normal users. You need
to use your own computer; in case you do now have one, contact course staff.
Reading pre-recorded packets is not privileged operation.
Table 1: Selection of the most popular tools to capture and analyse
network traffic
Software GUI/CLI Description
Wireshark GUI Most popular graphical tool to analyze and study
packet captures. Can also perform packet capture.
Tshark CLI Cli version of above. Can be used to perform same
analysis on command line. Can also perform packet
capture.
dumpcap CLI Command line tool capture packets. Part of
wireshark / tshark suite (included in
wireshark-common package on Ubuntu)
tcpdump CLI Classical packet capture and display tool
12Software GUI/CLI Description
tcpslice CLI Combine multiple PCAP files and slice requested
time period to new file.
The Wireshark is available for both Linux and Windows and as a GUI program,
it is also reasonable easy to use. However, it is not a good tool to capture traffic
from the network if there is significant amount of traffic (tens of megabits
per second). Wireshark package includes dumpcap program that is a CLI
program for packet capture. If capture file is very large, it is slow to process
with Wireshark.
Program tcpdump is available in most Linux distros without much dependencies,
which makes it good alternative. It is very good for quick networking debug but
can also sustain reasonable continuous traffic capture by rotating output files
like dumpcap. Tcpdump only processes small amount of packets at the same
time so it can process large capture files too large to fit into memory.
The tshark is something between wireshark and tcpdump. It is quite good tool
to extract certain fields from the packet making postprocessing easier comparing
to matching fields from tcpdump textual output.
When capturing packets, you need to determine which network interface will
be used for packet sniffing. You can see the list of available interfaces with, for
example, ip link command.3
The following command captures all packets in non-promiscuous mode except ip
broadcast or ip multicast packets that go through interface eno1. Filtering ip
broadcast and ip multicast can be good for traffic labeling purposes. The output
will be saved to my_packets.pcap file.
tcpdump -i eno1 -p -w my_packets.pcap ip and not ip broadcast and not ip multicast
By default tcpdump sets interface to promiscuous mode where it captures also
packets not destined to the host. Using -p option (or --no-promiscuous-mode)
disables this behaviour but is not a shorthand for filtering broadcast.
Now your device will constantly capture packets continuously. After you are
done with capturing, just CTRL+C. As an alternative, you could use option -c
1000 to capture thousand packets.
IP packets consist of two parts: headers and payload. For many types of
analysis, capturing only IP and TCP or UDP headers is sufficient but on other
hand when the analysis is utilizing the payloads then the full packet capture is
mandatory. Full packet captures requires faster and larger storage and more
complex algorithms to analyze the data within data payloads.
3 On linux environment the ifconfig is deprecated but is used in various BSD systems.
13It is possible to specify desired capture length size using -s option in tcpdump,
tshark and dumpcap. Value 0 corresponds maximum length supported by
network device where 64 or 96 bytes can be considered as acceptable sizes for
most of the analysis on network and transport protocols. Full packet capture is
needed if application protocol decoding is desired.
The captured .pcap file will be in binary format so reading it with usual text
tools (less or editor) will not be viable. To read .pcap file contents, you could
use the following command.
tcpdump -n -r my_packets.pcap
The -n option disables resolving host names. Often you are not interested about
those and resolving will just slow things down.
It is also possible to filter the readable contents. This could be useful to check
if the packet doesn’t really contain some type of packets. For example, the
following command prints only ip broadcast packets (which should be nothing
in this case):
tcpdump -nr my_packets.pcap "ip broadcast"
Example: Interactive analysis of captured traffic
When traffic has been captured, it is usually a good idea to have brief look on
it to check if it is correctly captured and if there are any interesting features.
This can be also done with packet capturing software which are able to read the
captured files (usually with -r option) and then perform some filtering to get
relevant fields out.
The Wireshark is the most widely used tool for this purpose. Wireshark has
a good documentation including many video tutorials and forums which can
assist you to master this tool. Wireshark does not have a good performance
in handling larger capture files. You can use tcpslice to extract only part of
capture file.
Command line based tools like tshark and tcpdump are also suitable for
analysis and more often if you already know what to do and want to produce
data file from network trace to complement analysis. With tcpdump you need
to parse textual file to identify the right fields while tshark can be configured to
print only desired fields.
Following tshark command outputs for each packet time it was received (seconds
since 1st Jan 1970 00:00 UTC), IP addresses and IP packet length in tab separated
fields:
tshark -r capture.pcap -T fields -e frame.time_epoch -e ip.addr -e ip.len
Command line based tools are also useful making quick diagnostic analysis.
Often a communication problem can be identified by a tcpdump with proper
14filter. The following command will output SIP signaling (port 5060) with payload from eth1 interface and quiting after 10 received packets. tcpdump -i eth1 -A -c 10 port 5060 If you have large dump file that is slow to process with Wireshark, you can also use tcpdump to include or filter out some traffic. To exclude any iperf3 traffic with default port, you can run. tcpdump -r capture.pcap -w not-iperf.pcap not tcp port 5201 In order to extract flow level information from .pcap files, you could utilize CoralReef or NetMate software. More about them later as the course goes on. Data processing Example: how to parse log with Python Here’s very simple and ugly Python script to parse our log file and output CSV file. Use it like this $ python3 parse.py log > results.csv. This python program will output new file in .csv format. You can use this result file in Excel, Google Spreadsheet or R. #!/usr/bin/python3 import sys if (len(sys.argv)
# timestamp and remove everything else
     part=line.split("=")
     latency=part[-1].split(" ")[0]
     print(latency+",",end="")
     # Split the line to seek the host name
     part=line.split(" ")
     host=part[3]
     print(host)

  # print datetime for each line
    # note this is date-sensivite!
  if "2019" in line:
    print(line.strip()+",",end="")
Note that the script works for the output that the script run.sh produces, feel
free to edit the Python code to match your objects.

Example: Making time calculations easy
Many tools print dates and times using user friendly format like Wed Sep 4
15:25:51 EEST 2019 or 15:20:51 by default. This is all fine as long as you do
not try to make computation based on input. You would need to use some
date-parsing library (or roll your own) to make calculations e.g. to compute time
differences.
However, operating systems internally keep time just by counting seconds from
a set date (epoch) and user application then converts it to right presentation
taking account e.g. time zones and daylight savings. Unix-like systems use epoch
that is 1970-01-01 00:00:00 UTC.
This makes it easy to compute that 1567599951 is exactly 12351 seconds since
noon (Finnish time 2019-09-04T12:00 having time value 1567587600). Note that
timestamp does not include any timezone information; the latter timestamp
value above is 2019-09-04T09:00:00 UTC. This time does not account for leap
seconds so care must be taken around end of December and June in some years.
Many applications can be made to print in timestamp values:
   • date: use format string +%s to print timestamp value.
   • ping: using -D option it prefixes output with timestamp of received packet.
     Also -O option is helpful as you will receive information from packets not
     received reply.
   • tcpdump: use option -tt.
   • tshark: option and argument -t e. The default setting -t r prints times
     in seconds relative to the first packet that may be easy in some cases.
The above run.sh could be rewritten thus
#!/bin/bash

                                       16
echo Start $(date +%s) $(date)
ping -DnO -c 3 ${1:-www.aalto.fi}
and parse script would be then a bit simpler if using regular expressions in
addition.
#!/usr/bin/env python3
import sys
import re
if (len(sys.argv)> $DATA/ayy.log 2>&1
*/10 * * * * $DATA/run-ts.sh www.aalto.fi >> $DATA/aalto.log 2>&1
17provided that you stored the script in elec-e7130 directory in your home directory. Example: Structured data In addition to line based output or CSV files, some tools provide data in other formats too. One such format is JSON (JavaScript Object Notation). Libraries to process JSON files are readily available for python (json) and R (rjson) among others. A command line tool jq can be used to manipulate JSON data and print only selected fields, for example. The iperf3 tool provides output in json format if run with -J (--json) option. iperf3 -c sgi.iperf.comnet-student.eu -J --logfile sgi/$(date +%s) That will run iperf3 against host sgi.iperf.comnet-student.eu and store information in JSON format to sgi directory into file named current timevalue. Following python program reads one or more files and prints tab separated start time and TCP throughput for each. You could run it for example as ./iperf-result.py sgi/* > sgi-iperf.csv. #!/usr/bin/env python3 import sys import json if (len(sys.argv)
• map(func, ...) to process all entries in array, in this case convert to
    strings

Example: Concurrent processing
There are cases where you would like to perform multiple operations at the
same time. For example, you would like to run ping and iperf3 at the same
time to get individual delay and loss measurements from ping and then measure
throughput with iperf. Luckily, Unix shell makes this easy.
#!/bin/bash
# takes two optional arguments:
# - hostname of iperf server (defaults iperf.funet.fi)
# - seconds to run test for (defaults 10 seconds)

host=${1:-iperf.funet.fi}
secs=${2:-10}
d=$(date -Isec | tr -d : | sed s/+.*//)
mkdir $d
ping -c $(($secs + 2)) $host > $d/ping-$host.txt &
iperf3 -c $host -t $secs -J > $d/iperf3-$host.json
wait
We earlier started gedit in background with ampersand (&) character. Here
we launch ping in backgroud. As ping sends one request per second, we derive
using Stetson-Harrison method we need to send two more requests than there
are seconds in test. Bash supports integer operations with $((1 + 2)) syntax.
Both programs have their standard output directed to individual files (that
includes name of target host as $host is embedded into name). Otherwise their
output could be mixed making it difficult if not impossible to parse.
As the hostname is embeded into file, we can easily separate results for different
tests. For example to collect all iperf results for host example.com we would
run simply:
./iperf-result.py */iperf3-example.com.json > iperf3-examplecom.csv
Although Stetson-Harrison method is widely used and approved, hard-coded
wait times suffer from a problem that if they are too short, they fail to work in
all cases and if they are conservatively set too long, they just cause unnecessary
delays. Would there be an alternative for that?
Consider following modification of script above:
#!/bin/bash
# takes two optional arguments:
# - hostname of iperf server (defaults iperf.funet.fi)
# - seconds to run test for (defaults 10 seconds)

                                       19
host=${1:-iperf.funet.fi}
secs=${2:-10}
d=$(date -Isec | tr -d : | sed s/+.*//)
mkdir $d
ping -c $(($secs * 2)) $host > $d/ping-$host.txt &
pingpid=$!
iperf3 -c $host -t $secs -J > $d/iperf3-$host.json
kill -INT $pingpid
wait
If we compare those scripts, there are three modifications:
• We (plan to) send now double the number pings than there are seconds.
• We will store process ID (PID) of ping into variable pingpid.
• After iperf3 has completed, we will send SIGINT signal to the ping process.
This is equavalent to press Ctrl-C if the program is run foreground.
Strictly speaking, setting number of pings is not needed but it is just for to make
sure there is not ever-going ping process in case there is some issue with rest of
script.
Using signals we were able to synchronise two process to end around the same
time.
What about the wait on the last line? It waits for all background processes
to terminate before continuing. It is not strictly needed in this case as the
operating system takes care of orphans but may be useful feature in more
complex scripts. It can also wait for some specific background processes; in this
case wait $pingpid would have worked identically.
Example: more pipelines
Unix tools are good to process line-oriented data in pipelines. The most important
are described below. For any of these uses it would be possible to make a python
program, for example, but it is usually much faster know these tools for quick
processing and filtering. These also can have much better performance for their
specific task.
Grep and tr
grep prints lines matching to regular expression. You can invert match with -v
option. It has also variations fgrep matching to fixed string and egrep using
extended regular expression.
Following would print lines that have any count of numbers (including none) in
the beginning of line followed by colon.
grep '^[0-9]*:' file
20tr replaces or removes characters from the input. To replace lower-case characters
with their upper-case equivalents and remove anything not a character, number
or newline:
tr a-z A-Z < file | tr -cd '0-9A-Z\n'
Sed, AWK and cut
Stream EDitor (sed) also reads lines from input (stdin or file). It is more complex
but typical usage is e.g. remove whitespace. Following script first removes possible
spaces at the beginning of lines and then deletes any lines that have - as the
first character.
sed 's/^ *//;/^-/d' file
Sed also makes in-place editing for files if supplied with -i option.
A bit more powerful tool is AWK that is also line-based but allows more complex
programs. A typical use-case would be to read white-space separated input and
print selected fields:
awk '/^[0-9]*:/{print $1, $4}' file
An alternative for above script (if file is tab-separated) would be:
grep '^[0-9]*:' file | cut -f 1,4
Another AWK use case would be computing quick statistics from a file. Let’s
assume we have a file with an sender IP address in first column, number of
packets in 3rd and number of bytes in 4th. We want to calculate the how many
packets and bytes are sent by each IP address. Lines including # should be
ignored
awk '/#/{next}{p[$1]+=$3;b[$1]+=$4}END{for(h in p)print h, p[h], b[h]}' file
Sort, head, tail and xargs
Let’s say that above awk output has been stored into sent.txt file. Now we
like to test it the 5 top senders by bytes are reachable right now.
sort -nr -k 3 sent.txt | head -5 | cut -f 1 -d ' ' | xargs -n1 ping -c 3
First we sort lines into reverse (-r) numerical (-n) order, i.e. the top sender is
at the first line. Then we select first five lines from head, and extract the first
column. The file is space separated so we need to tell cut to use space as field
separator.
By default, xargs will just read its input, separate by whitespace (newlines,
tabs, spaces) and put so many arguments as the operating system allows to the
program specified on command line. It will run sufficient number of times to get
all input consumed. If there is no input, it will run the command once, unless
-r option is specified.
21As the ping will only take one host as an argument, we tell xargs to supply only argument each time -n1. If we would be in hurry, we would have given also -P0 argument to xargs telling it to run all pings at parallel. As a result, we would have received output that has everything interleaved. And what is tail? It is quite opposite to head and bit more. If there are say 3 header lines in a file you want to ignore, you can run tail -n +4 file to output lines from 4th line to end. Another useful option is -f (and -F) that will monitor e.g. log file and output what is written to it. Example: Random stuff At times there is a need for some randomness because that is where computers are bad. Like you want to avoid synchronisation of events or for some other variable needs to be different in different runs. There is specific variable in bash, RANDOM that will return each time different value between and including 0 and 65535. A typical case would be that you want to wait a random time between 1 and 2 minutes. This can be done following: sleep $((60 + $RANDOM % 61)) Strictly speaking, values given by that formula are not evenly distributed but for most purposes they are just fine. Another random tool is shuf that reads lines from stdin or file and prints them out in random order. It also can print range of integers, so seq 10 20 | shuf and shuf -i 10-20 are more or less equivalent. In python there is a random library that provides many utility functions. Usefull ones include: • randrange(start, stop) that will return integer N that is start
The command time provides a summary of time used in wall clock time and in
CPU time.
time heavy-prosessing -a large.file
Again, the time command exists both shell buildin and external command that
differ significantly even in default output.

More to read
  • Shell basic commands from Aalto Linux course

                                    23
You can also read