Show Me What You're Looking For: Visualizing Abstracted Transformer Attention for Enhancing Their Local Interpretability on Time Series Data
←
→
Page content transcription
If your browser does not render page correctly, please read the page content below
Show Me What You’re Looking For: Visualizing Abstracted Transformer
       Attention for Enhancing Their Local Interpretability on Time Series Data

                                         Leonid Schwenke and Martin Atzmueller
                                          Osnabrück University, Institute of Computer Science
                                                 Semantic Information Systems Group
                                                         Osnabrück, Germany

                            Abstract                                   Objectives. We aim to enhance the understanding and vi-
                                                                       sualization of attention on time series data. For tackling the
     While Transformers have shown their advantages con-
                                                                       problem described above, we make use of two main ideas:
     sidering their learning performance, their lack of ex-
     plainability and interpretability is still a major problem.       1. In data preprocessing we transform the time series data
     This specifically relates to the processing of time se-              into symbols using Symbolic Aggregate Approximation
     ries, as a specific form of complex data. In this paper,             (SAX) (Lin et al. 2003; 2007), which is often better suited
     we propose an approach for visualizing abstracted in-                for human interpretation, e. g., (Atzmueller et al. 2017).
     formation in order to enable computational sensemak-              2. We exploit Transformer attention for data abstraction,
     ing and local interpretability on the respective Trans-              leading to data indication and according visualization.
     former model. Our results demonstrate the efficacy of             Thus, our general objective is to increase the understandabil-
     the proposed abstraction method and visualization, uti-           ity of Transformers’ MHA, in particular in the context of
     lizing both synthetic and real world data for evaluation.
                                                                       time series data for which to our knowledge very few works
                                                                       have been published. In order to increase the interpretability
                        Introduction                                   and for helping humans to understand the learned problem
Deep Learning approaches are becoming pervasive with                   better, we abstract the input data via attention and the SAX
their recent advances on handling complex data. One re-                algorithm. The results are fewer indicative data points in the
cently emerging architecture is given by Transformers,                 time series. This abstract view can afterwards help humans
cf. (Vaswani et al. 2017), as a prominent approach for pro-            to see and comprehend more easily on which indicative data
cessing sequential data. For example, BERT (Devlin et al.              points the neural network’s main decisions are based on.
2018) is one of many successful state-of-the-art uses of               In addition, with fewer data points and a good performing
Transformers in the context of natural language processing             model this can be an important medium for a human in or-
(NLP). While Transformers are still mostly used in NLP,                der to comprehend the general problem setting more easily.
more recent research applies them successfully to image
processing (Dosovitskiy et al. 2020) as well as time series            Contributions. Our contributions are given as follows:
prediction (Li et al. 2019). The latter is also the context            1. We propose a semi-automatic approach for abstracting
which we will consider in this paper, specifically relating to            time series data using attention and symbolic abstraction
the important concept of attention which is central to Trans-             (using SAX) in order to enhance local interpretability.
formers, i. e., focussing on specific subsets of the data that         2. We present according visualizations, also for supporting
are relevant to the task at hand (Vaswani et al. 2017).                   the human-in-the-loop in the semi-automatic process.
                                                                       3. We demonstrate the efficacy of the proposed approach in
Problem. In this paper, we focus on the general problem                   an evaluation using synthetic as well as real-world data.
of computational sensemaking, e. g., (Atzmueller 2018) of                 Our experimentation indicates both the effectiveness of
Transformers on complex time series data. In particular, we               the abstracted representation using indicative data points,
focus on local interpretability considering abstracted time               as well as visualization examples indicating the inter-
series sequences using attention of the Transformer which                 pretability of the abstraction.
can indicate interesting data points/patterns leading to a lo-
cal classification (decision). In general, this is a difficult
problem; so far, for Transformers, the interpretation of the           Outline. The rest of the paper is structured as follows: We
underlying attention mechanism, in particular when using               first discuss related work, before we present our proposed
Multi-Headed Attention (MHA), is still not fully understood            method, including preprocessing, architecture, symbolic ab-
nor explainable and only seen as partially transparent (Jain           straction and result interpretation. After that, we present and
and Wallace 2019; Baan et al. 2019; Clark et al. 2019).                discuss our results in detail using one synthetic and one real-
                                                                       world dataset. Finally, we conclude the paper with a sum-
Copyright © 2021by the authors. All rights reserved.                   mary and outline interesting directions for future work.

         Preprint of: Leonid Schwenke and Martin Atzmueller (2021) Show Me What You’re Looking For:
         Visualizing Abstracted Transformer Attention for Enhancing Their Local Interpretability on
         Time Series Data. Proc. 34th International FLAIRS Conference, North Miami Beach, FL, USA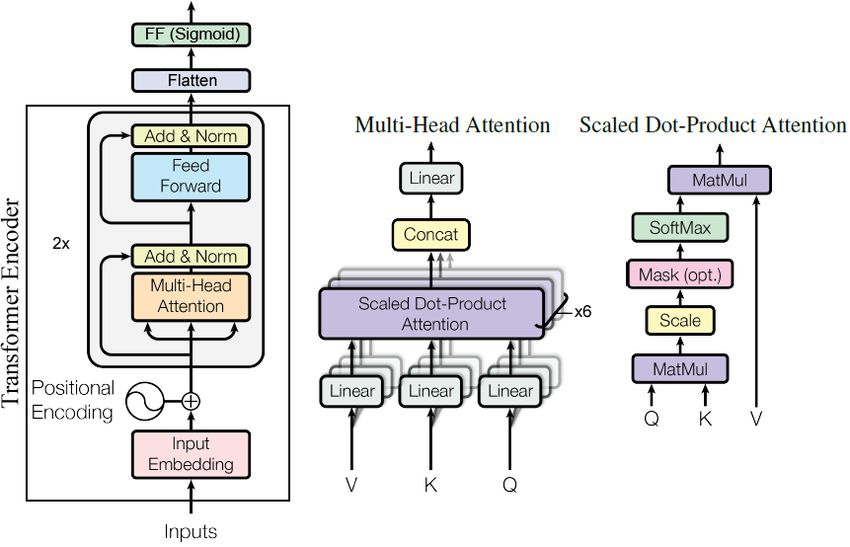
Related Work                                                                 Methods
In the following, we outline related work regarding Trans-        Process Model. Figure 1 depicts our proposed process.
formers, and visualization options for making them more           First, the data is preprocessed (scaling, SAX). After that,
understandable, as well as on symbolic abstraction.               a Transformer model is trained. Next, the attention is ap-
   Transformers have emerged as a prominent Deep Learn-           plied for data abstraction and indication as described below.
ing architecture for handling sequential data (Vaswani et al.     The data can now be visualized in order to enhance human
2017), e. g., for NLP. Transformers have also recently started    understandability. Furthermore, in order to validate the data
to be successfully applied to time series problems (Lim et        and to show that the abstracted information is relevant, we
al. 2019), also addressing efficient architectures (Tay et al.    train a new transformer model for validation. In a human-in-
2020) and approaches (Li et al. 2019) for increasing the per-     the-loop approach, this model is ultimately applied to refine
formance of transformers on time series prediction. Ram-          the thresholds of the abstraction method for fine-tuning.
sauer et al. analyzed the pattern filter ability of Transform-
ers. They show that the first Transformer layers perform a
more generic preprocessing. In contrast, the later layers are        Standardize       Apply SAX +                           Abstraction using
                                                                                                          Train Model
the ones still trained at the end while containing more class           Data            Mapping                                  Attention

specific filtering. They reasoned that the MHA is encoding
and storing multiple patterns for the classification. In this           Train Validation Model                                Abstracted Data
work, we build on this principle in order to provide such
summarized patterns of interest. It is important to note, that
the given limitations of transformers are currently a rather                                     Create Visualisations

strong research topic in general; recently many slightly mod-
ified Transformer architecture arose which take on different           Local Visualisation                               Other Visualisations
limitations of the original Transformer (Tay et al. 2020). In
comparison to those approaches, we focus on the specific
problem of time series classification, also considering the       Figure 1: Pipeline of the data processing, from preprocessing
MHA in its original form, to create a first baseline. There-      the data to abstraction, validation and visualization.
fore we also do not focus on scalability/runtime.
   Regarding Analysis and Sensemaking of Attention,                  It is important to note that we actually apply two data ab-
most of the methods for MHA analysis and visualisation –          straction steps: (1) We apply SAX to transform continuous
in order to increase their understandability – are found in the   time series values to symbols (“symbolification” – cf. Fig-
context of Image Processing (Dosovitskiy et al. 2020) and         ure 2). This already reduces the complexity for better human
NLP (Vig 2019), where the input is already rather accessi-        accessibility of the data. (2) We apply data abstraction using
ble for humans. Attention itself was already previously used      attention (indicating interesting data points) – see below.
on time series data with RNNs. Serrano and Smith found
                                                                       ts
though, that the interpretability properties only works sub-
optimal compared to other techniques. However, they did                                                                                          c
not look into the attention of Transformers itself; we tackle                                                            c                c
                                                                                                                  b               b
this – with a refined approach – in this paper.                                    b                  b
   Also, Baan et al. showed that MHA is at least partly inter-                                                                                   b
                                                                                             a
pretable even though multiple heads can be pruned without
reducing the accuracy (Pruthi et al. 2019). Therefore, MHA
can be used for transparent interpretations under certain con-
                                                                                                                                                 a
ditions and with specific methods. Hence, we extend on this
to gain a better understanding of MHA with time series data
– this is also why we decided to analyze the MHA in its orig-     Figure 2: SAX discretization, cf. (Atzmueller et al.time
                                                                                                                         2017):
inal form. In addition, Wang, Liu, and Song demonstrated          Each data point is mapped to a discrete symbol (a, b, c), e. g.,
that it is possible to reduce words from sentences via MHA,       using the quantiles from the standard normal distribution.
also showing that attention can abstract important key co-
herences, while inputs with lower attention can be neglected
for the purpose of interpretability. We adapt this important      Transformer Architecture: In its original form (Vaswani
finding for our approach in time series abstraction.              et al. 2017), it consists of an encoder and decoder, but for
   Symbolic Abstraction – SAX is one prominent example            classification problems only the encoder is used. At its core
of an aggregation and abstraction technique in the area of        is the MHA which uses so called self attention to learn
time series analysis, (Lin et al. 2003; 2007); it results in a    important points to focus on. This self attention comprises
high-level representation of time series. A key feature of the    an attention matrix, which highlights relations between el-
technique is its symbolic representation by discretizing time     ements of the inputs. This matrix is calculated and applied
series into symbolic strings (cf. Figure 2). To the best of the   inside the scaled dot product with itself for all inputs (i. e.,
authors’ knowledge, this is the first time that applying SAX      V , K, and Q in Figure 3). Figure 3 shows an example of a
in combination with Transformers has been proposed.               Transformer encoder corresponding to our applied model.
Figure 3: Our applied architecture including the Transformer encoder, adapted from the architecture in (Vaswani et al. 2017).
Abstraction using Attention This main data abstraction tively high attention score s. Every data point with atten-
step utilizes attention for simplifying the data points within tion s > t1 is projected directly into our abstraction.
the time series. To merge the attention information from 2. The second group of data contains data points with a
MHA and to reduce the problem of unimportant heads – as medium-strong attention score s, i. e., with t2 < s < t1 .
discussed by Baan et al. – we simplify all attention matri- With this, we include partial information into our abstrac-
ces into one. Wang, Liu, and Song preferred the average of tion. For every directly subsequent sequence of according
the attention in the last heads, because the meaning of words medium-strongly attended data points, we take the me-
(for NLP) was mostly found in the last layers. We on the dian of the sequence for our abstraction.
other hand want to rather visualize what MHA is seeing in 3. The remaining group of data points with low attention is
our time series in general. Therefore, we aim to show the removed, because they are considered as unimportant.
combination of the strongest highlighted features. Because those thresholds always depend on the problem, we
For this reason and further to be able to apply our reduced propose a human-in-the-loop procedure to optimize t1 and
matrix to a one dimension sequence, we calculate the ab- t2 in order to fine-tune the abstraction and interpretability.
stract matrix Am , by averaging over all layers and summing
the maximum of each attention column of all average heads:
Pm Pn Abstraction Validation For interpreting a model, often a
Am = j=1 maxc ( n1 i=1 hji ) where n is the number of subset of data extracted from the original model is used (Mu-
layers, m the number of heads and hji is the attention matrix jkanovic et al. 2020). In contrast, we aim at validating our
of the j-th head from the i-th layer. The function maxc takes abstraction method. Thus, with the validation step, we aim
the maximum of each column of the given averaged matrix. to assess whether our obtained subset (in the abstraction)
In comparison to other possible combination options from still contains all necessary information to train a standard
the maximum, average or sum of the attention matrices, this model with similar accuracy. Thus, we do not focus the vali-
strategy turned out to be the best in our experimentation. dation on the original model, but rather at assessing whether
At the end of our abstraction via attention step we obtain a newly trained model performs with similar accuracy us-
a subset sequence in order to show what the MHA extracts ing our abstracted data. Here, we consider two data imputa-
(see Figure 4 (c), (d)) given the attention-abstracted infor- tion methods: 1. We apply a linear interpolation between all
mation from the symbolic time series (see Figure 4 (b)). Ac- known values to impute the removed ones, and remove all
cording to Pruthi et al.; Baan et al., this subset is probably points which cannot be interpolated using a masking layer;
not the minimal subset covering the important information; 2. We use a masking layer to ignore all removed values.
however, it contains particular important information for in- To assess the reduction in complexity in our abstraction,
terpreting the problem regarding the MHA. We propose a we introduce a simple complexity measure, which counts
subdivision into three subsets with different projections, for how many direction changes occur in the time series. We
including data points into our resulting abstraction, using argue that a time series with more shifts in the trend direction
two thresholds t1 and t2 : is more complex for the human, while a line would be the
1. The first threshold t1 includes every data point with rela- most simple form with no direction changes.Results Model. As for the model1 , we decided to use a quite sim-
For demonstrating the efficacy of our presented approach, ple attention model with acceptable accuracies. Therefore
we applied two datasets – one synthetic and one real-world we did not optimize the model, but tried out different pa-
dataset – which have a quite small univariant sequence rameters, which performed quite similar in regard to the ac-
length and can somewhat easily be classified by humans, to curacy and abstraction. We used a two layered Transformer
better judge the results according to one’s expectations: encoder, based on the original paper (Vaswani et al. 2017),
with 6 heads and a dropout of 0.3, followed by a dense layer
1. The first one is the Synthetic Control Chart time series
which takes in the flattened encoder output. As final out-
(Alcock, Manolopoulos, and others 1999), which contains
put layer we used a sigmoid-based dense layer with one
synthetic data for six different data trends. The train and
neuron for each output-class. For the training we used an
test data is both 300 samples long, where each sequence
Adam optimizer with included warm-up steps. As for the
has the length 60 and each class occurrence is balanced.
loss-function we took the mean squared error. The architec-
2. The second one is an ECG5000 dataset (Goldberger et al.
ture of our model can further be seen in Figure 3.
2000), which contains preprocessed ECG samples for 5
classes of length 140. The class distribution is unbalanced
and the training size is 500, while the test data amounts to
Model Performance
4500 samples. This makes this dataset quite challenging, In Table 1 the performance of the model on the original data
especially for rare classes. and the symbolic-abstracted data can be seen. For the ECG
We preprocessed all data as described above and used a 5- dataset the SAX algorithm did not change much regarding
fold cross-validation procedure to generate training and val- the performance, while for the synthetic dataset the test ac-
idation sets and to reduce according training biases. The fi- curacy dropped by 1,2%. The latter could be explained by
nal validation and test statistics are given by the averages the similarity of some classes, which can make it quite hard
obtained across all 5 folds. For a clear assessment and vi- to distinguish them from each other. Nevertheless the results
sualization, we analyzed our abstraction on the attention of are acceptable to analyse the models.
every fold-model to visualize what each model processes. Tables 2, 3, 4 and 5 show the results for the different com-
binations of thresholds and validation inputs while consider-
ing the accuracy, the amount of data which was removed
Data Preprocessing. All data was standardized to unit (Data Red. By), how many instances changed its predic-
variance with the Sklearn (Buitinck et al. 2013) Standard- tion compared to the SAX-model (Pred. Changes) and how
Scaler, which was fit on the training data. Afterwards in the many trend changes occurred in the data (Trend Shifts). It
first abstraction step the values of each time series is trans- can be seen that for most instances the models performed
formed into symbols using SAX, also fit on the training data. quite similar or sometimes even slightly better than the SAX
To support easy human interpretability while accommodat- model. The worst instances also show, that selecting a good
ing discriminating power at the same time, we experimented threshold is quite important to include the most relevant data
with several scales and abstracted to five symbols (5 bins), points. With respect to performance the Average threshold
i. e., to a value range of very low, low, medium, high and with interpolation performed overall the best. The reduction
very high, where we used a uniform distribution to calculate of the data was always bigger than 47% and up to 91%
the bins. In our experiments, this balanced human interpre- on the ECG dataset without loosing more than 4% accu-
tation with a relatively low number of individual symbols. racy. When considering the trend shifts it can be seen that
We defined a mapping of the ordered set of symbols to the the data-change-complexity decreased to less than 5% for
interval [ 1, 1] and then mapped the values of the original the ECG and to less than 32% for the Synthetic dataset. This
sequence accordingly. Hereby, we keep the ordering infor- indicates an even bigger data size decrease. Further, it can
mation on the time series, thus preserving the known trend be seen, that some reduction is already taking place in the
information, rather than approximating it with a word em- SAX applied data, which also displays its abstraction abil-
bedding. This is one advantage compared to NLP problems, ity. In the reduction it can as well be noticed that the dis-
where this is not possible. tribution of the attention is quite important for the thresh-
old selection. For example, the Max threshold worked quite
Threshold. With respect to the abstraction thresholds, we well for the ECG data, where the highest attention points
experimented with different options and value choices in are rather focused, and a lot worse for the Synthetic dataset
our semi-automatic process, and determined two approaches reduction which has a more equally distributed attention.
with according values on our experimentation. For the Aver- When looking at the percentile of changed classification it
can be seen, that about less than 10% of predictions change.
age threshold option we selected t1 = A˜m and t2 = 1.2t1
and
max(Am ) max(Am )
Through our experimental design with cross validation most
for the Max threshold: t1 = 2 and t 2 = 3 . model dependent influences should be minimized. In some
The Average-abstraction should provide a good relative ab- cases, examples in the data suggest that some abstractions
straction, while the Max-abstraction can be used to high- can also make some classification decisions harder for hu-
light large attention spikes and therefore provide a spike- mans; therefore, our proposed approach includes visualiza-
dependent data reduction. We tried out different options for tion and validation as central human-centered steps.
the parameters, to roughly minimize the abstraction while
1
aiming at accurate results for both datasets. https://github.com/cslab-hub/LocalTSMHAInterpretabilityBase SAX tant key elements are still included. Accordingly this verifies
Dataset Base Acc. SAX Acc.
Shifts Shifts that the extraction somewhat describes a pattern which ap-
ECG Val. 0.9520 137.44 0.9480 22.37
proximates the class definition. Moreover, the found differ-
ECG Test 0.9332 90.17 0.9302 22.11
Synth. Val. 0.9500 57.99 0.9533 45.88 ences in the abstractions between folds were quite similar,
Synth. Test 0.9547 56.29 0.9427 45.71 but included some variations of small artefacts. This further
enhances the idea that our method works in general and ad-
Table 1: Baseline accuracies for the original time series and ditionally that it can help to find artifacts in trained models.
the over SAX abstracted symbolified time series.
Data Pred. Trend
Dataset Accuracy
Red. By Changes Shifts
ECG Val. 0.9520 0.6950 0.0200 16.72
ECG Test 0.9263 0.6950 0.0286 13.22
Synth. Val. 0.9567 0.5166 0.0667 19.17
Synth. Test 0.9540 0.5133 0.0680 17.96
Table 2: Statistics for the Average threshold with an interpo-
lated validation input.
Data Pred. Trend
Dataset Accuracy
Red. By Changes Shifts
ECG Val. 0.9480 0.6965 0.0220 14.35
ECG Test 0.9258 0.6963 0.0373 19.46
Synth. Val. 0.9500 0.5176 0.0633 17.85 Figure 4: Example abstraction from the Synthetic dataset
Synth. Test 0.9340 0.5142 0.0667 22.53 class 2 (right) and ECG dataset class 2 (left).
Table 3: Statistics for the Average threshold with a masked
validation input.
Discussion
Data Pred. Trend We already argued that the abstraction tends to remove less
Dataset Accuracy
Red. By Changes Shifts
important data points and therefore the data gets more acces-
ECG Val. 0.9240 0.9152 0.0440 6.85
ECG Test 0.9090 0.9125 0.049 3.86 sible for human interpretation. Mainly, our method removes
Synth. Val. 0.9467 0.4791 0.0733 25.05 about 47% and up to 91% of less relevant data, while in-
Synth. Test 0.9140 0.4825 0.0933 23.46 creasing interpretability and preserving performance. When
looking at the amount of trend shifts it is being reduced even
Table 4: Statistics for the Max threshold with an interpolated more. Therefore, we argue that this abstracted shape can
validation input. help the human to interpret the problem more easily while
it also opens up the possibility to analyse what the MHA fo-
Data Pred. Trend cuses on. But it is important to keep in mind, that overdoing
Dataset Accuracy
Red. By Changes Shifts
the abstraction can also make the interpretation somewhat
ECG Val. 0.9300 0.9156 0.0440 5.14
ECG Test 0.9208 0.9129 0.0467 5.83
harder to grasp for a human (e. g., Figure 4 (c), left).
Synth. Val. 0.9300 0.4808 0.0800 23.85 From our experience in fine tuning the thresholds on dif-
Synth. Test 0.8973 0.4848 0.0993 24.72 ferent datasets in our proposed human-centered approach,
we observed a specific phenomenon: here, each class ab-
Table 5: Statistics for the Max threshold with a masked val- straction is also influenced by the complexity of all other
idation input. classes, e. g., when optimizing for a simple class only com-
pared to more complex classes. In our opinion, we think that
the MHA works as a noise reduction/preprocessing, but also
Local Abstract Attention Visualisation highlights possibly important data for every other class. This
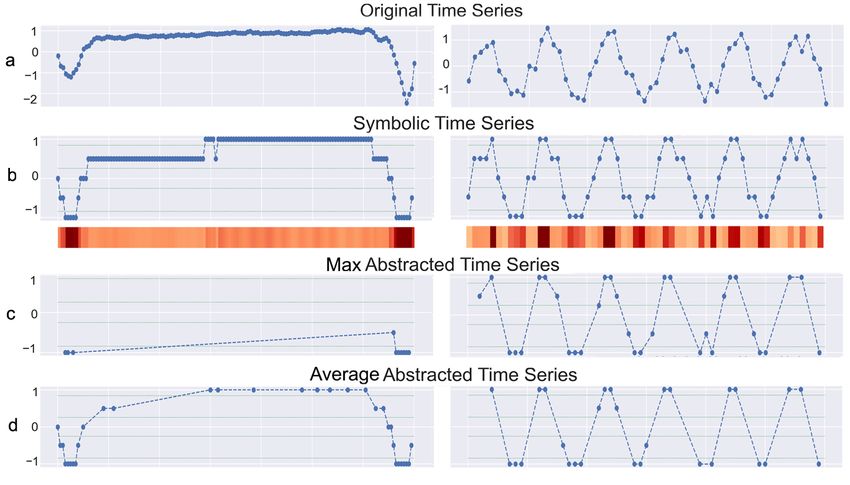
Figure 4 visualizes the local data at each step of the process, could be the case, because the real class decision knowledge
for the Synthetic (left) and ECG (right) dataset. In (a) the is contained in the followup dense layer, while the MHA
scaled original time series can be seen. In (b) the symbol- only shows interesting class coherences. This also could ex-
ified and to [ 1, 1] projected time series can be seen, while plain how attention could help the learning process, like
right below the attention values are represented. The last vi- Pruthi et al. suspected, while not being a straightforward rel-
sualizations (c) and (d) show the abstracted interpolated time evancy measurement as argued by Serrano and Smith.
series for the Average (c) and Max (d) thresholds. Like also One general limitation of human-in-the-loop approaches
seen in the accuracies, we observe that the Max threshold is the time spent during the iterations in the process. There-
does a better abstraction job for the ECG data in contrary to fore, with multiple models to train, this can use up a lot of
the Synthetic data. In general, we find that the abstractions time and hence is suboptimal for very complex models, in
are closer to how we would describe the generic pattern of general. However, scalability was not a focus of this paper,
the class while the validation results show us, that the impor- which we aim to investigate in future work in more detail.In general, with respect to more complex models, we tried ware: experiences from the scikit-learn project. arXiv preprint
to check for the influences of other parameters on our ab- arXiv:1309.0238.
straction; we suspect that more heads can increase the per- Clark, K.; Khandelwal, U.; Levy, O.; and Manning, C. D. 2019.
formance of the abstraction. Moreover, we noticed that more What does bert look at? an analysis of bert’s attention. arXiv
layers and an input embedding — like typically used for preprint arXiv:1906.04341.
NLP — make the attention more vague. This could be be- Devlin, J.; Chang, M.-W.; Lee, K.; and Toutanova, K. 2018.
cause an embedding layer and every additional MHA layer Bert: Pre-training of deep bidirectional transformers for lan-
mixes the relations and important information of every po- guage understanding. arXiv preprint arXiv:1810.04805.
sition and therefore similar information-rich data points get Dosovitskiy, A.; Beyer, L.; Kolesnikov, A.; Weissenborn, D.;
grouped together to attention areas in the attention matrix. Zhai, X.; Unterthiner, T.; Dehghani, M.; Minderer, M.; Heigold,
G.; Gelly, S.; et al. 2020. An image is worth 16x16 words:
Conclusions Transformers for image recognition at scale. arXiv preprint
In this paper, we focused on the problem of making sense arXiv:2010.11929.
of both the MHA mechanism as well as the complex time Goldberger, A. L.; Amaral, L. A.; Glass, L.; Hausdorff, J. M.;
series, in order to find out about relevant data points upon Ivanov, P. C.; Mark, R. G.; Mietus, J. E.; Moody, G. B.; Peng,
which the transformer MHA bases the respective decisions C.-K.; and Stanley, H. E. 2000. Physiobank, physiotoolkit, and
on. For this, we presented an approach making use of inter- physionet: components of a new research resource for complex
pretable symbolic data representations, supported by a novel physiologic signals. circulation 101(23):e215–e220.
visualization technique. In our evaluation, we showed the Jain, S., and Wallace, B. C. 2019. Attention is not explanation.
efficacy of the presented approach – both referring to the arXiv preprint arXiv:1902.10186.
performance on the data abstracted via our approach, and Li, S.; Jin, X.; Xuan, Y.; Zhou, X.; Chen, W.; Wang, Y.-X.; and
on the interpretability of the visualization. In summary, we Yan, X. 2019. Enhancing the locality and breaking the mem-
can see that with our approach the relevant information is ory bottleneck of transformer on time series forecasting. arXiv
identified and preserved, while the information can also be preprint arXiv:1907.00235.
conveniently visualized. Lim, B.; Arik, S. O.; Loeff, N.; and Pfister, T. 2019. Temporal
For future work, we aim to apply the proposed approach fusion transformers for interpretable multi-horizon time series
on further datasets and compare it with other transformer forecasting. arXiv preprint arXiv:1912.09363.
architectures as well as further abstractions. Another inter- Lin, J.; Keogh, E.; Lonardi, S.; and Chiu, B. 2003. A Symbolic
esting direction is given by a more detailed exploration of Representation of Time Series, with Implications for Streaming
the symbolic-position coherence matrices in order to ana- Algorithms. In Proc. 8th ACM SIGMOD Workshop on Research
lyze the respective dependencies in more detail. Finally, in- Issues in Data Mining and Knowledge Discovery, 2–11. New
vestigating the scalability of the process, also in the context York, NY, USA: ACM.
of larger datasets is an important direction which we plan to Lin, J.; Keogh, E.; Wei, L.; and Lonardi, S. 2007. Experiencing
consider in the future. SAX: A Novel Symbolic Representation of Time Series. Data
Mining and Knowledge Discovery 15(2):107–144.
Acknowledgements Mujkanovic, F.; Doskoč, V.; Schirneck, M.; Schäfer, P.; and
This work has been supported by Interreg NWE, project Di- Friedrich, T. 2020. timexplain–a framework for explain-
Plast - Digital Circular Economy for the Plastics Industry. ing the predictions of time series classifiers. arXiv preprint
arXiv:2007.07606.
References Pruthi, D.; Gupta, M.; Dhingra, B.; Neubig, G.; and Lipton,
Z. C. 2019. Learning to deceive with attention-based expla-
Alcock, R. J.; Manolopoulos, Y.; et al. 1999. Time-series simi-
nations. arXiv preprint arXiv:1909.07913.
larity queries employing a feature-based approach. In 7th Hel-
lenic conference on informatics, 27–29. Ramsauer, H.; Schäfl, B.; Lehner, J.; Seidl, P.; Widrich, M.;
Gruber, L.; Holzleitner, M.; Pavlović, M.; Sandve, G. K.;
Atzmueller, M.; Hayat, N.; Schmidt, A.; and Klöpper, B. 2017. Greiff, V.; et al. 2020. Hopfield networks is all you need. arXiv
Explanation-aware feature selection using symbolic time series preprint arXiv:2008.02217.
abstraction: approaches and experiences in a petro-chemical
production context. In 2017 IEEE 15th International Confer- Serrano, S., and Smith, N. A. 2019. Is attention interpretable?
ence on Industrial Informatics (INDIN), 799–804. IEEE. arXiv preprint arXiv:1906.03731.
Atzmueller, M. 2018. Declarative Aspects in Explicative Data Tay, Y.; Dehghani, M.; Bahri, D.; and Metzler, D. 2020. Effi-
Mining for Computational Sensemaking. In Proc. Interna- cient transformers: A survey. arXiv preprint arXiv:2009.06732.
tional Conference on Declarative Programming (DECLARE), Vaswani, A.; Shazeer, N.; Parmar, N.; Uszkoreit, J.; Jones, L.;
97–114. Heidelberg, Germany: Springer. Gomez, A. N.; Kaiser, L.; and Polosukhin, I. 2017. Attention
Baan, J.; ter Hoeve, M.; van der Wees, M.; Schuth, A.; and is all you need. arXiv preprint arXiv:1706.03762.
de Rijke, M. 2019. Understanding multi-head attention in ab- Vig, J. 2019. Visualizing attention in transformer-
stractive summarization. arXiv preprint arXiv:1911.03898. based language representation models. arXiv preprint
arXiv:1904.02679.
Buitinck, L.; Louppe, G.; Blondel, M.; Pedregosa, F.; Mueller,
A.; Grisel, O.; Niculae, V.; Prettenhofer, P.; Gramfort, A.; Grob- Wang, C.; Liu, X.; and Song, D. 2020. Language models are
ler, J.; et al. 2013. Api design for machine learning soft- open knowledge graphs. arXiv preprint arXiv:2010.11967.You can also read


