Do you trade with your friends or become friends with your trading partners? A case study in the G1 cryptocurrency
←
→
Page content transcription
If your browser does not render page correctly, please read the page content below
Do you trade with your friends
                                                   or become friends with your trading partners?
                                                       A case study in the G̃1 cryptocurrency
                                                                       Nicolas Gensollen and Matthieu Latapy

                                                                                        Abstract
                                                  We study the interplay between social ties and financial transactions made through a
                                              recent cryptocurrency called G̃1. It has the particularity of combining the usual transaction
                                              record with a reliable network of identified users. This gives the opportunity to observe
                                              exactly who sent money to whom over a social network. This social network is a key piece of
                                              this cryptocurrency, which therefore puts much effort in ensuring that nodes correspond to
                                              unique, well identified, real living human users, linked together only if they met at least once
arXiv:1911.10792v2 [cs.SI] 5 May 2021

                                              in real world. Using this data, we study how social ties impact the structure of transactions
                                              and conversely. We show that users make transactions almost exclusively with people they
                                              are connected with in the social network. However, they tend to build social connections with
                                              people they will never make transactions with.

                                        1     Introduction
                                        Since the introduction of the blockchain in 2008 [21], the number and diversity of applications
                                        relying on this technology has been continuously growing [5] [10]. Although Bitcoin is still a
                                        benchmark cryptocurrency [10] [9], many new currencies relying on different kinds of blockchains
                                        have been introduced since then [9].
                                            Understanding the growth and popularity of cryptocurrencies is non-trivial, but social ties seem
                                        to play a key role. This is not surprising since currencies enable transactions between individuals,
                                        and for these transactions to actually happen, some kind of pre-existing tie is often required. In
                                        the early age of cryptocurrencies, actually, specific platforms were forming the bulk of these media.
                                        Cryptocurrencies then relied on social media to boost their growth and facilitate interactions.
                                            The G̃1 [8] cryptocurrency goes further: it relies on social ties to strengthen the robustness of
                                        the system. It maintains an accurate network of identified users with reliable social ties, and use
                                        it for monetary growth. This offers a unique opportunity to study the interplay between financial
                                        transactions and social ties between human beings.

                                        1.1    Related Work
                                        The literature on social interactions on the one hand, and financial transactions on the other
                                        hand is extremely vast and spans several domains such as economy, sociology, network science,
                                        psycology, or finance to name only a few. Yet, scientific works studying how these phenomena co-
                                        evolve remain scarce. A key reason is the lack of appropriate data sources: financial transactions
                                        are considered as sensitive data, and rarely made public; even when they are, interactions are
                                        anonymized. In [19] for instance, the authors use real but anonymized transaction records to infer
                                        a pseudo-social network of users in which two users are connected if they transfered money to
                                        the same entity. Then, they use this pseudo-social network for social targeting and show that it
                                        performs better at identifying buyers than targeting based on traditional models.
                                            Pioneer work studying both social ties and the way people make transactions can be found
                                        in sociology. In [24] for example, the authors propose to split payements in three categories:
                                        gifts, entitlements, and compensations, and show that each category corresponds to a specific
                                        set of social relationships and systems of meanings. The recent development of online social
                                        networks and the increasing availability of data gave a new boost to the study of social ties.
                                        Among this vast literature, a subset of contributions studies how social ties can be predicted
                                        from other data sources. For example [7] uses the proximity, in space and time, of geo-tagged
                                        photographs over the Flickr social network to infer the likelihood of a social tie between users.

                                                                                             1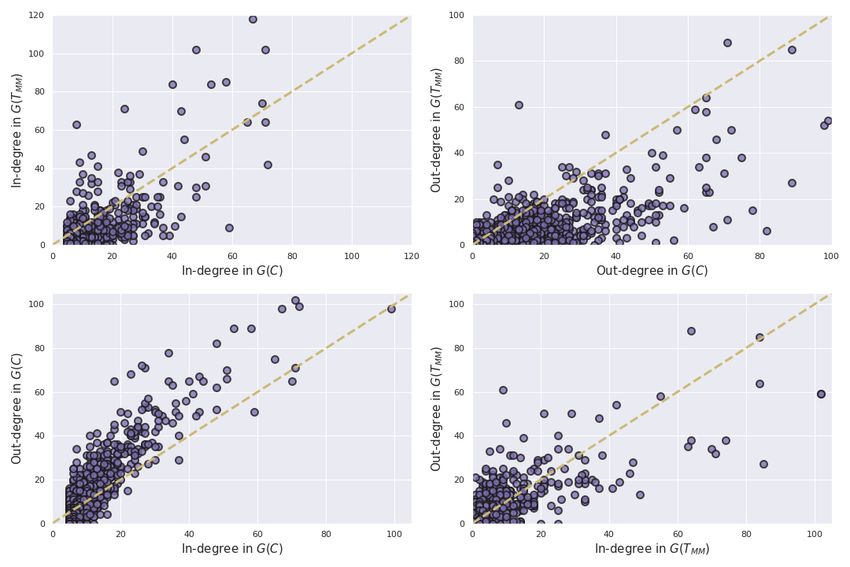
This paper shows that this probability increases by orders of magnitudes as the number of co-
locations increases. In [11], the authors explore the combined effect of multiple social networks for
link prediction. More precisely, they represent social interactions as a multiplex network where
each layer represents a specific social platform, and they show how this additional information can
be used to improve link prediction. In [12], the authors investigate link strength prediction in a
social network based on social transactions (likes, comments, etc). They propose a new type of
multiple-matrix factorization model for incorporating a transaction matrix between users, and test
their method on Cloob [1], a popular Iranian social network where users can rate their friendship
relationships.
    Related works basically either start from a transaction record to infer underlying social ties,
or start from a social network and try to predict new or missing links based on various features.
To the best of our knowledge, there is no previous work studying financial transactions and social
interactions simultaneously from a reliable data source. The recent development of cryptocurren-
cies is creating new opportunities for this kind of studies. Contrary to transactions relying on
usual payment methods, blockchain based transactions are public and can be analyzed freely as
long as the blockchain itself is public. In [14], for instance, the authors extracted the transac-
tions from the Bitcoin blockchain and reconstructed the network of transactions. They provide
a graph-based analysis of this network and show that linear preferential attachment drives its
growth. In [22] the authors also study the network of transactions of both Bitcoin and Litecoin,
while the authors of [18] recently studied the structure of the Bitcoin users graph, exhibiting a bow
tie like structure between its components. In [13], the authors analyzed user comments in online
communities of Bitcoin, Ethereum, and Ripple to predict the price and number of transactions in
these cryptocurrencies.
    The main limitation is often that, in most of these systems, the public keys used as wallets for
transactions are used only once, i.e. users are encouraged to create a set of cryptographic keys for
each transaction as a way to preserve anonymity. A direct consequence for our purpose is that
there is no obvious way to link real users to the set of keys they used to make transactions [20] [6].
Some heuristics have been proposed to tackle this challenge [20] [6] but they mostly work for large
users and it is difficult to assess their reliability. In addition, even though users were identified
properly, the underlying social ties would still be unknown.

1.2    Our contribution
In this paper, we study a specific cryptocurrency which offers both a ledger of transactions and
of social bounds between identified human beings. This means that we can tell exactly who sent
money to whom and when. Our main objective is to understand the interplay between these
transactions and the social ties. More precisely, we first wish to understand whether users start
making transactions before creating a tie, or if they tend to make transactions with people they
are already friends with. Going further, we wish to study the different neighborhood structures
and their evolution over time. We will tackle questions such as: Are my transaction partners the
same as my friends? How do my friends exchange between them compared to my transaction
partners? Are my friends and transaction partners more and more homogeneous over time?
    As we will see in section 3, although the data is rather simple at first glance, the proper
modeling of interactions is still a challenge and no unique, commonly accepted approach exists.
We leverage here the recently introduced stream graph model, which captures both the time and
structural components of data [17] [16]. We will start our analysis with basic metrics targetting
the questions above and we will introduce new stream graph concepts as we need them in the
analysis.
    This paper is organized as follows. Section 2 introduces the G̃1 cryptocurrency and explains
the main ideas and mechanisms behind it. In section 3, we present the dataset under study and
show how the stream graphs model interactions from this dataset. In section 4, we use time
series and static graph concepts to gain a first insight on the global structure and dynamics of the
system. In section 5 we consider both time and structure together but stay at a basic link level
in order to understand the interplay between social ties and transactions. Finally, in section 6 we

                                                  2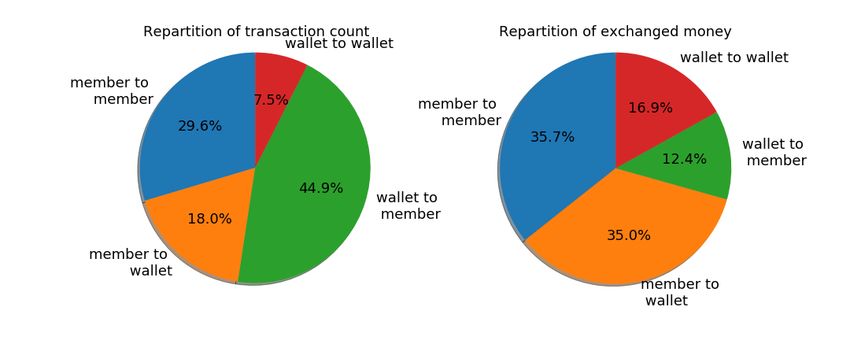
use more complex stream graph concepts mixing time and structure in order to investigate these
questions further.

2     The G̃1 cryptocurrency
2.1    A libre currency
G̃1 [8] is a cryptocurrency introduced in France in March 2017. Contrary to most other cryp-
tocurrencies, the growth of the G̃1 monetary mass is not related to mining but to the number of
users, and it is distributed evenly between them. Each member receives a share of the monetary
growth every day as the universal dividend (UD). This share should not be considered as a salary
or as a reward: there is no work required from the members to earn their UD (although they have
some responsibilities as we will see). The universal dividend simply comes from the fact that all
individuals are considered equal in terms of currency creation. G̃1 is indeed considered to be the
first ”libre” cryptocurrency (which means free in French), and which properties were developed in
the relative theory of money [15].
    Libre currencies have two key properties which differentiate them from other currencies: a
spatial and a temporal symmetry. The spacial symmetry means that all individuals of a given
generation co-create the same amount of new currency units, while the temporal symmetry pre-
vents a generation of users to be favored over another by the currency creation process. In G̃1,
the monetary growth rate, and therefore the UD’s value, evolve according to the population’s size
and are updated every six months [8].
    It is easy to see that most currencies, independantly of their use of the blockchain, are not
libre: some individuals benefit from the monetary creation at the expense of others. In Bitcoin for
example, early adopters managed to mine most of the finite monetary mass leaving only crumbs
to the other users [14] [23]. With fiat currencies, creation of new units is often a priviledge given
to states and remains obscur to most citizens. One of the main objectives of G̃1 and the relative
theory of money [15] is to show that a currency can fulfill its purpose of enabling transactions of
goods, while preserving fairness and equity in terms of monetary creation.

2.2    Identification of members
The whole G̃1 system relies on its members and their identities. Indeed, each account must be
attached to a well identified living human being with no other account in the system. Otherwise
anybody would be able to create multiple accounts and earn multiple UDs every day, which would
undoubtly trigger the collapse of the whole system. We will see later that, although they cannot
own a member account, non-human entities like corporations or associations can still participate
to the transaction network.
    In order to identify its members, G̃1 maintains a web of trust (WoT) between them, in addition
to the usual transaction record. A link from person a to person b in the WoT is called a certification
and means that a certifies that b is a real living human being, with no other account in the system.
These certifications are written in the blockchain and have a finite validity (currently set to two
years), meaning that members have to renew their certifications to maintain their status. G̃1
implements a set of rules to ensure robustness of the WoT against attacks. For example, a new
member has to obtain at least five certifications from already existing members to join the system
and contribute to the currency creation process. Moreover, any member has to be within a
small distance to a member with enough certifications given and received for its identity to be
considered as safe. As we will see, these rules shape the WoT in a rather clustered network with
a small diameter.
    Although robutness of the WoT against sybil attacks is an interesting topic on its own, we will
not consider it here. In this paper, we assume that the WoT is composed of real unique human
beings and that certification links accurately reflect social ties between them. Note that each new
member agrees and signs a charter explaining the responsibilities of a member. Among them, a

                                                  3
member has to be sure of the validity of a new account before giving a certification. This means
that a new user wishing to become a member has to meet other members in real life at least once.
Although this can be a difficult thing to do, the community organizes social events to welcome
new users. A certification is thus not necessarily a strong social tie per se, but it is supposed to
exist only between human beings who have met at least once in real life, which might be more
than one can expect in other online social networks.
2.3 Financial transactions
In addition to the WoT, G̃1 enables financial transactions which are also written in the blockchain
like for usual cryptocurrencies. There is no obligation to be a member to make transactions. G̃1
has indeed a clear distinction between a member account, which participates in the monetary
growth and receives one UD per day (see section 2.2), and a wallet, which is nothing more than
a public key that can send and receive money. Anybody can create one or several wallets, and
transactions can be made freely between wallets and members.
We will come back to this in section 3.3, but this distinction enables us to split the stream
of transactions in different substreams according to source and destination types. One of these
substreams is composed only of transactions between identified members, such that we know
exactly who sent what to whom and when within this stream. This is already much more than
one can hope for in other cryptocurrencies like Bitcoin where transactions occur between one time
only keys. But, we also have, thanks to the WoT, the social relationships between the entities
making these transactions. This makes G̃1 a unique dataset to study the interplay between social
ties and financial interactions.
3 Dataset and stream graph modeling
All the data we consider here is extracted from the G̃1 blockchain which is publicly available [2].
For our purpose, the blockchain contains three key information: the identities, the certifications,
and the transactions. Identities associate a public key (which we also call a wallet) to a user name
and represent therefore the members of the system. As explained in section 2.2, a certification is a
directed interaction between a member and a public key, while a transaction is a directed weighted
interaction between two public keys. From the blockchain, we extracted a stream of certifications,
which is basically a sequence of (t, u, v) triplets, meaning that entity u certifies entity v at time t,
and a stream of transactions, which is a sequence of (t, u, v, a) quadruplets, meaning that entity
u sends an amount a to entity v at time t.
Although simple in appearance, this data has both a structural and temporal component which
makes its analysis far from trivial. Indeed, relying on classical methods such as static graphs or
time series means that the data is somehow simplified and that information is lost in the process.
In this paper, we propose to use stream graphs, rencently introduced in [17] and [16], to study these
streams, and the dependencies between them. We provide first some basic notions and notations
related to the analysis of interaction data using the stream graph formalism, and we encourage
the interested reader to have a look at references [17] and [16] for a more detailed introduction to
stream graphs.
3.1 Stream graphs
A stream graph S is defined as a quadruplet (T, V, W, E) where T is the set of time instants, V is a
finite set of nodes, W ⊆ T × V is a set of temporal nodes, and E ⊆ T × V ⊗ V is a set of links such
that (t, uv) ∈ E implies (t, u) ∈ W and (t, v) ∈ W . The left plot of figure 1 shows an example of a
simple stream graph with four nodes a, b, c, and d (node labels are represented on the y-axis) over
a time period going from t = 0 to t = 10 (time is represented on the x-axis). The nodes’ presence
is represented as horizontal dotted lines. For example, on the left plot of figure 1, node b is present
between t = 0 and t = 4, and then between t = 5 and t = 10. An interaction between two nodes
4Figure 1: Left - Example of a stream graph with T = [0, 10], V = {a, b, c, d}, W = [0, 10] × {a} ∪
([0, 4] ∪ [5, 10]) × {b} ∪ [4, 9] × {c} ∪ [1, 3] × {d}, and E = ([1, 3] ∪ [7, 8]) × {ab} ∪ [4.5, 7.5] × {ac} ∪
[6, 9] × {bc} ∪ [2, 3] × {bd}. In other words, Ta = [0, 10], Tb = [0, 4] ∪ [5, 10], Tc = [4, 9], Td = [1, 3],
Tab = [1, 3] ∪ [7, 8], Tac = [4.5, 7.5], Tbc = [6, 9], Tbd = [2, 3], and Tad = Tcd = ∅. Right - An
example of stream graph in discrete time. It is defined by T = [0, 13] ⊆ N , V = {a, b, c, d}, Ta = T ,
Tb = {1, 2, 3, 4, 5, 7, 8, 9, 10, 11, 12, 13}, Tc = [5, 12], Td = [1, 3], Tab = [1, 4] ∪ [9, 10], Tac = [6, 9],
Tbc = [8, 12], Tbd = [2, 3], and Tad = Tcd = ∅.
at a given time is represented as a vertical bold line connecting them. Depending on the dynamics
of the system, interactions can have a duration or can be viewed as discrete. For example, an
SMS can be seen as a discrete interaction between two phone numbers, while a phone call would
most likely be modeled as a link with duration. When a link has a duration, it is represented as
an horizontal bold line. On the left plot of figure 1 for example, nodes a and b interact from t = 1
to t = 3, and from t = 7 to t = 8. Note also that the set of time instants T can be continuous
or discrete. The right plot of figure 1 shows a simple example of a stream graph in discrete time.
A few stream graph concepts differ slightly from continuous to discrete time (mostly integrals
becoming sums and sets becoming intervals) but most concepts apply directly to both cases.
3.2 Modeling certifications and transactions using stream graphs
We denote by V the set of all public keys interacting at least once in the certification or transaction
streams. A subset M ⊆ V of these public keys belongs to members of the system and is available
through the identities written in the blockchain. The set A = V \ M contains all public keys
which were involved in at least one transaction and do not belong to a member, which we will call
anonymous wallets in the following.
We denote by C = (TC , M, WC , EC ) the stream of certifications between members: TC =
[1488987127, 1555054577] is the time interval going from the first certification given (on 2017-
03-08 15:32:07) to the latest certification considered in this study (on 2019-04-12 07:36:17); WC is
the set of temporal nodes involved in C; and EC is the set of certification links.
Similarly, we denote by T = (TT , V, WT , ET ) the stream of transactions: TT = [1488990898, 1555052722]
is the time interval going from the first transaction (on 2017-03-08 16:34:58) to the latest transac-
tion considered in this study (on 2019-04-12 07:05:22); WT is the set of temporal nodes involved
in T ; and ET is the set of transaction links.
When the currency was launched in 2017, the initial block was composed of 49 members who
certified each other to initialize the WoT with 551 certifications. New users then joined the system
by becoming members and/or by making transactions in G̃1. This means that nodes are not always
present in the streams, they appear at some point in time, that we call their birth, and they may
exit the system at a later time. Over the period of study (2017-2019), C contains 2128 nodes (i.e
|M | = 2128) and 18765 distinct certifications, while T contains 38296 transactions between 3872
public keys.
Recall that a certification between two members is valid for two years, such that a link in C
can be seen as a link with a duration of two years. Since G̃1 is still a young cryptocurrency, we
5Figure 2: 30 days rolling sum of the activities of the certification stream C (red curve) and the
transaction stream between members TM M (blue curve).
currently have only two years of data available (2017-2019), such that the very slow link dynamics
in C is not very interesting yet: links basically appear at some point and stay active until the
end of the stream. Transactions on the other hand form a stream of links without a clearly
defined duration. In this paper, we will use a discrete time representation for T in order to avoid
technical difficulties which can occur when dealing with discrete interactions in continuous time.
Note however, that we could have chosen an arbitrary link duration (the time interval between
two blocks in the blockchain for example) for a transaction in order to stay in continuous time.
3.3 Useful objects and concepts
As explained before, a public key can be linked to a member account or to an anonymous wallet
such that we can define two subsets of WT (called clusters), one containing only members involved
in transactions, and the other containing only anonymous wallets involved in transactions. We
can then define the set of links between nodes involved in a cluster as the substream induced by
this cluster (see [17] for more details). Transactions can thus occur between identified members,
between anonymous wallets, or between members and anonymous wallets such that we can split
T in four non-overlapping substreams: TM M (transactions between identified members), TM A
(transactions from a member to an anonymous wallet), TAM (transactions from an anonymous
wallet to a member), and TAA (transactions between anonymous wallets).
Since stream graphs encode both time and structure, it is natural to define the graph induced
by a stream and the activity of a stream. The graph induced by a stream S = (T, V, W, E) is a
static graph G (S) = V, Ē in which two nodes are linked if they interacted at least once in the
stream, i.e. Ē = {(u, v) , ∃ (t, uv) ∈ E}. Note that the WoT is then nothing more than the graph
induced by C. The activity of a stream is often defined as the time serie of its link activity, i.e.
the number of active links as a function of time.
4 Overview of certification and transaction streams
In this section, we study general properties of C and T in order to gain a better understanding
of their structures and dynamics. We start by studying the activities of the certification stream
C, and of the transaction stream between members TM M . Figure 2 shows the 30 days rolling
sum of both activities, the red curve showing the certification activity while the blue curve shows
the transaction activity. As can easily be seen, both activities are strongly correlated and follow
very similar trends. We can observe a first growth period going from March 2017 to April 2018
before a strong decrease in activity until early October 2018. Since then, both transaction’s and
certification’s activities are increasing with a little more volatility on the transactions’ side.
6Figure 3: Left - In-degree (in blue) and out-degree (in red) distributions of G (C). Right -
In-degree (in blue) and out-degree (in red) distributions of G (TM M ).
Observation 1 The certification dynamics is strongly correlated the one of transactions among
members.
If the activity of a stream gives a rough idea of the global dynamics, the induced graph can
be used to visualize a simplification of the stream’s structure. By projecting the interactions on
a static graph, we obtain two directed graphs G (C) and G (TM M ). In figure 3, we show the in
and out degree distributions of each graph. The left plot shows the distributions for G (C) while
the right plot shows the distributions for G (TM M ). Both graphs clearly display a heavy tail
degree distribution meaning that some members have much larger certification and transaction
neighborhoods than the majority of members.
Observation 2 Both the cortification graph and the member transaction graph have a heteroge-
neous degree distribution.
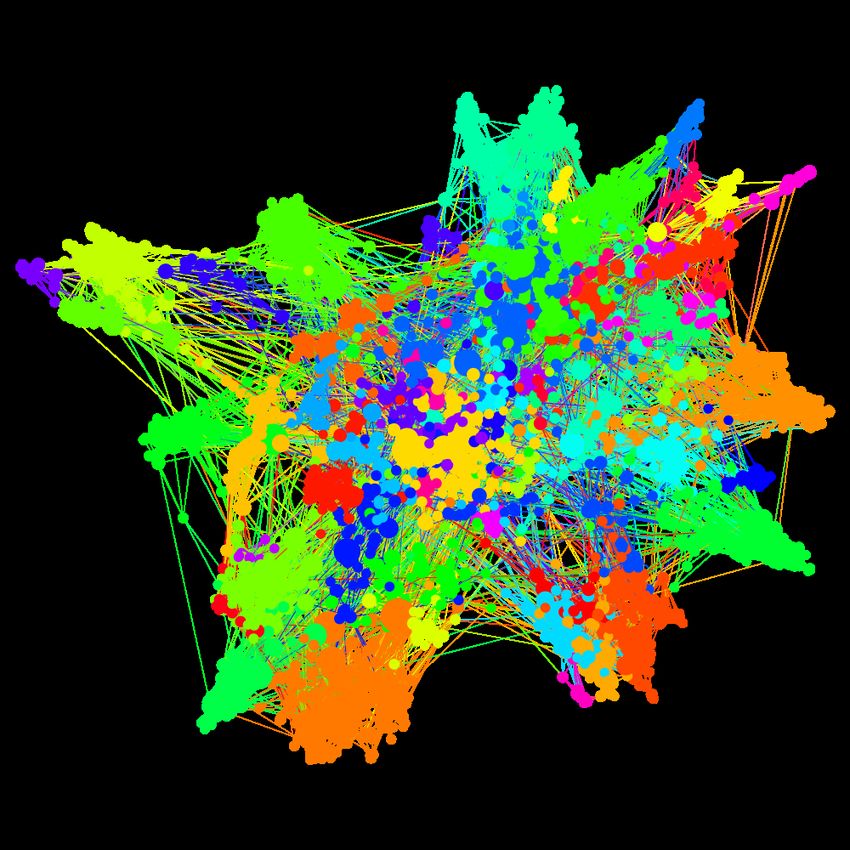
Figure 4 shows a representation of G (C) and was obtained from [3]. Note that, although this
is not the focus of this paper, G (C) seems to have an interesting community structure.
We focus now on the stream of transactions T . Recall that we defined in section 3.3 four
distinct substreams depending on the origin/destination types of the transactions: TM M , TM A ,
TAM , and TAA . Figure 5 shows the repartition of the transactions between these four substreams
as well as the repartition in terms of the total exchanged volume. As can be seen, transactions
between identitfied members (i.e. belonging to TM M ) represent only 30% of T while transactions
between an anonymous wallet and a member (i.e. belonging to TAM ) represent almost 45% of T
and only 12.4% in terms of exchanged money, meaning that there are a lot of small transactions
going from anonymous wallets to member accounts. One possible reason for this asymmetry is
linked to the way miners are retributed in G̃1. Recall that money creation is done by the members
themselves and that it has nothing to do with mining, such that miners are doing the work for
free by design. In order to compensate the miners for this voluntary work, there is a special wallet
in G̃1, called Remuniter, which receives donations and uses them to retribute the miners for the
work they have done. This very specific wallet is therefore a very large hub in T and stands for
almost 40% of all transactions.
Observation 3 A large fraction of all transactions is related to miner retribution.
Note that, thanks to this specific wallet, we can easily identify the miners of G̃1 as the outgoing
neighbors of Remuniter in TAM (i.e. all members who received money from Remuniter ). At the
time we downloaded the blockchain, there was 158 miners among the identified members of the
system.
Figure 6 shows the correlations between the nodes’ degrees in G (C) and G (TM M ). First, note
that there is no node with an in-degree smaller than 5 in G (C) because of the minimum number
of certifications required to become a member. The top right subplot shows that members tend to
give more certifications than they tend to initiate transactions, especially for high degree values.
7Figure 4: Visualization of the WoT obtained from the G̃1 visualization tool [3]. Nodes represent
members while links represent certification relationships. Colors show communities.
Figure 5: The transaction stream T can be divided in four substreams: transactions between
identified members TM M , between a member and an anonymous wallet TM A , between an anony-
mous wallet and a member TAM , and between anonymous wallets TAA . Left - Repartition of the
transactions between the different transaction substreams. Right - Repartition of the exchanged
money between the different transaction substreams. Note that, although TAM represents about
45% of T in terms of number of transactions, it only adds up to 12.4% of the exchanged volume.
8Figure 6: Top Left - In-degree in G (TM M ) vs. in-degree in G (C). Top Right - Out-degree in
G (TM M ) vs. out-degree in G (C). Bottom Left - Out-degree in G (C) vs. in-degree in G (C).
Bottom Right - Out-degree in G (TM M ) vs. in-degree in G (TM M ).
The bottom left subplot shows that nodes in-degree and out-degree values in G (C) are strongly
correlated, meaning that people who receives a lot of certifications tend to also give a lot of them,
and tend to actually give more certifications than they received.
Observation 4 Members tend to give more certifications than they initiate new transactions.
In addition, there is a strong correlation in the number of certifications given and received per
member.
5 How do new certifications and transactions appear be-
tween members?
Our main focus in this paper is to study how certifications impact transactions and vice-versa
such that we will focus on the certification stream C and the transaction stream restricted to the
identified members TM M . In this section we use a simple link-based approach to understand how
new links appear in these two streams. More specifically, we wish to understand if a relationship
between two members tends to exist in both streams and if it rather starts with a certification
(i.e. with a social tie) or through transactions.
When a certification occurs between two previously disconnected nodes in C we search for the
first transaction between these two nodes. This transaction can happen before the certification,
after, or never. We observe that for 73% of certifications, the two involved nodes never make a
transaction between them. 16% of certifications have a pre-existing transaction between the nodes,
and 11% will make a transaction in the future. The top plot of Figure 7 shows the distribution of
the time seperating a certification between two nodes in C from the closest matching transaction
between these two nodes in TM M . Note that most new certification relationships which have a
matching transaction in TM M are relatively close in time. One possible explanation for this is
that new members are often involved in small transactions (welcome gifts or acknowledgments)
shortly after (or before) being certified. The bottom plot of figure 7 shows the distribution of the
9Figure 7: Top - Distribution of time interval ∆t (in seconds) between a certification in C and the
closest matching transaction in TM M . Middle - Distribution of the time interval ∆t (in seconds)
between a new transaction in TM M (i.e. a transaction between two members who never made
a transaction before) and the closest matching certification in C. Bottom - Distribution of the
number of matching transactions in TM M preceding a certification in C for certifications occurring
after prior transactions.
number of transactions in TM M preceding a certification in C for these certifications that occur
after some number of prior transactions. Almost all such certifications occur after only one or
two transactions, but in a very few cases, a certification can happen after as many as 14 prior
transactions.
Observation 5 Most certification relationships in C do not have a matching transaction in TM M ,
and when they do, they tend to be close in time.
Now, we look at this the other way around. When a transaction occurs in TM M , are the
two involved nodes already linked by a certification or will they certify in the future? 64% of all
transactions from TM M occur between two members linked by a certification relationship in C.
More precisely, 42% occur between two already certified members, while only 22% occur between
members who will certify themselves in the future. These numbers also mean that about 36% of
all transactions from TM M occurs between members who never certify themselves directly in C.
We can also consider only new transactions in TM M , that is transactions between two members
who never made a transaction before. The middle plot of figure 7 shows the distribution of time
intervals ∆t (in seconds) between a new transaction in TM M and the closest matching certification
in C. As can be seen, the majority of new transactions in TM M occurs shortly after a matching
certification in C.
Observation 6 Most transactions in TM M occur between members linked by a certification in C.
Because of the constraints imposed on the WoT, the undirected version of G (C) is connected
and we can compute a certification distance between any two members. Because the WoT results
10from social interactions, we expect that nodes lying far appart in G (C) have a small probability
of knowing each other, and therefore, of making transactions. About 78% of the transactions
between non-certified members occur between members at distance 2 in G (C), 19% at distance 3,
2.8% at distance 4, and 0.2% at distance 5, such that the more distant two nodes are in G (C), the
less likely they are to make transactions in TM M .
Observation 7 Members who make transactions in TM M without being certified in C are more
likely to be close in G (C).
The probability of having a link between two randomly chosen nodes in C and TM M are, by
definition, the densities of the induced graphs G (C) and G (TM M ). Two randomly chosen nodes
have a certification link with probability 6.15 × 10⁻³ while they made at least one transaction with
probability 4.67 × 10⁻³ . Now, if instead of picking these nodes randomly, we sample nodes sharing
a certification link, the probability of making a transaction increases to 0.24. In the same way,
sampling among nodes having at least one transaction connecting them increases the proability of
certification to 0.53.
Observation 8 The probability two nodes to be linked in one stream is orders of magnitudes larger
if they are linked in the other stream.
The observations from this section lead to think that certifications are often the first kind of link
appearing between two unrelated nodes in G̃1, and that transactions tend to occur afterwards.
Moreover, we showed that these transactions do not happen randomly but constrained by the
social network. This means that transactions preferably take place between friends or between
friends of friends than between strangers (i.e. nodes far away in the WoT). In the next section, we
will investigate these questions further using more complex concepts mixing time and structure.
6 Member-centric analysis of certifications and transactions
In the previous section, we studied how new links where occurring in C and TM M using a simple
link-based approach. In this section, we wish to go further and exploit the topology of both streams
to gain more insights. A widely used topological concept in graph theory is the one of neighbor-
hoods and egonets. For a stream graph S = (T, V, W, E) the definition of the neighborhood of
node v ∈ V , as given in [17], is the following cluster:
NS (v) = {(t, u) , (t, uv) ∈ E} (1)
A neighborhood is thus composed of temporal nodes rather than simple nodes for static graphs.
We also consider the neighborhood of the induced graph G(S):
N̄S (v) = {u ∈ V, ∃ (t, uv) ∈ E} (2)
In simple words, N̄S (v) contains all nodes which interacted with v ∈ V at least once, while
NS (v) keeps track of the interaction times.
6.1 Do members trade with their certification neighbors or vice-versa?
The first question which comes to mind is whether nodes tend to have similar neighborhoods in
C and TM M . In other words whether users tend to be friends with their transaction partners or
make transactions with their friends. In order to compare the neighborhoods, we use the Jaccard
index and the overlap coefficient defined between two sets a and b as :
|a ∩ b| |a ∩ b|
J (a, b) = , O (a, b) = (3)
|a ∪ b| min (|a| , |b|)
11Figure 8: Distributions of the Jaccard coefficient (in blue) and the Overlap coefficient (in red)
between Left - the nodes’ transaction neighborhoods N̄TM M (u) and certification neighborhoods
N̄C (u) Right - the edges within these neighborhoods.
The left plot of figure 8 shows the distribution of the Jaccard coefficient over the nodes (in blue)
and the distribution of the overlap coefficient (in red) between N̄TM M (u) and N̄C (u). As can be
seen a large majority of nodes have a strong overlap between their two neighborhoods, but rather
small values for the jaccard coefficients. This can be explained by the fact that the transaction
neighorhood is smaller than the certification neighborhood for about 90% of the nodes and tends
to be mostly included within the certification neighborhood. This means that members are more
inclined to make transactions with members within their certification neighborhood, but tend to
certify people they never make transaction with, which is in accordance with the link-based results
of the previous section.
Observation 9 Members tend to make transactions mostly with people within their certification
neighborhood, but tend to certify people they never make transactions with.
The right plot of figure 8 shows the distributions of the same two coefficients between the edges
within N̄TM M (u) and N̄C (u). As can be seen, even though nodes tend to make transactions with
people they are linked to in C there is a much smaller overlap between the interactions in these
neighborhoods.
6.2 Clustering, triangles, and k-closures
In addition to neighborhoods and ego-nets, we propose to study triangles in C and TM M , which
are a famous and very important concept in network theory. They intuitively convey the idea
that people I interact with tend to also interact between themselves. Two basic related metrics in
graphs are the clustering coefficient and the number of triangles.
The average clustering coefficent of G (C) (resp. G (TM M )) is 0.49 (resp. 0.31), while the
average clustering of G (TAA ) is 0.13. Note that, by construction, the clustering coefficients for
G (TAM ) and G (TM A ) are both equal to 0. In terms of triangles, G (C) contains 6589 triangles,
G (TM M ) 1990 triangles, and G (TAA ) only 393.
First of all, note that these values are much higher than for random graphs with the same
degree distributions (about 23 times higher than the average for G (C), and about 4 times higher
than average for G (TM M )), meaning that both G (C) and G (TM M ) are very clustered networks.
Figure 9 shows the distributions of the nodes’ clustering coefficient values in both networks. Note
that, although their average clustering values are similar, the distributions over the nodes are very
different. Indeed, the distribution for G (TM M ) exhibits two peaks around 0 and 1, meaning that
most nodes make transactions either in a very clustered way or not at all, while the distribution
for G (C) has a majority of values in between those extremes.
Observation 10 Both G (C) and G (TM M ) display a strongly clustered structure. However, the
node clustering distributions have very different shapes in each stream. The node clustering dis-
12Figure 9: Node clustering distributions in G (C) and G (TM M ).
tribution of G (TM M ) exhibits two peaks around 0 and 1, meaning that members tend to make
transactions either in a very clustered way or not at all.
The previous results are built on the induced graphs of both streams such that we do not take
time into account. The clustering coefficient has been extended to stream graphs (see [17]), both
in continuous and discrete time, but will provide little insight here. Indeed, the slow dynamics of
C makes the results very similar to the ones obtained for the induced graph G (C), and TM M is
a very sparse stream such that there is almost no time instant where transactions form triangles.
Note that a rather artificial way to compute stream clustering values for TM M would be to set a
sufficiently large link duration in continuous time such that transactions from different blocks of
the blockchain start to overlap.
Here, we prefer to use another stream graph concept to study triangles with explicitely taking
time into account: the k-closures, where k is an integer larger than 1. The 2-closure, for example,
is defined for a given link, as the amount of time we have to go back to find a link beween the
same nodes but in the opposite direction. The 3-closure is defined as the amount of time required
to find a triangle containing the link considered. The left plot of figure 10 shows a schematic view
of the 2 and 3-closures in a simple link stream. The 2-closure of link (6, ab) for example is equal
to 4 since we have to go back to t = 2 to find a link in the opposite direction, namely link (2, ba).
The 3-closure of the same link (6, ab) is equal to 5 since, this time, we have to go back to t = 1 to
find the triangle (6, ab), (4, bd), (1, da). Note that the k-closure values can be infinite if there is no
link in the opposite direction in the past, or no way to close the triangle.
Here we examine both the 2 and 3-closures for C and TM M . The right plot of figure 10 shows
the k-closure densities for the two streams. As can be seen, the 2-closures for C tend to be smaller
than for TM M , meaning that people tend to certify back faster than they make a transaction in
the other direction. The 3-closures densities of C and TM M are very similar which seems to suggest
that, although there are less triangles in TM M than in C, they tend to appear within the same
time frame.
13Figure 10: Left - Schematic view of the 2 and 3-closures. The 2-closure of link (6, ab) is equal
to 4 since we have to go back to t = 2 to find a reversed link (e.g. (2, ba)). The 3-closure of
link (6, ab) is equal to 5 since we have to go back to t = 1 to close the triangle composed of
(6, ab), (4, bd), (1, da). Right - The densities of 2 and 3 closures for all links in C and TM M . Note
that these only consider links with finite k-closures, links with infinite values are ignored.
Observation 11 Users tend to certify back faster than they make a backward transaction. On
the other hand, triangles are built within similar time frames in C and TM M .
7 Conclusion
We studied a recent cryptocurrency which, despite its relatively small size, provides a very inter-
esting and publicly available dataset to study transactions within a social environment. Because
the data has both a structural and temporal component, neither a pure static graph nor a time
serie based model are well suited for its study. We proposed here to rely on the stream graph
formalism to study the streams of certifications and transactions.
We showed that certifications are often the first type of link occurring between two previously
disconnected nodes, suggesting that members of G̃1 start to meet at social events before making
transactions. In this context, the social network shapes the way transactions occur: even when they
occur between two members without a certification relationship, this transaction has a much higher
probability of occurring between two socially close nodes. Investigating further, we showed that
members tend to have a transaction neighborhood included within their certification neighborhood,
meaning that users make transactions mostly with their acquaintances, but with a subset of them
only.
Finally, we studied the clustering of both the certification and transaction streams and discov-
ered that, although both streams display a rather high average clustering coefficient, their node
clustering distributions have very different shapes. Looking at the distribution for the transaction
stream, it seems like nodes tend to make transactions either in a very clustered way or not at
all, but rarely in between these two extremes. We also studied the k-closures of certifications and
transactions and found that users tend to certify back faster than they tend to make a backward
transaction, meaning that certification relationships seem to become bi-directional faster than
transactions.
We want to stress out that these results might be specific to this particular cryptocurrency
and should not be considered as general principles. Indeed, G̃1 is still very young and used mostly
by currency-interested people, such that most transactions occur, for the moment, during special
social events where members meet and welcome new users. As the currency will age, we expect that
transactions will occur in a less socially confined way (through exchange platforms for example),
and that time will play a more central role in the study of the interplay between social ties and
interactions.
Several directions for future work exist. First, more advanced stream graph concepts may help
understanding the structure of blockchain based systems better. Another interesting direction
14would be to compare the properties of G̃1 with other social systems with transactions, like for
instance Steemit [4]. We believe that these blockchain based systems will become more and more
present and will provide fascinating data sources for such studies.
Acknowledgements
The authors would like to thank Hugo Trentesaux for his help. This work is funded in part by the
ANR (French National Agency of Research) under the FiT LabCom grant.
References
[1] Cloob. https://www.cloob.com. Accessed: 2019-08-20.
[2] G1 blockchain explorer. https://g1.duniter.fr/#/app/blockchain/search. Accessed:
2019-08-20.
[3] G1 wot visualisation tool. https://wotmap.duniter.org/#. Accessed: 2019-08-20.
[4] Steem, an incentivized, blockchain-based, public content platform. 6 2018.
[5] Walid Al-Saqaf and Nicolas Seidler. Blockchain technology for social impact: opportunities
and challenges ahead. Journal of Cyber Policy, pages 1–17, 11 2017.
[6] Rémy Cazabet, Rym Baccour, and Matthieu Latapy. Tracking bitcoin users activity using
community detection on a network of weak signals. In Chantal Cherifi, Hocine Cherifi, Márton
Karsai, and Mirco Musolesi, editors, Complex Networks & Their Applications VI, pages 166–
177, Cham, 2018. Springer International Publishing.
[7] David J. Crandall, Lars Backstrom, Dan Cosley, Siddharth Suri, Daniel Huttenlocher, and
Jon Kleinberg. Inferring social ties from geographic coincidences. Proceedings of the National
Academy of Sciences, 107(52):22436–22441, 2010.
[8] Benoit Lavenier et al. Duniter 1 client. https://g1.duniter.fr/, 2017–2019.
[9] Srirath Goi Gohwong. The state of the art of top 20 cryptocurrencies. Asian Administration
and Management Review, 1(1), 1 2018.
[10] Garrick Hileman and Michel Rauchs. Global cryptocurrency benchmarking study. 4 2017.
[11] Desislava Hristova, Chloë Noulas, Anastasiosand Brown, Mirco Musolesi, and Cecilia Mascolo.
A multilayer approach to multiplexity and link prediction in online geo-social networks. EPJ
Data Science, 5(1):24, 2016.
[12] H. Khosravi, A. Bozorgkhan, and O. Schulte. Transaction-based link strength prediction in
a social network. In 2013 IEEE Symposium on Computational Intelligence and Data Mining
(CIDM), pages 191–198, April 2013.
[13] Young Bin Kim, Jun Gi Kim, Wook Kim, Jae Ho Im, Tae Hyeong Kim, Shin Jin Kang,
and Chang Hun Kim. Predicting fluctuations in cryptocurrency transactions based on user
comments and replies. PLOS ONE, 11(8):1–17, 08 2016.
[14] Dániel Kondor, Márton Pósfai, István Csabai, and Gábor Vattay. Do the rich get richer? an
empirical analysis of the bitcoin transaction network. PloS one, 9:e86197, 02 2014.
[15] Stephane Laborde. Relative theory of money.
[16] Matthieu Latapy, Clémence Magnien, and Tiphaine Viard. Weighted, bipartite, or directed
stream graphs for the modeling of temporal networks. CoRR, abs/1906.04840, 2019.
15[17] Matthieu Latapy, Tiphaine Viard, and Clémence Magnien. Stream graphs and link streams
for the modeling of interactions over time. Social Network Analysis and Mining, 8, 10 2017.
[18] Damiano Di Francesco Maesa, Andrea Marino, and Laura Ricci. The bow tie structure of the
bitcoin users graph. Applied Network Science, 4(1):56, 2019.
[19] David Martens and Foster Provost. Pseudo-social network targeting from consumer transac-
tion data. 09 2011.
[20] Sarah Meiklejohn, Marjori Pomarole, Grant Jordan, Kirill Levchenko, Damon McCoy, Geof-
frey M. Voelker, and Stefan Savage. A fistful of bitcoins: Characterizing payments among men
with no names. In Proceedings of the 2013 Conference on Internet Measurement Conference,
IMC ’13, pages 127–140, New York, NY, USA, 2013. ACM.
[21] Satoshi Nakamoto. Bitcoin: A peer-to-peer electronic cash system, 2009.
[22] MK. Popuri and Gunes MH. Empirical analysis of crypto currencies. 644, 2016.
[23] Chris Rose. The evolution of digital currencies: Bitcoin, a cryptocurrency causing a monetary
revolution. International Business and Economics Research Journal (IBER), 14:617, 07 2015.
[24] V.A. Zelizer. Sociological Forum, 11(3), 1996.
16You can also read