Urban Planning Academics and Twitter: Who and what?
←
→
Page content transcription
If your browser does not render page correctly, please read the page content below
Urban Planning Academics
and Twitter: Who and what?                                                                 RESEARCH

THOMAS W. SANCHEZ

ABSTRACT                                                                                   CORRESPONDING AUTHOR:
                                                                                           Thomas W. Sanchez
Twitter has increasingly become a resource used by academics to share scholarship          Virginia Tech, US
and opinions within professional networks. This paper presents a descriptive analysis
                                                                                           sanchezt@vt.edu
of Twitter use by urban planning faculty, reporting characteristics of users, the topics
posted, and indicators of Twitter influence among urban planning faculty as well as
those interested in planning from outside academic circles. Approximately one-third of
                                                                                           KEYWORDS:
urban planning academics are active Twitter users, and as of yet, there have been no
                                                                                           planning; academic; Twitter;
empirical analyses of how and why they use the social media platform. This analysis        social media
uses Twitter data from active accounts for urban planning faculty in the U.S. and
Canada identified as being used for professional purposes for the period from March
                                                                                           TO CITE THIS ARTICLE:
2007 to April 2019. Considering how planning academics use Twitter lends insights on       Sanchez, T. W. (2021). Urban
its usefulness for academic discussion and scholarly communications. The conclusion        Planning Academics and
discusses the prospects for planning academics to better utilize Twitter to broaden        Twitter: Who and what?
and deepen their professional activities while noting particular concerns.                 Journal of Altmetrics, 4(1): 3.
                                                                                           DOI: https://doi.org/10.29024/
                                                                                           joa.41
INTRODUCTION Sanchez
Journal of Altmetrics
2
DOI: 10.29024/joa.41
In the broadest sense, the business of universities is to generate knowledge. At the same time,
institutional missions are continually evolving as the role of higher education is questioned
and publicly debated (Roth 2014; Sörlin & Vessuri 2007). One common notion is that faculty
concentrate on discovery through research, teaching, and outreach. These three areas are not
mutually exclusive because research is intended to inform instruction and enhance outreach to
the broader community. Service activities are sometimes viewed as opportunities for research
as well. A faculty member’s research efforts and emphasis are in large part determined by the
promotion and tenure process at their institutions, which often prioritize research productivity
and academic reputation (Weller, Dröge, & Puschmann 2011). While productivity and reputation
are important, there is no agreement on metrics. Consequently, there is a continued reliance on
outmoded means of evaluation, which undermine processes to identify meritorious performance
and therefore knowledge generation in service to society (Schimanski & Alperin 2018). The
emergence of social media has created new methods for academics to engage in research
processes, generate new forms of collaboration, and communicate their scholarly outcomes.
However, there is no evidence, as of yet, that social media activities have impacts on productivity
(positive or negative) or have meaningful impacts on scholarly reputation. Nevertheless, these
are likely motivations for participating on social media platforms such as Twitter.
This paper explores one such form of social media activity by urban planning academics. This
study is the first to examine how Twitter is used by urban planning academics in the U.S. and
Canada. Following a brief review of literature on academics’ use of social media and Twitter,
this paper examines who among urban planning academics is using Twitter and how they are
using it. The analysis identifies prominent users, both academic and non-academic, to provide
a glimpse of the planning Twitter microcosm. Based on the literature and descriptive analysis,
the paper concludes by suggesting how social media (particularly Twitter) can better serve
planning academics. It is very likely that social media (in some form) will endure and be an
increasingly significant dimension of academic activities.
LITERATURE REVIEW
As with the internet, some scholars predicted a revolution of information sharing via social media
with far-reaching benefits to society (Hilbert & Lopez 2011; Nie & Erbring 2002), while others
warned of an increase in conformity through social influence (Bargh & McKenna 2004; Creeber
& Martin 2008). Higher education has traditionally had limited communication channels with
the general public, so social media represents a significant change, and perhaps an opportunity
in this regard. Recent evidence points to the intersection of influence and persuasion on social
media in propagating ‘fake news’ and other unreliable information (Allcott & Gentzkow 2017)
along with trolling and inappropriate language common to online commentary (Schweitzer
2014). Nonetheless, social media has provided an added dimension of scholarly communication
over the past decade, with academics being encouraged to develop their reputations to gain
increased visibility in their respective fields. Not only are academics expected to publish,
teach, and perform service and outreach, but now more than ever, they are urged to promote
these activities both within and beyond their institutions, all with little training or institutional
resources (Weller 2011).
There is a growing literature on how and why academics use social media platforms like
Twitter. Analyses of whole academic disciplines are rare because data collection is difficult due
to no standard user identification mechanisms to help match user names with accounts. Name
disambiguation is a challenge for scholarly publications as well, where multiple people share
the same first and last name. This likely explains why there are so few empirical analyses for
whole disciplines and why most rely on sparse sampling (see Priem & Costello 2010; Thelwall
et al. 2013). ORCID and ResearcherID represent efforts to address the challenge of author
identification by establishing protocols that link authors, affiliations, and scholarly products.
These are voluntary systems, and it is unclear how many academics are using them. Besides,
there are relatively few studies about social media usage by academics due to slow adoption
and somewhat low levels of social media usage by academics. This is likely to change with new
generations of academics (i.e., digital natives) who are accustomed to digital communications.
There is also a publication lag for articles to appear in peer-reviewed journals, which affectsthe availability of recent evaluations as well. It can take a journal article a minimum of a year Sanchez 3
Journal of Altmetrics
between the time of submission and when it appears in print or as a pre-print online version. DOI: 10.29024/joa.41
Papers (such as this one) rely on snapshots of social media activity that reflect a specific
timeframe. The following discusses some of the literature that provides a useful foundation
with regards to how and why academics use Twitter.
Academics’ use of Twitter falls into four general categories. These include communications
(Carpenter & Krutka 2014), professional development (Carpenter & Krutka 2014), self-promotion
through building a public profile (Hall 2014) and engaging in ‘digital identity and impression
management’ (Veletsianos & Kimmons 2013: 44). Kassens-Noor (2012) and Carpenter and
Krutka (2014) discuss the potential of Twitter for class instruction, but there remains little
evidence or evaluation of these activities. Most of these connect with promotion and tenure
criteria that emphasize external visibility not previously utilized by academics (Schimanski &
Alperin 2018). It is clear that these uses of social media have little or no scholarly value in
themselves, but they are increasingly becoming an extension of scholarly activities. Some
universities, through their promotion and tenure guidelines, are placing value on faculty social
media participation, primarily for university public relations (see Cabrera et al. 2017; Gruzd,
Staves, & Wilk 2011; O’Meara 2016).
Other online platforms used by urban planning academics include LinkedIn, ResearchGate,
Academia.edu, and Mendeley. LinkedIn’s primary purposes are to promote public profiles and
networking, with a different kind of ‘social’ compared to Twitter (Baruffaldi, DiMaio, & Landon
2017). Although LinkedIn is also used for information sharing, most of this communication is
oriented to professional activities (Skeels & Grudin 2009). Other sites, such as ResearchGate,
Academia.edu, Mendeley, and Social Science Research Network (SSRN), are primarily used to
share publications with relatively limited accompanying social engagement. Both Google Scholar
and Microsoft Academic are academic profile sites with search capabilities for publications and
author metrics. These sites generally serve the least social function among those mentioned
above but are increasingly becoming more widely used among academic disciplines (Martín-
Martín, Orduña-Malea, & López-Cózar 2016).
The capabilities of Twitter to increase communications will likely continue to evolve across
disciplines, platforms, and purposes. Of particular benefit to planning is to broaden and
increase the volume of planning-related discourse. Megele (2014) and Gruzd, Wellman, and
Takhteyar (2011) discuss the conversational and ‘chat’ dimensions of Twitter, as well as the
virtual community-building (whether real or imagined). These conversations also combine ‘real
life’ and virtual forums when Twitter is used in connection with academic conferences. These
conversations can extend the reach of conferences in space and time, along with creating
‘backchannel’ communications (Li & Greenhow 2015; Weller, Dröge, & Puschmann 2011).
It is assumed that urban planning academics use Twitter in similar ways as other academics in
the social sciences, but it is difficult to make direct comparisons because complete datasets like
those used here are not available for other disciplines. Also, planning academics’ use of Twitter
cannot be compared to that of planning practitioners because of the significant differences in
their professional roles and responsibilities. Urban planning practitioners use Twitter in planning
activities such as gathering data about residents’ perceptions, gathering geo-tagged data
about location or movement patterns, and decision support (Hollander et al. 2016; Shelton et
al. 2015). Applications that integrate social media and urban planning have the potential to
grow if participation by planners and citizens increases. In this sense, Twitter can serve as a
communications tool to facilitate public involvement activities (Lopez-Ornelas 2017). Several
studies have focused on social media (Twitter particularly) to enhance participatory planning
activities (see Evans-Cowley and Hollander 2010; Nummi 2019). The challenge remains to
evaluate these efforts and assess the transferability to different places and circumstances.
METHODOLOGY
To examine Twitter usage by planning academics, data for this analysis were obtained from
two primary sources. A list of urban planning faculty names from over 100 universities across
the U.S. and Canada maintained by Sanchez (see Sanchez 2017) was searched on Twitter to
find associated accounts. Accounts were then reviewed to determine if they were used forprofessional or personal purposes. Accounts were assumed to be used for professional purposes Sanchez 4
Journal of Altmetrics
if the user profile contained a professional title (e.g., professor), mentioned urban planning or DOI: 10.29024/joa.41
an area of expertise (e.g., transportation, housing, environment), or mentioned an employer’s
name (i.e., university name or department). In some cases, accounts were included when these
criteria were not met but the content of tweets was related to urban planning issues. In the
case where someone had multiple accounts (such as a personal account and a professional
account), the personal account would be excluded because it would not meet the criteria above.
The proportion of planning academics using Twitter was in the range of 30% to 35%, which was
similar to that found by Mohammadi et al. (2018) for academics in science-related disciplines.
A total of 323 Twitter accounts were identified from the list of 1,104 urban planning faculty.
Lists of profiles, tweets, followers, and friends were obtained through the Global Event and Trend
Archive Research (GETAR) project at Virginia Tech.1 This included all account activity from March
2007 to April 2019. The first part of the analysis focused on general characteristics of faculty
using Twitter, including the age of accounts, frequency of participation, and user-engagement
levels. These types of characteristics were also considered relative to academic rank. In addition,
the study examined the types of Twitter content being shared by planning academics, primarily
by tweet topics. Content analysis of hashtags and text was used to identify the topics. It should
be noted that tweets often include abbreviations, slang, and jargon, with abbreviations being
commonly used due to the 140-character limit on tweets (Lee et al. 2011). Tweets can be
original content or recirculated information that can include images, weblinks, hashtags, and
mentions of other Twitter users. While the combination of these elements provides richness
beyond that of natural language, assessing all of these types together is complex and the
subject of ongoing research (Kireyev, Palen, & Anderson 2017).
The text analysis process used NVivo which discovered the most frequent unigrams and bigrams
(single- and double-word combinations) to create the 34 topic labels shown in Table 1. The
set of tweets was then labeled using each of these topics. This resulted in over 35,000 topics
or themes that were associated with 95% of the tweets. A multi-label classification process
resulted in 24,315 total unique combinations using the 34 individual labels.
Table 1 Topic labels.
Access Food Planning
Analysis Future Policy
Change Geography Real Estate
City Government Scholarship
Community Health Service
Data Historic Social
Design Housing Space
Development Land Sustainable
Economic Legal Technology
Education Media Transportation
Environment Place Urban
Other
The next part of the analysis examined the network aspects of Twitter users. Network analysis
characterizes users relative to their connections with other Twitter users. Users at the center of
the network are assumed to have more influence because they have more extensive network
connections or are connected to more nodes within a network (Williamson & Ruming 2016).
Because Twitter data for this analysis were obtained at a single point in time, the results
represent a snapshot of an otherwise dynamic set of relationships. Users continually add and
remove followers and friends which means that patterns of activity change over time. Network
statistics are used to understand the structure of these connections. Gephi, an open-source
network analysis and visualization tool was used to analyze faculty connections.
1 National Science Foundation projects IIS-1619028 and 1619371.Relationships between users are not necessarily mutual but are based on whether someone is Sanchez 5
Journal of Altmetrics
a follower or is being followed, thus creating a directed network. One account following another DOI: 10.29024/joa.41
creates an ‘in-degree’ connection for the first (a follower). When an account follows another
account, an ‘out-degree’ connection results. When users follow each other, both in- and out-
degree connections result. Following or friending creates ‘edges’, or connections between users
or nodes. The more times a user is followed, the higher their ‘degree’, or prominence in the
network (see Riddell et al. 2017; Riquelme & González-Cantergiani 2016). Alongside degree,
‘betweenness centrality’ is another measure of node connectivity. This differs from ‘degree
centrality’ because a node with a high level of connectivity may not have many edges but may
serve as a bridge that otherwise connects dispersed nodes or clusters in the network. In the
case of this analysis, nodes with high betweenness centrality are users who span or connect
other users who are separated by areas of interest.
This descriptive analysis focused on the general characteristics of users who are urban planning
faculty and the content they generated. The objective was to illustrate patterns among users
as well as topics of interest.
RESULTS
As mentioned earlier, 323 of the 1,104 selected urban planning faculty had Twitter accounts.
Of those with accounts, 20 had not yet tweeted, but all of them had followers and friends. The
earliest planning faculty Twitter account was established in 2007, and it appears that adoption
by planning faculty peaked in 2012, with 55 faculty joining that year, down to an estimated 10
to 15 who joined in 2019 (see Figure 1).2
Figure 1 Year urban planning
faculty joined Twitter.
Currently, the average academic urban planning Twitter user has been on the platform for 6.5
years, tweets an average of 20 times per month, and has over 1,000 followers and 465 friends
(see Table 2). One account is an outlier with over 128,000 followers, which, when excluded from
the sample, lowers the mean number of followers to 655 (median of 203). The account with
the next highest number of followers has over 20,000, and only one other account has more
than 10,000 followers. In terms of rank, faculty engagement on Twitter is relatively similar, with
just over 100 assistant, associate, and full professors. On average, full professors tweet more
often and have higher numbers of followers, irrespective of whether the outlier is included in
the sample or not. In terms of influence, the followers-to-friends ratio is also highest for full
professors, which would be expected because rank is somewhat based on scholarly reputation
2 The earliest Twitter adopter among planning faculty was Alan Lew, who joined approximately one year
after Jack Dorsey’s first tweet of, ‘Just setting up my twttr’ (‘Twttr’ was the original name of Twitter) on March
21, 2006. Lew’s first tweet was, “trying to stay awake and get some work done on my computer—I think I will
take a nap” (3-24-07).within the field (Yan, Zhang, & Bromfield 2018). A large number of followers usually indicates Sanchez 6
Journal of Altmetrics
that a user is generating consistent, original, and quality content while not spending much time DOI: 10.29024/joa.41
or attention on other accounts (Prada & Iglesias 2020).
TWITTER ENGAGEMENT
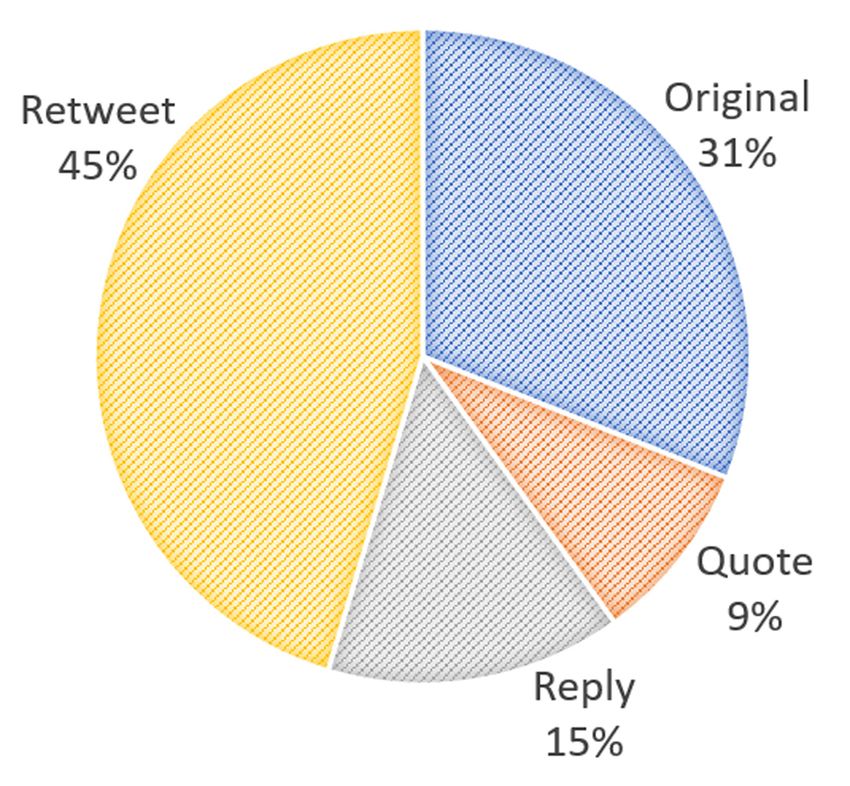
Tweet content can take multiple forms based on the user’s objective. Twitter classifies
individual tweets as “original”, “quote”, “reply”, and “retweet”. Original tweets are composed
by the author using their content and may include web links, hashtags, or images. Quotes are
tweets comprised of text from another user’s tweet. Replies are tweets directed at other Twitter
users, who are identified by their user name. Retweets are previously posted content that is
then shared in a user’s Twitter feed. Of the 258,872 tweets from urban planning faculty being
analyzed here, nearly half were retweets, with 7 of 10 being retweets, quotes, and replies (see
Figure 2). In other words, most of the urban planning faculty’s Twitter activity was not original
content. This compares to overall tweet characteristics being approximately 30% retweets,
20% replies, and the rest (original and quotes) representing 50% of the content. Retweeting
volumes have increased significantly on Twitter over the past 10 years, increasing from about
20% to over 50%. The rate of replies has been gradually declining, from over 25% to just under
20% (Leetaru 2019).
Results from a Pew Research Center (2019) report show that 10% of all Twitter users create 80%
of all tweets. On average, these top 10% tweet 138 times per month (median) compared to 3.3
for all planning faculty. The top 10% of accounts also have a median of 456 accounts followed,
which compares to a median of 203 followers and a median of 179 friends for planning faculty
(Wojcik & Hughes 2019). The differences between the mean and median levels indicate the
degree of skewness in the data.
Table 2 Descriptive statistics
POSITION N MEAN STD. DEV. MEDIAN
by academic rank.
All Professors Account age (mos.) 323 78.1 32.4 81.1
No. of Tweets 323 1,809.5 6,920.8 219.0
No. of Followers 323 1,051.0 7,322.2 203.0
No. of Friends 323 465.1 903.9 179.0
Followers-to-friends ratio 319 3.2 11.8 1.0
Tweets per month 323 20.4 69.8 3.3
Assistant Professor Account age (mos.) 116 77.8 30.7 79.8
No. of Tweets 116 1,299.9 3,117.2 298.5
No. of Followers 116 405.7 549.9 238.0
No. of Friends 116 491.9 767.1 284.5
Followers-to-friends ratio 115 1.2 1.5 0.8
Tweets per month 116 14.6 30.4 4.5
Associate Professor Account age (mos.) 105 73.9 36.1 80.2
No. of Tweets 105 1,493.8 4,313.0 267.0
No. of Followers 105 642.8 2,081.5 204.0
No. of Friends 105 435.4 786.6 191.0
Followers-to-friends ratio 102 2.3 7.4 1.0
Tweets per month 105 18.9 44.3 4.0
Professor Account age (mos.) 102 83.0 29.9 84.5
No. of Tweets 102 2,714.0 11,011.7 111.5
No. of Followers 102 2,205.0 12,811.2 191.0
No. of Friends 102 465.2 1,138.3 115.0
Followers-to-friends ratio 102 6.5 19.1 1.4
Tweets per month 102 28.5 111.2 1.7Sanchez 7
Journal of Altmetrics
DOI: 10.29024/joa.41
Figure 2 Planning faculty
tweet types.
TWEET TOPICS
One way to identify tweet topics is by analyzing hashtags. Hashtags are assigned by users
posting content and serve as keywords. Of the 258,872 total tweets, nearly 75% (192,693)
lacked hashtags. Of the 66,179 tweets with hashtags, there were a total of 100,569 hashtags
assigned (an average of 1.5 per tweet). Using hashtags is intended to identify relevant topics
so that other Twitter users can locate conversations of potential interest. There were 27,354
unique hashtags used by planning academics, with 9,330 of those being used more than once.
The most frequently used hashtags were #climatechange, followed by #planning, #cities,
#urbanplanning, and #smartcities (see Table 3). It is interesting to note that Mohammadi et al.
Table 3 Twenty most popular
HASHTAG FREQUENCY PERCENT
hashtags.
Climatechange 727 0.7
Planning 724 0.7
Cities 707 0.7
Urbanplanning 661 0.7
Smartcities 616 0.6
Technicity 526 0.5
Bigdata 482 0.5
Urban 442 0.4
Opendata 417 0.4
Climate 413 0.4
Data 410 0.4
Resilience 396 0.4
TRBam 374 0.4
Sustainability 347 0.3
Justsustainabilities 342 0.3
Housing 335 0.3
NYC 323 0.3
ASPA2019 310 0.3
Toronto 289 0.3
Gentrification 284 0.3(2018) also found climate change as the most frequent Twitter topic among science-related Sanchez 8
Journal of Altmetrics
disciplines. The hashtag frequencies are only for individual appearances and do not account DOI: 10.29024/joa.41
for hashtags used in combination, so while #urbanplanning was the fourth most frequently
used hashtag, #planning (724 appearances) and #urban (442 appearances) may have been
used in combination with the same meaning. However, it is difficult to determine the user’s
intention when using single or combined hashtags. As a result, they are analyzed separately
here.
The hashtags in Table 3 appeared across a relatively small proportion of tweets, with none
exceeding 1% and the top 20 representing less than 9% of all tweets. Of these 20 hashtags,
15 are planning-related topics, 2 are conferences, 2 are places, and 1 is an online class. These
provide some evidence about topics of interest, but as was previously mentioned, many tweets
did not include hashtags, so using these is less than ideal for characterizing overall themes. On
the other hand, nearly all tweets contained text. The text within tweets was mined to extract
frequently occurring terms. The most frequent label was “other”, which captures most of the
non-planning-related and personal tweets (see Table 4). These tweets contained none of the
terms identified using text mining, which are shown in Table 1. The next most frequent labels
were for ‘place’ (3.5%), ‘social’ (3.0%), ‘scholarship’ (2.3%), and ‘economic’ (2.0%), for a total of
28,110 tweets, or about 11%.
Table 4 Most frequent tweet
LABEL FREQUENCY PERCENT
topics (labels).
Other 54,014 20.9
Place 9,066 3.5
Social 7,820 3.0
Scholarship 5,999 2.3
Economic 5,225 2.0
Education 4,893 1.9
Environment 4,752 1.8
Government 2,995 1.2
Place, Social 2,339 0.9
Planning 2,201 0.9
Environment, Scholarship 2,078 0.8
Environment, Place 2,028 0.8
City 1,776 0.7
Land 1,708 0.7
Transportation 1,498 0.6
Economic, Social 1,454 0.6
Housing 1,382 0.5
Urban 1,338 0.5
Economic, Place 1,323 0.5
Scholarship, Social 1,308 0.5
In terms of the overall frequency of individual labels, the top 20 represented most of those
appearing in the multiple label categories listed in Table 4. The most frequent single term
was ‘place’, followed by ‘social’, ‘scholarship’, ‘economic’, ‘education’, and ‘environment’. As
mentioned earlier, these terms represent clusters of related unigrams and bigrams analyzed
during the text mining process. For instance, ‘place’ includes terms like United States, Canada,
Toronto, California, and New York City. The label ‘social’ includes terms like people, women, kids,
children, and family. Unlike hashtags, these labels represent groups of related terms.MENTIONS Sanchez 9
Journal of Altmetrics
An analysis of user mentions in tweets can be an indicator of topics being discussed as well DOI: 10.29024/joa.41
as potential influence. Whenever a user name (preceded by an @ symbol) is part of a tweet,
it acknowledges a user or usually one of their tweets. We can assume that accounts that are
mentioned frequently gain attention as a result of the content or frequency of their tweets.
Examining the top 20 most frequently mentioned accounts indicates nine professors (seven
from planning), seven organizations (planning or news), two planning programs, one planner
(consultant), and one doctoral student (see Table 5). While @CityLab had the most mentions
(1,549), these, while still noteworthy, represent only a very small fraction of the 328,568 total
mentions.
Table 5 Top mentions.
HASHTAG FREQUENCY PERCENT
CityLab 1,549 0.5
drschweitzer 1,411 0.4
frankjamespopep 1,387 0.4
DarrickHamilton 1,195 0.4
nytimes 1,122 0.3
RYSURP 956 0.3
julianagyeman 861 0.3
USCPrice 830 0.3
FJPopper 814 0.2
SandyDarity 739 0.2
surlyurbanist 702 0.2
BrentToderian 695 0.2
NextCityOrg 683 0.2
planetizen 680 0.2
TheEconomist 678 0.2
ananyaUCLA 666 0.2
DanImmergluck 649 0.2
Rkeil 649 0.2
The_ACSP 620 0.2
APA_Planning 588 0.2
NETWORKS AND INFLUENCERS
In addition to topics of interest being shared on Twitter, this study also considered the network
of users. The primary group of users is urban planning faculty; however, all of them are
connected to followers and friends. Network analysis methods were used to examine how
urban planning faculty were connected to other users. Overall, the 323 urban planning faculty
with active Twitter accounts had a total of 336,822 followers. Table 6 lists the top 10 non-faculty
followers, which are the accounts from outside the group of 323 planning faculty. The followers
are composed of three organizations, three outside professors/instructors, three students, and
one academic planning publication.
Table 6 Top 10 non-faculty
USER NAME FREQUENCY
followers.
The_ACSP 92
Erualdo 65
soplacers 63
nlamontagne 62
WrayAJ 56Sanchez 10
USER NAME FREQUENCY Journal of Altmetrics
DOI: 10.29024/joa.41
DanImmergluck 55
amariearbis 54
JPER7 53
huyenkle 52
UCBDisplacement 51
Planning faculty followed (i.e., friended) 148,310 other user accounts, some of which were other
urban planning faculty. The list of the top 10 Twitter accounts being followed in comprised of
six planning-related news or research organizations and one news organization, along with APA
and ACSP (the professional organizations for planning professionals and planning academics,
see Table 7).
Table 7 Top 10 urban planning
FRIEND FREQUENCY
faculty Twitter friends.
Planetizen 150
CityLab 149
BarackObama 125
APA_Planning 108
NextCityOrg 107
Nytimes 107
The_ACSP 100
CitiesResearch 87
UrbanLandInst 87
Urbaninstitute 78
The network analysis provided additional metrics to assess Twitter users’ relative influence
according to their position in the network. The Twitter data used here result in a directed
network because following and friending imply a type and direction of connection for each
faculty member. The number of followers is the ‘in-degree’, and the number of friends is the
‘out-degree’. The ‘weighted degree’ incorporates ties that are shared between nodes or users.
The top 10 users by weighted degree are shown in Table 8. These only include urban planning
faculty because the full data of their followers and friends were not included. The original data
were based on a single degree of separation between urban planning faculty and their followers
and friends. Assuming an average of 100 unique followers and friends, this would mean more
than an additional 33,600,000 users or nodes in the network.
Table 8 Top 10 network
LABEL WEIGHTED DEGREE
weighted degree.
DrBobBullard 27,782
DarrickHamilton 23,950
Drschweitzer 10,672
ananyaUCLA 10,151
FreeBlackTX 7,721
pittman17 7,015
Rkeil 6,738
Julianagyeman 6,612
Pjrplan 6,089
Tomwsanchez 5,269Another network metric that indicates the relative level of influence is ‘betweenness Sanchez 11
Journal of Altmetrics
centrality’. While the number of total connections (degree) implies overall network DOI: 10.29024/joa.41
connectivity, the location in the network relative to the connectedness of followers and
friends indicates that nodes or users with high measures of betweenness centrality serve
as hubs or bridges between regions and are critical to the flow of information. Betweenness
centrality is calculated as the number of shortest paths between all nodes on the network of
selected users (337,0002 or 1.1 × 10¹¹). Given the vastness of the network, even the users with
the highest betweenness centrality (above 5,000,000) are on the shortest path between only
0.006% of all Twitter users. This indicates a dispersed network without significant clustering
or density generated by planning academics (see Table 9). This is not surprising given the
small numbers of planning academics.
Table 9 Top 10 network
LABEL BETWEENNESS CENTRALITY
betweenness centrality.
Drschweitzer 6,688,325
Tomwsanchez 6,662,607
DrBobBullard 5,848,058
DarrickHamilton 4,964,018
ananyaUCLA 3,930,584
pittman17 2,627,553
Cschively 2,510,091
AlexKarner 2,158,646
Rkeil 2,101,148
Rgoodspeed 2,073,364
SUMMARY
Urban planning is a small academic discipline with about 1,100 faculty and just over 100
academic programs in the U.S. and Canada. Of these 1,100, approximately one-third actively
use Twitter. There are no other empirical analyses of disciplines allied with planning, such as
public administration, urban studies, and public policy, so it is difficult to say how the patterns
exhibited by planning faculty compare to other disciplines. Beyond the 323 urban planning
faculty, the data suggest that over 300,000 other users are interested in what urban planning
faculty share on the platform. It can be assumed that the Twitter network of these users extends
beyond these 300,000 when considering additional followers and friends not accounted for in
this analysis. An estimate is that in the range of 1,000,000 Twitter users are interested in urban-
planning-related topics within two degrees of separation from the most popular accounts, like
NextCity, Planetizen, CityLab, and APA.
The rate of Twitter adoption by urban planning academics has declined and appears to be
approaching a plateau. The results show that about one-third of tweets from planning faculty
have original content, with most of the tweets being recycled from other accounts. The results
also show that hashtags are not a reliable way to track tweet topics because they are not used
on a uniform basis. Of the tweets with hashtags, the popular themes were related to climate
change, cities, planning, technology, and data. A more complete analysis of tweet content
involved labeling topics through text analysis. The resulting set of planning-related themes was
similar to that found by Sanchez and Afzalan (2017). Excluding personal topics, tweets about
places, social dynamics, economy, and environment were most frequent, along with topics
related to scholarship and education.
The core network for urban planning faculty using Twitter is small but, as noted earlier, becomes
notably more extensive when considering second- and third-degree connections. The network
analysis shows influential faculty as well as organizations who share information on planning-
related topics. However, the focus on the connections of the 323 urban planning faculty, as
opposed to a more complete network, represents a limitation of this study. On the other hand,
non-academic accounts such as Planetizen (73,000 followers), CityLab (216,000 followers),
APA (53,000 followers), and NextCity (114,000 followers) appear to be the most significantinfluencers on urban-planning-related topics. This is somewhat expected because faculty tend Sanchez 12
Journal of Altmetrics
to have narrowly defined areas of expertise, while these organizations share information on a DOI: 10.29024/joa.41
broad range of topics frequently.
CONCLUSIONS
This paper began by broadly establishing the context for faculty use of social media platforms
such as Twitter. So far, there is little or no evidence to suggest that Twitter posts represent
significant contributions to research, teaching, or academic service activities. However, this is
not to say that Twitter posts cannot support each of these three areas. The evidence indicates
that urban planning faculty using Twitter are engaging in conversations about urban-planning-
oriented scholarship and education. Drawing on some key characteristics of Twitter activities,
the results suggest that they use the platform to exchange ideas and opinions with colleagues
and non-professionals interested in planning topics.
The analysis reported here is limited by the nature of Twitter communications. The character
limit on tweets makes context and motivation difficult to discern. This may be addressed by
analyzing Twitter discussion threads (multiple connected tweets) rather than individual tweets.
However, context is a lingering challenge for text mining techniques. Additionally, this study’s
narrow focus on the core group of planning faculty users could be expanded to include the
full constellation of connections, tweets, and characteristics of all 337,000 users connected to
urban planning faculty.
As noted earlier, the academic urban planning presence on Twitter is a small piece of the urban
planning landscape. More prominent connections may occur through information sharing by
organizations such as CityLab, NextCity, APA, and Planetizen. While speculative, this finding is
worthy of further research to identify the degree to which Twitter facilitates planning academic
and planning practitioner dialogue. Such interaction may be concentrated on other social
media platforms such as Facebook. Facebook includes interest groups that engage academics
and professionals, including those with interests focused on urban design, transportation, new
urbanism, and the like. The activity across these platforms and other social media sites would
also be an interesting topic of future research. Two particular concerns about academic uses
of social media include: 1) the large volume of misinformation and incivility on these sites (see
Oz, Zheng, & Chen 2018) and 2) the time cost and addictive properties of social media (see
Donelan 2016). The first of these has received a significant amount of attention, whereas the
expanding amount of professional time being used in off hours is uncompensated and the
equivalent of overtime. The personal effects of these two issues represent important areas for
future research that are associated with the personal and professional impacts of social media
for academics.
The benefits of Twitter for planning faculty are potentially related to scholarly communications,
network building, and expanding the classroom experience. Previous research has examined
these applications for other academic disciplines, but none to date for urban planning. Along
with the data examined in this analysis, more can be learned about personal expectations and
experiences through additional data collection, such as survey research, directly from planning
faculty.
ACKNOWLEDGEMENTS
The author would like to thank Ziqian (Alice) Song for her assistance with Twitter data
acquisition. Thanks also to Rachel Miles, Huston Gibson, Nathaniel Porter, and two anonymous
reviewers for their comments and suggestions.
AUTHOR AFFILIATION
Thomas W. Sanchez orcid.org/0000-0002-8259-0088
Virginia Tech, US
COMPETING INTERESTS
The author has no competing interests to declare.REFERENCES Sanchez
Journal of Altmetrics
13
Allcott, H., & Gentzkow, M. (2017). Social media and fake news in the 2016 election. Journal of Economic DOI: 10.29024/joa.41
Perspectives, 31(2), 211–36. DOI: https://doi.org/10.1257/jep.31.2.211
Bargh, J. A., & McKenna, K. Y. (2004). The Internet and social life. Annual Review of Psychology, 55,
573–590. DOI: https://doi.org/10.1146/annurev.psych.55.090902.141922
Baruffaldi, S. H., Di Maio, G., & Landoni, P. (2017). Determinants of Ph.D. holders’ use of social networking
sites: An analysis based on LinkedIn. Research Policy, 46(4), 740–750. DOI: https://doi.org/10.1016/j.
respol.2017.01.014
Cabrera, D., Vartabedian, B. S., Spinner, R. J., Jordan, B. L., Aase, L. A., & Timimi, F. K. (2017). More than
likes and tweets: Creating social media portfolios for academic promotion and tenure. Journal of
Graduate Medical Education, 9(4), 421–425. DOI: https://doi.org/10.4300/JGME-D-17-00171.1
Carpenter, J. P., & Krutka, D. G. (2014). How and why educators use Twitter: A survey of the field. Journal
of Research on Technology in Education, 46(4), 414–434. DOI: https://doi.org/10.1080/15391523.201
4.925701
Creeber, G., & Martin, R. (2008). Digital Culture: Understanding New Media: Understanding New Media.
McGraw-Hill Education (UK).
Donelan, H. (2016). Social media for professional development and networking opportunities in
academia. Journal of Further and Higher Education, 40(5), 706–729. DOI: https://doi.org/10.1080/030
9877X.2015.1014321
Evans-Cowley, J., & Hollander, J. (2010). The new generation of public participation: Internet-based
participation tools. Planning Practice & Research, 25(3), 397–408. DOI: https://doi.org/10.1080/02697
459.2010.503432
Gruzd, A., Staves, K., & Wilk, A. (2011). Tenure and promotion in the age of online social media.
Proceedings of the American Society for Information Science and Technology, 48(1), 1–9. DOI: https://
doi.org/10.1002/meet.2011.14504801154
Gruzd, A., Wellman, B., & Takhteyev, Y. (2011). Imagining Twitter as an imagined community. American
Behavioral Scientist, 55(10), 1294–1318. DOI: https://doi.org/10.1177/0002764211409378
Hall, N. (2014). The Kardashian index: A measure of discrepant social media profile for scientists. Genome
Biology, 15(7), 424. DOI: https://doi.org/10.1186/s13059-014-0424-0
Hilbert, M., & López, P. (2011). The world’s technological capacity to store, communicate and compute
information. Science, 332(6025), 60–65. DOI: https://doi.org/10.1126/science.1200970
Hollander, J., Graves, E., Renski, H., Foster-Karim, C., Wiley, A., & Das, D. (2016). Urban Social Listening:
Potential and Pitfalls for Using Microblogging Data in Studying Cities. London: Palgrave Macmillan. DOI:
https://doi.org/10.1057/978-1-137-59491-4
Kassens-Noor, E. (2012). Twitter as a teaching practice to enhance active and informal learning in higher
education: The case of sustainable tweets. Active Learning in Higher Education, 13(1), 9–21. DOI:
https://doi.org/10.1177/1469787411429190
Lee, K., Palsetia, D., Narayanan, R., Patwary, M. M. A., Agrawal, A., & Choudhary, A. (2011). December.
Twitter trending topic classification. In 2011 IEEE 11th International Conference on Data Mining
Workshops (pp. 251–258). IEEE. DOI: https://doi.org/10.1109/ICDMW.2011.171
Leetaru, K. (2019). Visualizing Seven Years Of Twitter’s Evolution: 2012–2018. Retrieved May 11, 2020
from https://www.forbes.com/sites/kalevleetaru/2019/03/04/visualizing-seven-years-of-twitters-
evolution-2012-2018/
Li, J., & Greenhow, C. (2015). Scholars and social media: Tweeting in the conference backchannel for
professional learning. Educational Media International, 52(1), 1–14. DOI: https://doi.org/10.1080/0952
3987.2015.1005426
Martín-Martín, A., Orduña-Malea, E., & Delgado López-Cózar, E. (2016). The role of ego
in academic profile services: Comparing Google Scholar, ResearchGate, Mendeley, and
ResearcherID. ResearchGate, Mendeley, and ResearcherID (March 4, 2016). DOI: https://doi.
org/10.31235/osf.io/nk7my
Megele, C. (2014). Theorizing Twitter chat. Journal of Perspectives in Applied Academic Practice, 2(2). DOI:
https://doi.org/10.14297/jpaap.v2i2.106
Mohammadi, E., Thelwall, M., Kwasny, M., & Holmes, K. L. (2018). Academic information on Twitter: A
user survey. PloS one, 13(5). DOI: https://doi.org/10.1371/journal.pone.0197265
Nie, N. H., & Erbring, L. (2002). Internet and society: A preliminary report. IT & Society, 1(1), 275–283.
Nummi, P. (2019). Social media data analysis in urban e-planning. In Smart Cities and Smart Spaces:
Concepts, Methodologies, Tools, and Applications (pp. 636–651). IGI Global. DOI: https://doi.
org/10.4018/978-1-5225-7030-1.ch028
O’Meara, K. (2016). How scholarship reconsidered disrupted the promotion and tenure system.
Scholarship Reconsidered. Priorities of the Professoriate, 41–51.
Oz, M., Zheng, P., & Chen, G. M. (2018). Twitter versus Facebook: Comparing incivility, impoliteness,
and deliberative attributes. New Media & Society, 20(9), 3400–3419. DOI: https://doi.
org/10.1177/1461444817749516Prada, A., & Iglesias, C. A. (2020). Predicting reputation in the sharing economy with Twitter social data. Sanchez 14
Journal of Altmetrics
Applied Sciences, 10(8), 2881. DOI: https://doi.org/10.3390/app10082881
DOI: 10.29024/joa.41
Priem, J., & Costello, K. L. (2010). How and why scholars cite on Twitter. Proceedings of the American
Society for Information Science and Technology, 47(1), 1–4. DOI: https://doi.org/10.1002/
meet.14504701201
Riddell, J., Brown, A., Kovic, I., & Jauregui, J. (2017). Who are the most influential emergency physicians
on Twitter? Western Journal of Emergency Medicine, 18(2), 281. DOI: https://doi.org/10.5811/
westjem.2016.11.31299
Riquelme, F., & González-Cantergiani, P. (2016). Measuring user influence on Twitter: A survey.
Information Processing & Management, 52(5), 949–975. DOI: https://doi.org/10.1016/j.
ipm.2016.04.003
Roth, M. S. (2014). Beyond the university: Why liberal education matters. Yale University Press.
Sanchez, T. W. (2017). Faculty performance evaluation using citation analysis: An update. Journal of
Planning Education and Research, 37(1), 83–94. DOI: https://doi.org/10.1177/0739456X16633500
Sanchez, T. W., & Afzalan, N. (2017). Mapping the knowledge domain of urban planning. In
Sanchez, T. W. (Ed.) Planning Knowledge and Research (pp. 69–84). Routledge. DOI: https://doi.
org/10.4324/9781315308715-6
Schimanski, L. A., & Alperin, J. P. (2018). The evaluation of scholarship in academic promotion and
tenure processes: Past, present, and future. F1000Research, 7. DOI: https://doi.org/10.12688/
f1000research.16493.1
Schweitzer, L. (2014). Planning and social media: A case study of public transit and stigma on
Twitter. Journal of the American Planning Association, 80(3), 218–238. DOI: https://doi.org/10.1080/0
1944363.2014.980439
Shelton, T., Poorthuis, A., & Zook, M. (2015). Social media and the city: Rethinking urban socio-spatial
inequality using user-generated geographic information. Landscape and Urban Planning, 142,
198–211. DOI: https://doi.org/10.1016/j.landurbplan.2015.02.020
Skeels, M. M., & Grudin, J. (2009). May. When social networks cross boundaries: A case study of
workplace use of Facebook and LinkedIn. In Proceedings of the ACM 2009 international conference on
Supporting group work (pp. 95–104). ACM. DOI: https://doi.org/10.1145/1531674.1531689
Sörlin, S., & Vessuri, H. (Eds.) (2007). Knowledge society vs. knowledge economy: Knowledge, Power, and
Politics. Springer. DOI: https://doi.org/10.1057/9780230603516
Thelwall, M., Tsou, A., Weingart, S., Holmberg, K., & Haustein, S. (2013). Tweeting links to academic
articles. Cybermetrics: International Journal of Scientometrics, Informetrics and Bibliometrics, 17, 1–8.
Veletsianos, G., & Kimmons, R. (2013). Scholars and faculty members’ lived experiences in online
social networks. The Internet and Higher Education, 16, 43–50. DOI: https://doi.org/10.1016/j.
iheduc.2012.01.004
TO CITE THIS ARTICLE:
Weller, M. (2011). The digital scholar: How technology is transforming scholarly practice. A&C Black. DOI:
Sanchez, T. W. (2021). Urban
https://doi.org/10.5040/9781849666275
Planning Academics and
Wojcik, S., & Hughes, A. (2019). Sizing up Twitter users. Retrieved May 12, 2020 from https://www.
Twitter: Who and what?
pewresearch.org/internet/2019/04/24/sizing-up-twitter-users/ Journal of Altmetrics, 4(1): 3.
Williamson, W., & Ruming, K. (2016). Using social network analysis to visualize the social-media DOI: https://doi.org/10.29024/
networks of community groups: Two case studies from Sydney. Journal of Urban Technology, 23(3), joa.41
69–89. DOI: https://doi.org/10.1080/10630732.2016.1197490
Yan, W., Zhang, Y., & Bromfield, W. (2018). Analyzing the follower–followee ratio to determine
Submitted: 20 March 2021
user characteristics and institutional participation differences among research universities on
Accepted: 25 April 2021
ResearchGate. Scientometrics, 115(1), 299–316. DOI: https://doi.org/10.1007/s11192-018-2637-6
Published: 07 May 2021
COPYRIGHT:
© 2021 The Author(s). This
is an open-access article
distributed under the terms
of the Creative Commons
Attribution 4.0 International
License (CC-BY 4.0), which
permits unrestricted use,
distribution, and reproduction
in any medium, provided the
original author and source
are credited. See http://
creativecommons.org/licenses/
by/4.0/.
Journal of Altmetrics is a peer-
reviewed open access journal
published by Levy Library Press.You can also read