Carer Social Care-Related Quality of Life Outcomes: Estimating English Preference Weights for the Adult Social Care Outcomes Toolkit for Carers ...
←
→
Page content transcription
If your browser does not render page correctly, please read the page content below
-
  Preference-Based Assessments
                                                         Contents lists available at sciencedirect.com
                                                         Journal homepage: www.elsevier.com/locate/jval

Carer Social Care-Related Quality of Life Outcomes: Estimating English
Preference Weights for the Adult Social Care Outcomes Toolkit for Carers
Laurie Batchelder, PhD,1,* Juliette Malley, PhD,2 Peter Burge, MSc,3 Hui Lu, PhD,3 Eirini-Christina Saloniki, PhD,1,4
Ismo Linnosmaa, PhD,5,6 Birgit Trukeschitz, PhD,7 Julien Forder, PhD1
1
 Personal Social Services Research Unit, University of Kent, Kent, England, UK; 2Personal Social Services Research Unit, London School of Economics, London, England,
UK; 3RAND Europe, Cambridge, UK; 4Centre for Health Services Studies, University of Kent, Kent, England, UK; 5Centre for Health and Social Economics, National
Institute for Health and Welfare, Helsinki, Finland; 6Department of Health and Social Management, University of Eastern Finland, Finland; 7Research Institute for
Economics of Aging, WU Vienna University of Economics and Business, Vienna, Austria

             A B S T R A C T

             Background: There is increasing interest in assessing the effects of interventions on older people, people with long-term
             conditions and their informal carers for use in economic evaluation. The Adult Social Care Outcomes Toolkit for Carers
             (ASCOT-Carer) is a measure that specifically assesses the impact of social care services on informal carers. To date, the ASCOT-
             Carer has not been preference-weighted.
             Objectives: To estimate preference-based index values for the English version of the ASCOT-Carer from the general population
             in England.
             Methods: The ASCOT-Carer consists of 7 domains, each reflecting aspects of social care-related quality of life in informal
             carers. Preferences for the ASCOT-Carer social care-related quality of life states were estimated using a best–worst scaling
             exercise in an online survey. The survey was administered to a sample of the general adult population in England
             (n = 1000). Participants were asked to put themselves into the hypothetical state of being an informal carer and indicate
             which attribute they thought was the best (first and second) and worst (first and second) from a profile list of 7 attributes
             reflecting the 7 domains, each ranging at a different level (1-4). Multinomial logit regression was used to analyze the data
             and estimate preference weights for the ASCOT-Carer measure.
             Results: The most valued aspect by English participants was the 'occupation' attribute at its highest level. Results further
             showed participants rated having no control over their daily life as the lowest attribute-level of all those presented. The
             position of the 7 attributes influenced participants’ best and worst choices, and there was evidence of both scale and taste
             heterogeneity on preferences.
             Conclusion: This study has established a set of preference-based index values for the ASCOT-Carer in England derived from the
             best–worst scaling exercise that can be used for economic evaluation of interventions on older individuals and their informal
             carers.

             Keywords: ASCOT questionnaire, best–worst scaling, informal care, preferences.

             VALUE HEALTH. 2019; 22(12):1427–1440

Introduction                                                                                 evaluations of these interventions also consider the impact on
                                                                                             informal carers.9,10
    Informal care is a key part of the total care provided for older                            Several studies that have attempted to measure the effects of
individuals and those with long-term conditions. Providing care                              interventions on informal carers used the quality-adjusted life
for another individual can have significant effects on the carer’s                            years (QALYs) metric.9,10 In measuring QALYs of informal carers,
health and quality of life (QoL).1-4 Caregiving can have negative                            the EuroQol-5D measure is often used.10 The EuroQol-5D focuses
effects on the carer’s mental and physical health and QoL,3,5,6 but                          on aspects of health status and not on more holistic aspects of QoL
can also have positive effects, arising from empathy, altruism, and                          or well-being, so it may not be broad enough to capture what
fulfillment.7,8 Research shows interventions in older individuals                             matters to informal carers or the impact of caregiving on informal
and those with long-term conditions can have an effect on a                                  carers for economic evaluations.11 To overcome this limitation,
carer’s health and QoL, so it is important that economic                                     carer-specific measures assessing QoL or well-being have been

* Address correspondence to: Laurie Batchelder, PhD, Cornwallis Central, University of Kent, Canterbury, CT2 7NF UK. Email: laurie.batchelder@gmail.com
    1098-3015 - see front matter Copyright ª 2019, ISPOR–The Professional Society for Health Economics and Outcomes Research. Published by Elsevier Inc. This is an
    open access article under the CC BY-NC-ND license (http://creativecommons.org/licenses/by-nc-nd/4.0/).
    https://doi.org/10.1016/j.jval.2019.07.014
1428            VALUE IN HEALTH                                                                                               DECEMBER 2019

developed.12-15 Carer-specific measures typically focus on negative      repeated for the worst, second best, and second worst choices.
effects of care on carers’ QoL, such as care burden, while              After selecting all 4 choices in the first scenario, this process was
neglecting positive effects of care.7,16 Recent measures, such as the   repeated for the remaining 7 scenarios of the different attribute-
Care-related Quality of Life Instrument17and the Carer Experience       level combinations. In total, each participant made 32 choices
Scale,7,18 have been developed to capture the impact of caregiving      (ie, 4 choices in each of the 8 scenarios). (See Appendix Figure 1 in
on informal carers. However, validation is ongoing.                     Supplemental Materials found at https://doi.org/10.1016/j.jval.201
    The Adult Social Care Outcomes Toolkit for Carers (ASCOT-           9.07.014 for an example of the BWS task using the ASCOT-Carer
Carer)a is an outcome measure aimed at assessing social care-           measure).
related QoL (SCRQoL) for informal carers across 7 domains.19,20
These include occupation, control over daily life, self-care, per-      Experimental Design
sonal safety, social participation, space and time to be yourself,
                                                                            The scenarios for the BWS exercise were developed using an
and feeling supported and encouraged. Each domain is rated on a
                                                                        orthogonal main effects plan.30 All attributes had the same
4-level scale, ranging from the ideal state (level 1) to high needs
                                                                        number of levels, so we were able to use a balanced orthogonal
(level 4). A key feature of this measure, differentiating it from
                                                                        main effects plan whereby all attributes were statistically inde-
other relevant measures, is its focus on the impact of social care
                                                                        pendent of one another. The full factorial design plan consisted of
services on informal carers. The ASCOT-Carer was developed using
                                                                        47 possible profiles, which would be too many states for presen-
interviews and cognitive testing to capture important aspects of
                                                                        tation.24,31,32 The fractional-factorial design reduced the full
carers’ SCRQoL.19,20,21,22 However, certain attributes of carers’
                                                                        factorial plan to a design matrix of 32 scenarios. The design matrix
SCRQoL are likely to be more important than others. To account for
                                                                        was blocked into 4 segments. Thus, each participant received 8
this in producing a single overall SCRQoL score, we need to
                                                                        BWS scenarios. The blocking procedure retained balance within
determine the relative value or weight for each of the measures’
                                                                        the blocks and sought to minimize correlations of the levels being
attribute levels.23,24 To date, the ASCOT-Carer has not been pref-
                                                                        presented for the attributes within the block. A foldover design
erence weighted.
                                                                        was used to eliminate easy or straightforward choices from each
    There are different methods available to elicit preferences in
                                                                        scenario.33 The blocked scenarios were randomly allocated to
informal carers. Previous work has examined the use of the time-
                                                                        participants to minimize selection bias. The order of attributes was
tradeoff technique for estimating the value of a carer’s well-be-
                                                                        randomized between participants to prevent ordering bias and
ing.25 Additional work has estimated preference-based index
                                                                        separate the effect of attribute choice from the position of that
values for the Carer Experience Scale using best–worst scaling
                                                                        attribute within a scenario.34,35
(BWS) in carers.7 BWS is arguably a less cognitively burdensome
method compared to other choice methods, such as discrete
                                                                        Survey Design and Sampling
choice experiments or time-tradeoff technique.26,27 The main
advantage of the BWS (profile case) is people consider the attri-            The BWS exercise was part of a self-completion online survey.
bute-levels that describe a profile, instead of comparing 2 pro-         The survey included some general sociodemographic questions to
files27,28 (for further details on this method, see Flynn and            assess representativeness of the sample and participants’ consent
Marley29).                                                              to take part in the study. The survey also included a set of ques-
    The aim of this study was to estimate a set of preference           tions regarding participants’ QoL and SCRQoL using the ASCOT-
weights for the English version of the ASCOT-Carer instrument           Carer measure, the BWS exercise, follow-up questions about
gathered from an English sample using BWS. This paper begins by         participants’ understanding of the BWS exercise, questions con-
explaining the methods used for the BWS exercise: experimental          cerning the participants’ experiences of social care and caring, and
design, methods of data collection, and planned analysis. We            some additional sociodemographic and socioeconomic questions.
report BWS model results relating to the generation of preference       The study was reviewed and approved by the University of Kent
weights for the ASCOT-Carer in an English sample for economic           SRC Research Ethics Committee, [REF SR CEA 149].
evaluations.                                                                We estimated preferences of a general population sample
                                                                        (rather than a service user or carer sample), which is a common
                                                                        approach in the estimation of preference weights.36,37 This is
Methods                                                                 because it is the public at large whose views are relevant, where
                                                                        services are publicly-funded, and whose data are used to make
Valuation Exercise                                                      decisions about resource allocations.38
   During BWS, participants were asked to put themselves in the             The survey was piloted in May 2016 with a total sample of 50
imaginary state of caring for someone who was unable to care for        adults from the general population, recruited through an online
themselves owing to illness, accident, or old age. Participants were    panel. The pilot data helped inform decisions regarding wording
presented with 8 scenarios. Each scenario included a profile             of the BWS exercise. After the pilot, some questionnaire items and
containing 7 attributes reflecting the 7 SCRQoL domains of ASCOT-        wording of the BWS exercise were refined for clarity.
Carer.23,28,29 The attributes each represented 1 of 4 levels, ranging       The main survey was conducted between June and July 2016.
from ideal state (level 1) to high needs (level 4). Participants were   The study included 1000 adults recruited from the general pop-
asked to select the best choice from the list of attribute-levels in    ulation in England. Participants were recruited from the same
the scenario (type of BWS experiment known as 'profile case').           online panel as the pilot; those who completed the main survey
This selected choice was grayed out. The same process was               did not complete the pilot survey. Sampling was targeted to be
                                                                        representative of the English general population in age, sex, and
                                                                        region. Individuals who took less than 4.5 minutes to complete the
a
    The ASCOT measure is disclosed in full herein but ordinarily        BWS task were omitted from the sample before the end of data
      should not be used for any purposes without the appropriate       collection, as this was deemed an unrealistically short period of
      permissions of the ASCOT team and the copyright holder, the       time to complete the task. Sampling continued until the target of
      University of Kent. Please visit www.pssru.ac.uk/ascot or email   1000 participants was reached. No further exclusion criteria were
      ascot@kent.ac.uk to inquire about permissions.                    applied for the analysis.
PREFERENCE-BASED ASSESSMENTS 1429
Statistical Analysis Each choice in the above was estimated using the MNL model:
Analysis of best-worst scaling data e wViq
Based on random utility theory, a multinomial logit regression Piq ¼ P wV (3)
j˛J e
jq
(MNL)39,40 model was used to estimate preference weights for
informal carers’ SCRQoL using the ASCOT-Carer. The estimation
where Piq refers to the probability of each respondent q choosing
closely followed Netten et al.36 Each attribute was specified as an
alternative i from all relevant alternatives j in a profile J. w is the
alternative and given a utility function, which was based on the
scale parameter and inversely proportionate to the standard de-
level at which the attribute was presented within the scenario and
viation of the random component.
the position of the attribute in the scenario. The position effect of
The basic MNL model was first estimated. The basic model
the attribute was separated by best (first and second) and worst
refers to the MNL model (1) in which w = 1. T-ratios were used to
(first and second) choices. The MNL model assumed all choices
indicate the level of significance of the coefficient compared to the
were independent and sequential.28,41 The basic MNL model was
reference levels (control over daily life at level 4 and first position
estimated as follows:
of the profile list for first and second best and worst choices). A t-
Uiq ¼ Viq 1εiq ; c J (1) ratio of -1.96 or 11.96 was considered statistically significant at
the 95% level.
Uq ðoccupationÞ ¼ 1b1 ð1; if occupation level ¼ 1Þiq ð1; if choice ¼ best or second bestÞiq
2b1 ð1; if occupation level ¼ 1Þiq ð1; if choice ¼ worst or second worstÞiq
«
1b4 ð1; if occupation level ¼ 4Þiq ð1; if choice ¼ best or second bestÞiq
2b4 ð1; if occupation level ¼ 4Þiq ð1; if choice ¼ worst or second worstÞiq
1gB1 ð1; if occupation appeared in first rowÞiq ð1; if choice ¼ best or second bestÞiq
«
1gB7 ð1; if occupation appeared in seventh rowÞiq ð1; if choice ¼ best or second bestÞiq
2dW
1 ð1; if occupation appeared in first rowÞiq ð1; if choice ¼ worst or second worstÞiq
«
2dW
7 ð1; if occupation appeared in seventh rowÞiq ð1; if choice ¼ worst or second worstÞiq 1εiq (2)
where Uiq is the utility function for respondent q derived for an The scale heterogeneity MNL (S-MNL) model42 was estimated to
alternative i being chosen from a profile of J alternatives. The control for differences in error variance in subgroups. This allowed
utility function has a systematic component, Viq , and a random us to investigate the consistency of choices and would allow for
component, εiq . more valid and reliable utility estimates.28 Following the work of
An example of the specification of the basic utility function for Netten et al,36 scale factors were included in the model to test for
the occupation domain is outlined below. Effects coding was used scale heterogeneity based on previous research (age, education
to dissociate best (first and second) and worst (first and second) level, best and worst choices, time taken to complete the BWS task,
choices: health status).36 After testing the hypothesized scale factors, we
where b1 . b4 denotes the coefficient for each attribute-level (1 ended with a model that included 3 statistically significant scale
refers to the ideal state, whereas 4 refers to high needs), gB1 ; .; gB7 factors that were sensible and in-line with economic/psychological
(dw W
1 ; .; d7 ) are the coefficients for the position of the occupation theory: age, education, and time taken to complete the BWS task.
attribute within the best–worst scenario if the choice was best or It is also important to control for variation in preferences be-
second best (worst or second worst), εiq refers to the random tween subgroups associated with observable characteristics (taste
component. The attribute of control over daily life at level 4 was heterogeneity). Our aim was to account for any additional variation
used as a reference level and was set to 0.36 in estimation within the model based on our sampling approach.1430 VALUE IN HEALTH DECEMBER 2019
Table 1. Sample characteristics compared to the general population (N = 1000).
Variable Sample General population
frequency % frequency %
Sex47
Male 480 48.00 20 262 822 48.62
Female 520 52.00 21 412 674 51.38
Age48 (years)
18-24 106 10.60 4 920 128 11.41
25-34 175 17.50 7 485 996 17.37
35-44 167 16.70 7 107 372 16.49
45-54 182 18.20 7 700 360 17.86
55-64 190 19.00 6 183 043 14.34
65-79 173 17.30 7 089 983 16.45
801 7 0.70 2 621 589 6.08
Ethnicity47
White 900 90.00 36 377 829 87.29
Mixed/multiple ethnic backgrounds 15 1.50 602 862 1.45
Asian/Asian British 62 6.20 3 007 110 7.22
Black/African/Caribbean/Black 15 1.50 1 284 281 3.08
Other ethnic group 1 0.10 403 414 0.97
Prefer not to say 7 0.70 – –
Religion47
No religion 426 42.60 9 768 622 23.44
Christian (all denominations) 480 48.00 25 721 735 61.72
Buddhist/Hindu/Jewish/Muslim 64 6.40 3 063 874 7.35
Any other religion/prefer not to say 30 3.00 3 121 265 7.49
Education (ISCED class)49
Below secondary education (ISCED ,2) 49 4.90 15 371 251 35.76
Lower secondary education and upper 406 40.60 6 544 614 15.22
secondary education (ISCED 2, 3)
Short-cycle tertiary and post-secondary 140 14.00 6 842 565 15.92
education (ISCED 4, 5)
BA/MA/PhD or equivalent (ISCED 6, 7, 8) 389 38.90 11 769 361 27.38
Don’t know 3 0.30 – –
Other 16 1.60 2 461 829 5.73
Marital status3
Married/in a civil partnership 582 58.20 20 129 657 46.82
Separated (still legally married) 20 2.00 1 141 196 2.65
Divorced 57 5.70 3 857 137 8.97
Widowed 31 3.10 2 971 702 6.91
Single, that is, never married and never 299 29.90 14 889 928 34.64
in a civil partnership
Prefer not to say 11 1.10 – –
Employment status50
Employed (full-time, part-time, self- 616 61.60 24 143 464 62.10
employed)
In education (not paid for by employer), 38 3.80 3 592 654 9.24
even if on vacation
Unemployed 42 4.20 1 702 847 4.38
Permanently sick or disabled 24 2.40 1 574 134 4.05
Retired 224 22.40 5 320 691 13.68
In community or military service 0 0.00 – –
Doing housework, looking after children 50 5.00 1 695 134 4.36
or other persons
Other 3 0.30 852 450 2.19
Don’t know 3 0.30 – –
Social grade51
A/B 462 46.20 7 737 602 22.94
C1 276 27.60 10 238 039 30.35
C2 122 12.20 7 396 569 21.93
D/E 130 13.00 8 362 138 24.79
Other 10 1.00 – –
continued on next pagePREFERENCE-BASED ASSESSMENTS 1431
Table 1. Continued
Variable Sample General population
frequency % frequency %
Self-reported health status52
Very good 196 19.60 25 005 712 47.17
Good 502 50.20 18 141 457 34.22
Fair 243 24.30 6 954 092 13.12
Bad 52 5.20 2 250 446 4.25
Very bad 7 0.70 660 749 1.25
BA indicates bachelor of arts; MA, master of arts; ISCED, International Standard Classification of Education ; PhD, doctor of philosophy.
Taste heterogeneity was modeled by adding interaction terms be- robust standard errors were obtained using the sandwich esti-
tween attribute levels and observable characteristics to the sys- mator36 and estimated in Biogeme.44
tematic component of the model (1).30 Several taste factors were
included in the model to test for taste heterogeneity on the attri- Generation of preference-based index values for the
bute levels based on socioeconomic and sociodemographic char- ASCOT-Carer in England
acteristics that were either significantly under- or overrepresented Results from the taste heterogeneity S-MNL model were then
in the sample compared to the general population (see Table 1).36 used to generate sensible preference-based index values by taking
After testing the hypothesized taste factors, we ended with a into account representativeness of the data. Population pro-
model that included 4 statistically significant taste factors that were portions were applied to certain coefficients where there was
sensible and in-line with economic/psychological theory: educa- evidence of (taste) variation in the taste heterogeneity S-MNL
tion, marital status, social grade, and religion. model to produce revised average values that take into account
Each participant in the BWS task made 32 choices (giving 32 significant differences that exist between groups. Socioeconomic
000 observations in total). The full sample was used for the basic and sociodemographic variables selected to apply population
MNL model but was reduced to 31 392 observations due to a small proportions were informed by large differences compared to the
number of missing observations for the education variable (608 general population detected through descriptive statistics (.10
observations, or 19 participants) in the S-MNL and taste hetero- point difference): marital status, education, social grade, and
geneity S-MNL models. religion.41,45 Population proportions taken from English Census
The MNL models were developed and estimated first using and national population statistics were applied to the selected
ALOGIT software.43 To correct for the repeated nature of the task, taste variables to better reflect tastes of the English population
Table 2. Descriptives for the BWS task (N = 1000).
Variable %
Time taken to complete the BWS task (minutes)—median IQR: 25%-75% 7.88
6.00-11.37
Ability to put themselves in the imaginary situation
Yes, all of the time 45.80
Yes, but only some of the time 47.60
No 6.60
Assumed length of time in imaginary situation
Didn’t think about it 23.50
Temporary—less than a few weeks 2.10
Temporary—a number of weeks 3.80
Temporary—a number of months 7.00
Temporary—about a year 8.80
Temporary—a number of years 31.40
Permanent or rest of my life 23.40
Understanding of the scenarios in the BWS task
Yes, all of the time 73.40
Yes, but only some of the time 24.00
No 2.60
Whether considered all of the scenarios when making decisions
Yes, all of the time 82.70
Yes, but only some of the time 15.80
No 1.50
Report of how easy or difficult to complete the BWS task
Very easy 12.10
Fairly easy 63.50
Fairly difficult 22.80
Very difficult 1.60
BWS indicates best-worst scaling; IQR, interquartile range.1432 VALUE IN HEALTH DECEMBER 2019
Table 3. Estimated parameters for the ASCOT-Carer measure using general population data from England-Basic MNL model (N = 1000).
Attribute-level MNL
Coefficient SE t -ratio (robust)
Occupation
1. I’m able to spend my time as I want, doing things I value or enjoy. 4.019 0.112 35.9
2. I’m able do enough of the things I value or enjoy with my time. 3.748 0.105 35.6
3. I do some of the things I value or enjoy with my time, but not enough. 2.170 0.073 29.6
4. I don’t do anything I value or enjoy with my time. 0.327 0.049 6.6
Control over daily life
1. I have as much control over my daily life as I want. 3.876 0.109 35.6
2. I have adequate control over my daily life. 3.288 0.096 34.3
3. I have some control over my daily life, but not enough. 1.825 0.069 26.3
4. I have no control over my daily life. 0.000 0.000 Constant
Looking after yourself
1. I look after myself as well as I want. 3.122 0.089 35.2
2. I look after myself well enough. 2.957 0.089 33.3
3. Sometimes I can’t look after myself well enough. 0.839 0.055 15.2
4. I feel I am neglecting myself. 0.451 0.053 8.6
Safety
1. I feel as safe as I want. 2.943 0.082 35.7
2. Generally I feel adequately safe, but not as safe as I would like. 1.770 0.063 28.3
3. I feel less than adequately safe. 1.066 0.057 18.6
4. I don’t feel at all safe. 0.601 0.054 11.1
Social participation and involvement
1. I have as much social contact as I want with people I like. 3.095 0.093 33.4
2. I have adequate social contact with people. 2.780 0.081 34.4
3. I have some social contact with people, but not enough. 1.894 0.066 28.6
4. I have little social contact with people and feel socially isolated. 0.776 0.054 14.4
Space and time to be yourself
1. I have all the space and time I need to be myself. 3.681 0.103 35.8
2. I have adequate space and time to be myself. 3.294 0.092 35.7
3. I have some of the space and time I need to be myself, but not enough. 2.008 0.070 28.6
4. I don’t have any space or time to be myself. 0.517 0.049 10.6
Feeling supported and encouraged
1. I feel I have the encouragement and support I want. 3.255 0.093 35.1
2. I feel I have adequate encouragement and support. 3.074 0.088 35.0
3. I feel I have some encouragement and support, but not enough. 1.858 0.067 27.8
4. I feel I have no encouragement and support. 0.652 0.054 12.1
Attribute position in the BWS task
Position 1_B 0.000 0.000 Constant
Position 2_B 20.140 0.041 23.4
Position 3_B 20.222 0.041 25.4
Position 4_B 20.314 0.042 27.5
Position 5_B 20.365 0.043 28.4
Position 6_B 20.402 0.045 29.0
continued on next pagePREFERENCE-BASED ASSESSMENTS 1433
Table 3. Continued
Attribute-level MNL
Coefficient SE t -ratio (robust)
Position 7_B 20.397 0.045 28.8
Position 1_W 0.000 0.000 Constant
Position 2_W 0.010 0.043 0.2
Position 3_W 20.008 0.043 20.2
Position 4_W 0.023 0.045 0.5
Position 5_W 0.034 0.044 0.8
Position 6_W 20.022 0.045 20.5
Position 7_W 0.062 0.045 1.4
No. of observations 32 000
df 39
Final log-likelihood 241 693.4
Rho2 (0) 0.226
AIC 83 464.9
BIC 83 791.5
Note. The ASCOT measure is reproduced with permission from the University of Kent. All rights reserved.
AIC indicates Akaike information criterion; ASCOT, Adult Social Care Outcomes Toolkit; BIC, Bayesian information criterion; BWS indicates best-worst scaling; MNL,
multinomial logit regression; SE, standard error.
(see Appendix Table 1 in Supplemental Materials found at https:// population (46.8%). For social grade, grades AB (combined) were
doi.org/10.1016/j.jval.2019.07.014 for list of sources). overrepresented (46.2%) compared to the general population
The next step was to rescale the revised average values so that (22.9%). Both grade C2 and grades DE (combined) were also un-
summed state attribute scores varied on a 0-1 interval.31,41,46 In derrepresented. The percentage of people with self-reported very
the QALY, death is typically anchored to 0. For the current study, good health status also differed. Good and fair health statuses
values were rescaled such that high needs or the pits state were (50.2% and 24.3%) were also overrepresented compared to the
given a value of 0. This reflected a measure of unmet needs. The general population (34.2% and 13.1%).
benefit of this option is it allowed us to measure and understand Descriptives for the BWS task are reported in Table 2. The
the relative value of each SCRQoL state and retain a scale of high median time to complete the BWS task was just under 8 minutes.
needs or pits state and ideal state.31,41,46 Anchoring values of the Nearly all of the participants were able to put themselves into the
ASCOT-Carer to the dead state may be considered in future work. imaginary situations, either all of the time (45.8%) or some of the
One-seventh of the value of the state 4444444 (high needs for all time (47.6%). Interestingly, 23.5% of the sample did not think about
7 domains) was subtracted from all attributes. This value was then the length of time in the imaginary situations, whereas 31.4% of
divided by the difference between value states 1111111 (ideal state participants imagined the length of time in the imaginary situa-
for all 7 domains) and 4444444 (high needs for all 7 domains). This tions would be a number of years, and 23.4% thought the length of
was to ensure the lowest possible state (pits state) (high needs for time would be permanent. Most respondents were able to un-
all 7 domains) sums to 0 and the highest possible state (ideal state derstand the scenarios presented in the BWS task (73.4%),
for all 7 domains) sums to 1, while maintaining relative differences considered all of the scenarios when making decisions (82.7%),
between the attribute-level coefficients.31,41,46 and found the BWS task fairly easy to complete (63.5%).
Best–Worst Scaling Model Results
Results
Table 3 presents the attribute-level coefficients, the position
Table 1 includes sociodemographic and socioeconomic statis- best (first and second) and worst (first and second) choice vari-
tics from the sample (n = 1000) compared to the general popu- ables estimated using the basic MNL model for the ASCOT-Carer.
lation.47-52 There was a larger number of respondents in higher The goodness-of-fit measure (rho-squared) indicated the MNL
education (eg, having a degree and above [bachelor of arts, master model fit performed relatively well, with a rho-squared value =
of arts, doctor of philosophy, or equivalent]) (38.9%) compared to 0.226 (a rho-squared value between 0.25 and 0.3 is equivalent to a
the general population (27.4%). There was a larger number of re- value between 0.75 and 0.80 of a linear regression model).36
spondents in either lower or upper secondary education (40.6%) All attribute-levels were estimated relative to level 4 of the
and a smaller proportion of respondents below secondary edu- 'control over daily life' attribute. The latter was defined as the
cation (4.9%) compared to the general population (15.2% and reference level because it had the lowest utility. There were sta-
35.8%). For religion, there was a larger proportion of respondents tistically significant differences between estimated coefficients
who reported no religion (42.6%) compared to the general popu- compared to level 4 of the 'control over daily life' attribute. This
lation (23.4%). The sample also underrepresented those of Chris- indicates all other SCRQoL states were more valued compared to
tian faith. There was a larger proportion of respondents reported 'control over daily life' level 4, indicating these weights were
as married/in a civil partnership (58.2%) compared to the general greater and more positive compared to this attribute-level.1434 VALUE IN HEALTH DECEMBER 2019
Table 4. Estimated parameters for the ASCOT-Carer measure using general population data from England S-MNL model (N = 981).
Attribute-level S-MNL
Coefficient SE t ratio
(robust)
Occupation
1. I’m able to spend my time as I want, doing things I value or enjoy. 2.886 0.189 15.3
2. I’m able do enough of the things I value or enjoy with my time. 2.694 0.176 15.3
3. I do some of the things I value or enjoy with my time, but not enough. 1.561 0.106 14.7
4. I don’t do anything I value or enjoy with my time. 0.233 0.037 6.2
Control over daily life
1. I have as much control over my daily life as I want. 2.781 0.185 15.1
2. I have adequate control over my daily life. 2.368 0.155 15.3
3. I have some control over my daily life, but not enough. 1.304 0.092 14.2
4. I have no control over my daily life. 0.000 0.000 Constant
Looking after yourself
1. I look after myself as well as I want. 2.228 0.151 14.7
2. I look after myself well enough. 2.113 0.145 14.6
3. Sometimes I can’t look after myself well enough. 0.610 0.052 11.8
4. I feel I am neglecting myself. 0.342 0.041 8.4
Safety
1. I feel as safe as I want. 2.092 0.142 14.7
2. Generally I feel adequately safe, but not as safe as I would like. 1.278 0.087 14.7
3. I feel less than adequately safe. 0.779 0.059 13.2
4. I don’t feel at all safe. 0.447 0.045 10.0
Social participation and involvement
1. I have as much social contact as I want with people I like. 2.221 0.146 15.2
2. I have adequate social contact with people. 2.008 0.132 15.2
3. I have some social contact with people, but not enough. 1.355 0.095 14.2
4. I have little social contact with people and feel socially isolated. 0.545 0.050 10.8
Space and time to be yourself
1. I have all the space and time I need to be myself. 2.640 0.175 15.1
2. I have adequate space and time to be myself. 2.365 0.155 15.3
3. I have some of the space and time I need to be myself, but not enough. 1.439 0.100 14.4
4. I don’t have any space or time to be myself. 0.360 0.041 8.8
Feeling supported and encouraged
1. I feel I have the encouragement and support I want. 2.327 0.156 14.9
2. I feel I have adequate encouragement and support. 2.201 0.145 15.1
3. I feel I have some encouragement and support, but not enough. 1.320 0.092 14.3
4. I feel I have no encouragement and support. 0.474 0.046 10.3
Domain position in the BWS task
Position 1_B 0.000 0.000 Constant
Position 2_B 20.098 0.030 23.3
Position 3_B 20.163 0.031 25.2
Position 4_B 20.224 0.033 26.9
Position 5_B 20.259 0.035 27.5
Position 6_B 20.283 0.036 27.9
continued on next pagePREFERENCE-BASED ASSESSMENTS 1435
Table 4. Continued
Attribute-level S-MNL
Coefficient SE t ratio
(robust)
Position 7_B 20.270 0.036 27.4
Position 1_W 0.000 0.000 Constant
Position 2_W 0.020 0.031 0.7
Position 3_W 0.002 0.032 0.1
Position 4_W 0.025 0.033 0.7
Position 5_W 0.027 0.033 0.8
Position 6_W 20.016 0.033 20.5
Position 7_W 0.035 0.033 1.1
Scale parameters
Scale parameter for younger participants: data relate to participants 1.000 Base
aged 18-44 years
Scale parameter for older participants: data relate to participants aged 451 years 1.184 3.1
Scale parameter for time to complete BWS task: duration #6 minutes (360 seconds) 1.000 Base
Scale parameter for time to complete BWS task: duration .6 minutes (361 seconds1) 1.250 3.3
Scale parameter for participants with lower educational qualifications 1.000 Base
(below BA/MA/PhD or equivalent)
Scale parameter for participants with higher educational qualifications 1.202 3.4
(BA/MA/PhD or equivalent)
No. of observations 31 392
df 42
Final log-likelihood 240 843.1
Rho2 (0) 0.227
AIC 81 770.1
BIC 82 121.1
Note. The ASCOT measure is reproduced with permission from the University of Kent. All rights reserved.
AIC indicates Akaike information criterion; ASCOT, Adult Social Care Outcomes Toolkit; BA, bachelor of arts; BIC, Bayesian information criterion; MA, master of arts; PhD,
doctor of philosophy; SE, standard error; S-MNL, scale heterogeneity multinomial logit regression.
The largest coefficient was estimated for the 'occupation' A final model was estimated to explore variation in preferences
attribute at level 1. The second largest coefficient was the 'control between groups. Results for the taste heterogeneity S-MNL model
over daily life' attribute at level 1. The lowest coefficient was are presented in Table 5.
estimated for the 'control over daily life attribute' at level 4, fol- The taste heterogeneity S-MNL model showed similar results
lowed by the second-lowest coefficient, 'occupation' attribute at compared to the original MNL and S-MNL models, where partic-
level 4. ipants placed the highest valuation on occupation at level 1 and
The parameters of the position variables capturing instances in the lowest valuation on 'control over daily life' at level 4.
which an attribute was chosen in a particular position for the best Those with higher educational qualifications placed a higher
and second-best choices were all statistically significant. There was value on 'occupation' level 1 compared to those with other
no clear trend for positioning of worst and second-worst choices. educational qualifications. Individuals with short-term tertiary
A second model was estimated to investigate the potential educational qualifications also placed a higher value on 'control
influence of scaling effects on preferences. Results for the S-MNL over daily life' level 1. The top level of the 'space and time to be
model with scale effects are presented in Table 4. yourself' attribute was also valued more highly by those who
The attribute-level coefficients were all statistically significant identify with social grade A (higher managerial, administrative, or
compared to 'control over daily life' at level 4, similar to the professional) than those who identify with any other social grade
findings from the original MNL model. Participants placed the classification. Individuals who identify with social grade B (inter-
highest valuation on 'occupation' at level 1 and the lowest valu- mediate managerial, administrative, or professional) were less
ation on 'control over daily life' at level 4. Position effects were concerned if they were in a situation in which they would “have
also consistent with the original MNL model. some encouragement and support, but not enough” than in-
The scale parameters revealed significant variations in error dividuals identifying with any other social grade classification.
variance among different groups. Findings showed those who Those of Christian faith (all denominations) also placed a lower
were aged 45 years and older, those who had higher educational value on the bottom level of the 'support' attribute. Married in-
qualifications, and those who spent more than 6 minutes dividuals valued the 'control over daily life' attribute higher and
completing the BWS task made more deterministic choices and the 'social participation' attribute lower compared to their un-
showed less error variance compared to their group counterparts. married counterparts.1436 VALUE IN HEALTH DECEMBER 2019
Table 5. Estimated parameters for the ASCOT-Carer measure using general population data from England taste heterogeneity S-MNL
model (N = 981).
Attribute-level Taste S-MNL
coefficient SE t-ratio
(robust)
Occupation
1. I’m able to spend my time as I want, doing things I value or enjoy (BA/MA/PhD or equivalent 2.850 0.191 14.9
education)
1. I’m able to spend my time as I want, doing things I value or enjoy (below BA/MA/PhD or 2.784 0.185 15.0
equivalent education)
2. I’m able do enough of the things I value or enjoy with my time 2.620 0.172 15.2
3. I do some of the things I value or enjoy with my time, but not enough 1.476 0.103 14.4
4. I don’t do anything I value or enjoy with my time 0.132 0.038 3.5
Control over daily life
1. I have as much control over my daily life as I want (short-term tertiary education) 2.828 0.214 13.2
1. I have as much control over my daily life as I want (education other than short-term tertiary 2.573 0.175 14.7
education)
2. I have adequate control over my daily life 2.202 0.148 14.9
3. I have some control over my daily life, but not enough 1.229 0.088 14.0
4. I have no control over my daily life 0.000 0.000 Constant
All levels: respondent living as married 0.174 0.027 6.6
Looking after yourself
1. I look after myself as well as I want 2.153 0.147 14.6
2. I look after myself well enough 2.033 0.141 14.4
3. Sometimes I can’t look after myself well enough 0.511 0.050 10.3
4. I feel I am neglecting myself 0.243 0.041 6.0
Safety
1. I feel as safe as I want 2.013 0.139 14.5
2. Generally I feel adequately safe, but not as safe as I would like 1.186 0.083 14.2
3. I feel less than adequately safe 0.684 0.056 12.2
4. I don’t feel at all safe 0.348 0.044 8.0
Social participation and involvement
1. I have as much social contact as I want with people I like 2.173 0.145 15.0
2. I have adequate social contact with people 1.949 0.130 15.0
3. I have some social contact with people, but not enough 1.260 0.092 13.8
4. I have little social contact with people and feel socially isolated 0.414 0.046 8.9
All levels: respondent living as married 20.061 0.026 22.3
Space and time to be yourself
1. I have all the space and time I need to be myself (social grade A- high managerial, adminis- 2.742 0.021 13.4
trative or professional)
1. I have all the space and time I need to be myself (below social grade A) 2.543 0.169 15.0
2. I have adequate space and time to be myself 2.291 0.151 15.2
3. I have some of the space and time I need to be myself, but not enough 1.350 0.096 14.0
4. I don’t have any space or time to be myself 0.260 0.041 6.3
Feeling supported and encouraged
1. I feel I have the encouragement and support I want 2.251 0.152 14.8
2. I feel I have adequate encouragement and support 2.123 0.142 15.0
continued on next pagePREFERENCE-BASED ASSESSMENTS 1437
Table 5. Continued
Attribute-level Taste S-MNL
coefficient SE t-ratio
(robust)
3. I feel I have some encouragement and support, but not enough (social grade B- intermediate 1.208 0.094 12.9
managerial, administrative or professional)
3. I feel I have some encouragement and support, but not enough (all other social grades) 1.243 0.091 13.6
4. I feel I have no encouragement and support (respondent reported as Christian (all)) 0.341 0.055 6.6
4. I feel I have no encouragement and support (everyone else: respondent reported as no 0.411 0.053 7.8
religion/Buddhist/Hindu/Muslim/Sikh/Any other religion)
Domain position in the BWS task
Position 1_B 0.000 0.000 Constant
Position 2_B 20.097 0.030 23.2
Position 3_B 20.162 0.031 25.2
Position 4_B 20.221 0.033 26.7
Position 5_B 20.255 0.035 27.4
Position 6_B 20.282 0.036 27.9
Position 7_B 20.268 0.036 27.4
Position 1_W 0.000 0.000 Constant
Position 2_W 0.021 0.031 0.7
Position 3_W 0.000 0.032 0.0
Position 4_W 0.021 0.033 0.6
Position 5_W 0.023 0.033 0.7
Position 6_W 20.016 0.033 20.5
Position 7_W 0.033 0.033 1.0
Scale parameters
Scale parameter for younger participants: data relates to participants aged 18 years – 44 years 1.000 0.000 Base
Scale parameter for older participants: data relates to participants aged 451 years 1.182 0.060 3.1
Scale parameter for time to complete BWS task: duration # 6 minutes (360 seconds) 1.000 0.000 Base
Scale parameter for time to complete BWS task: duration . 6 minutes (361 seconds1) 1.242 0.073 3.3
Scale parameter for participants with lower educational qualifications (below BA/MA/PhD or 1.000 0.000 Base
equivalent)
Scale parameter for participants with higher educational qualifications (BA/MA/PhD or 1.200 0.058 3.4
equivalent)
No. of observations 31 392
df 49
Final log-likelihood 240 781.9
Rho2 (0) 0.227
AIC 81 661.8
BIC 82 071.2
Note. The ASCOT measure is reproduced with permission from the University of Kent. All rights reserved.
AIC indicates Akaike information criterion; ASCOT, Adult Social Care Outcomes Toolkit; BIC, Bayesian information criterion; SE, standard error.
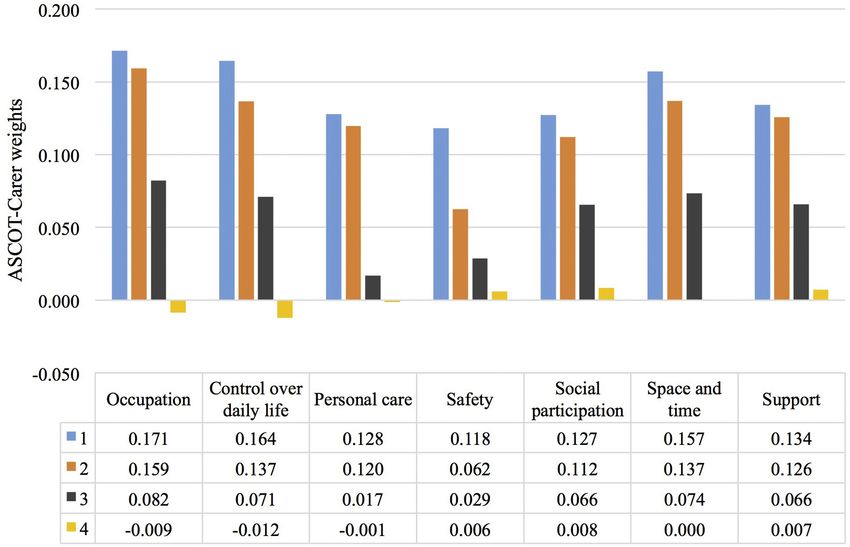
ASCOT-Carer Preference-Based Index Values heterogeneity S-MNL model.) The final preference-based index
values for all attribute-levels of the ASCOT-Carer are presented in
Population proportions were applied to certain coefficients
Figure 1.
showing evidence of taste heterogeneity and correcting for sample
We can calculate the overall SCRQoL informal carer state by
unrepresentativeness. The coefficients were adjusted, and the
summing the preference-based index values for the selected levels
weighted average values were rescaled. (See Appendix Table 1 in
across each attribute. For instance, the value for state 333333
Supplemental Materials found at https://doi.org/10.1016/j.jval.201
(0.405) is the sum of values at level 3 (some needs) across all
9.07.014 for a comparison of rescaled coefficients [0-1 values] from
attributes of the ASCOT-Carer.
the basic MNL model, the S-MNL model, and the taste1438 VALUE IN HEALTH DECEMBER 2019
Figure 1. ASCOT-Carer preference-based index values (N = 981).
Discussion the literature.35,36,45 This framing was not apparent for worst (first
and second) choices. Participants may use different heuristics and
The current study produced a set of preference-based index psychological processes when evaluating profiles and selecting
values for the ASCOT-Carer within a general sample from England. best and worst choices.53 For instance, respondents may be more
Respondents placed the highest value on the 'occupation' attribute at inclined to choose the first or second positioned item for the best
level 1 and a lower value on other attributes, with the lowest valu- choices but examine each item in every position for the worst
ation on the 'control over daily life' attribute at level 4. These values choices. Choice probability from the MNL model assumes all
can be used to assess the impact of interventions on older individuals participants consider the process of choosing best and worst
and their informal carers in England for economic evaluations. choices is the same, and this work further confirms the need to
We found the values of the levels within each attribute of randomize the ordering of the attributes to control for the
the ASCOT-Carer monotonically increased, which was in-line ordering effect in the BWS task.
with our expectations given that the levels were placed on an There were also significant differences in preferences for
ordinal scale. The largest utility differences were found be- SCRQoL in informal carers based on socioeconomic and socio-
tween the second highest-valued level (level 2) compared to demographic characteristics, including education, marital status,
the second lowest-valued level (level 3) for all attributes except social grade, and religion. Further results showed variations in
the 'safety' attribute. There were fewer differences between the error between groups. The significant age and education effects
highest and second-highest valued level (levels 1 and 2). The on error variance may relate to cognitive ability, which has been
steep drop in perceived utility when moving between level 2 shown to underlie choice behavior.23,31 Those who took longer
and level 3 may indicate that people tend to place higher value time to complete the BWS exercise showed less error variance
on positively framed outcomes (ie, ideal state or no needs), and compared to faster respondents. This finding is in line with
major changes to utility are implemented once reaching a previous work revealing greater error variance for quicker re-
certain state (ie, some needs or high needs). Interestingly, for spondents in online stated-choice experiments.54 One explana-
the 'safety' attribute, the decrements between the levels were tion is some respondents take longer to understand the cognitive
fairly similar. processes underpinning the BWS task, suggesting slower re-
We further explored position effects on best and worst choices. spondents use more cognitive effort and make more determin-
Results identified that the position of the attributes in the list istic choices.55 This includes taking into account all of the
framed how respondents made best (first and second) choices. attributes in each scenario and weighing the available
Respondents were more likely to indicate attributes presented at alternatives.56
the top of the list were the best, and less likely to choose attributes This work further investigates the BWS exercise to assess
as the best as they moved down the list, which is consistent with whether it is a viable technique to value SCRQoL states in a generalPREFERENCE-BASED ASSESSMENTS 1439
sample. There was good completion of the BWS exercise, and most REFERENCES
participants understood the BWS and were able to put themselves
into the hypothetical state as a carer.31 Most participants also 1. Al-Janabi H, Van Exel J, Brouwer W, Coast J. A framework for including family
health spillovers in economic evaluation. Med Decis Making. 2016;36(2):176–
found the exercise fairly easy to complete. The BWS exercise was
186.
administered through a web-based survey, which allowed par- 2. Al-Janabi H, Van Exel J, Brouwer W, et al. Measuring health spillovers for
ticipants to easily access and complete the questionnaire. This economic evaluation: a case study in meningitis. Health Econ.
2016;25(12):1529–1544.
design also allowed us to achieve a large sample size to give
3. Wittenberg E, Prosser LA. Disutility of illness for caregivers and families: a
sufficient power to estimate preferences and provide robust re- systematic review of the literature. Pharmacoeconomics. 2013;31(6):489–500.
sults to explore scale and taste heterogeneity.41 4. Prosser LA, Lamarand K, Gebremariam A, Wittenberg E. Measuring family
There are some limitations worth noting in the study. It is HRQoL spillover effects using direct health utility assessment. Med Decis
Making. 2015;35(1):81–93.
argued that scale and taste heterogeneity should be investigated 5. Pinquart M, Sörensen S. Differences between caregivers and noncaregivers in
together, but there is some debate about whether estimates from psychological health and physical health: a meta-analysis. Psychol Aging.
the S-MNL model are biased.57 The S-MNL models are routinely 2003;18(2):250–267.
6. Pinquart M, Sörensen S. Correlates of physical health of informal caregivers: a
used to estimate preferences42; however, others proposed using meta-analysis. J Gerontol B Psychol Sci Soc Sci. 2007;62(2):P126–P137.
alternative methods to analyze the data, such as scale-adjusted 7. Al-Janabi H, Flynn TN, Coast J. Estimation of a preference-based carer expe-
latent class analysis.31,32 Future work could further examine rience scale. Med Decis Making. 2011;31(3):458–468.
8. Basu A, Meltzer D. Implications of spillover effects within the family for
BWS data using this method to further investigate the accuracy of medical cost-effectiveness analysis. J Health Econ. 2005;24(4):751–773.
the method. Another limitation is some variable subgroups of the 9. Al-Janabi H, Flynn TN, Coast J. QALYs and carers. Pharmacoeconomics.
sample were unrepresentative compared to the general popula- 2011;29(12):1015–1023.
10. Goodrich K, Kaambwa B, Al-Janabi H. The inclusion of informal care in
tion (education, marital status, social grade, and religion). We
applied economic evaluation: a review. Value Health. 2012;15(6):975–981.
aimed to account for this by adjusting the coefficients to take into 11. Reed C, Barrett A, Lebrec J, et al. How useful is the EQ-5D in assessing the
account population proportions. impact of caring for people with Alzheimer’s disease? Health Qual Life Out-
comes. 2017;15(1):16.
There are a number of implications for social care policy and
12. Michels CT, Boulton M, Adams A, Wee B, Peters M. Psychometric properties of
practice drawn from this work. This study has filled a gap by carer-reported outcome measures in palliative care: a systematic review.
generating preference weights for the ASCOT-Carer, an outcome Palliat Med. 2016;30(1):23–44.
measure for informal carers based on attributes that matter most 13. Harvey K, Catty J, Langman A, et al. A review of instruments developed to
measure outcomes for carers of people with mental health problems. Acta
to people. This expands the use of the measure, making it suitable Psychiatr Scand. 2008;117(3):164–176.
for use in economic evaluations of interventions and support. The 14. Shilling V, Matthews L, Jenkins V, Fallowfield L. Patient-reported outcome
ASCOT-Carer was designed to capture broader well-being experi- measures for cancer caregivers: a systematic review. Qual Life Res.
2016;25(8):1859–1876.
ences relevant to caring for other people, rather than simply 15. Deeken JF, Taylor KL, Mangan P, Yabroff KR, Ingham JM. Care for the care-
measuring health effects. This is useful for social care practice36 in givers: a review of self-report instruments developed to measure the burden,
England and could complement the preference-weighted ASCOT needs, and quality of life of informal caregivers. J Pain Symptom Manage.
2003;26(4):922–953.
service user measure to understand the impact of interventions on 16. Wiseman V. Caring: the neglected health outcome? or input? Health Policy.
older people and people with long-term conditions and their 1997;39(1):43–53.
informal carers. 17. Brouwer WBF, van Exel NJA, van Gorp B, Redekop WK. The CarerQol in-
strument: a new instrument to measure care-related quality of life of
informal caregivers for use in economic evaluations. Qual Life Res.
2006;15(6):1005–1021.
Conclusion 18. Al-Janabi H, Coast J, Flynn TN. What do people value when they provide
unpaid care for an older person? A meta-ethnography with interview follow-
We estimated a set of preference-weighted index values for the up. Soc Sci Med. 2008;67(1):111–121.
English version of the ASCOT-Carer measure from the general 19. Rand SE, Malley JN, Netten AP, Forder JE. Factor structure and construct
validity of the Adult Social Care Outcomes Toolkit for Carers (ASCOT-Carer).
population in England using BWS. BWS has shown to be a viable Qual Life Res. 2015;24(11):2601–2614.
technique to value SCRQoL informal carer states to be used for 20. Rand SE, Malley JN, Netten AP. Measuring the Social Care Outcomes of
understanding the impact of social care and interventions on older Informal Carers: An Interim Technical Report for the Identifying the Impact
of Social Care (IIASC) Study. England: Canterbury; 2012. QORU Discussion
people, people with long-term conditions and their informal Paper 2833.
carers in England for economic evaluations. 21. Smith N, Holder J, Netten A. Measuring outcomes for carers. Paper pre-
sented at: British Society of Gerontology Annual Conference; September
4-6, 2008.
Acknowledgments 22. Holder J, Smith N, Netten A. Outcomes and Quality for Social Care Services for
Carers: Kent County Council Carers Survey Development Project 2007-2008.
England: Canterbury; 2009. Technical report.
This project was funded by the NORFACE Welfare State Futures program 23. Flynn TN, Louviere JJ, Peters TJ, Coast J. Best–worst scaling: what it can do for
under grant number 462-14-160. In addition, the Austrian contribution to health care research and how to do it. J Health Econ. 2007;26(1):171–189.
this project was cofunded by the Austrian Science Fund (FWF, project 24. Flynn TN. Valuing citizen and patient preferences in health: recent de-
number I 2252-G16) and the Vienna Social Fund (FSW). The Finnish contri- velopments in three types of best–worst scaling. Expert Rev Pharmacoecon
bution to this project was co-funded by the National Institute for Health and Outcomes Res. 2010;10(3):259–267.
25. Mohide EA, Torrance GW, Streiner DL, Pringle DM, Gilbert R. Measuring the
Welfare. The views expressed are not necessarily those of the funders. The
wellbeing of family caregivers using the time trade-off technique. J Clin
authors would like to thank all participants for taking part in the current Epidemiol. 1988;41(5):475–482.
study, as well as participating organizations responsible for recruitment 26. Whitty JA, Walker R, Golenko X, Ratcliffe J. A think aloud study comparing
(Research Now). The authors also thank attendants at the ISPOR 22nd the validity and acceptability of discrete choice and best worst scaling
Annual International Meeting for their useful feedback and suggestions on methods. PLoS One. 2014;9(4):e90635.
this work. 27. Cheung KL, Wijnen BFM, Hollin IL, et al. Using best-worst scaling to investigate
preferences in health care. Pharmacoeconomics. 2016;34(12):1195–1209.
28. Flynn TN, Louviere JJ, Peters TJ, Coast J. Using discrete choice experiments to
Supplemental Material understand preferences for quality of life. Variance-scale heterogeneity
matters. Soc Sci Med. 2010;70(12):1957–1965.
29. Flynn TN, Marley AAJ. Best-worst scaling: theory and methods. In: Hess S,
Supplementary data associated with this article can be found in the Daly A, eds. Handbook of Choice Modelling. Edward Elgar Publishing;
online version at https://doi.org/10.1016/j.jval.2019.07.014. 2014.1440 VALUE IN HEALTH DECEMBER 2019
30. Louviere JJ, Flynn TN, Marley AAJ. Best-Worst Scaling: Theory, Methods and 45. Burge P, Potoglou D, Kim CW, Hess S. How do the public value different
Applications. Cambridge, UK: Cambridge University Press; 2015. outcomes of social care? Estimation of preference weights for ASCOT. 2010.
31. Flynn TN, Huynh E, Peters TJ, et al. Scoring the ICECAP-A capability instru- 46. Coast J, Flynn TN, Natarajan L, et al. Valuing the ICECAP capability index for
ment. Estimation of a UK general population tariff. Health Econ. older people. Soc Sci Med. 2008;67(5):874–882.
2015;24(3):258–269. 47. Office for National Statistics. 2011 Census for England, 181 population from
32. Ratcliffe J, Huynh E, Stevens K, Brazier JE, Sawyer M, Flynn T. Nothing about England and Wales. https://www.nomisweb.co.uk/census/2011/DC1117EW/
us without us? A comparison of adolescent and adult health-state values for view/2092957699?rows=c_age&cols=c_sex. Accessed August 1, 2018.
the child health utility-9D using profile case best-worst scaling. Health Econ. 48. Office for National Statistics. 2015 Analysis Tool. https://www.ons.gov.uk/
2016;25(4):486–496. peoplepopulationandcommunity/populationandmigration/populationestimates/
33. Johnson FR, Lancsar E, Marshall D, et al. Constructing experimental designs datasets/populationestimatesanalysistool. Accessed August 1, 2018.
for discrete-choice experiments: report of the ISPOR conjoint analysis 49. Office for National Statistics. 2011 Census for England, population estimates
experimental design good research practices task force. Value Health. for those aged 161 from England and Wales. https://www.nomisweb.co.uk/
2013;16(1):3–13. census/2011/DC5107EWLA/view/2092957699?rows=c_hlqpuk11&cols=c_
34. Day B, Bateman IJ, Carson RT, et al. Ordering effects and choice set awareness age. Accessed August 1, 2018.
in repeat-response stated preference studies. J Environ Econ Manage. 50. Office for National Statistics. 2011 Census for England, population estimated
2012;63(1):73–91. for those aged between 16 and 74 from England and Wales. https://www.
35. Campbell D, Erdem S. Position bias in best-worst scaling surveys: a case nomisweb.co.uk/census/2011/KS601EW/view/2092957699?rows=cell&cols=c_sex.
study on trust in institutions. Am J Agric Econ. 2015;97(2):526–545. Accessed August 1, 2018.
36. Netten A, Burge P, Malley J, et al. Outcomes of social care for adults: devel- 51. 2011 Census for England, all residents for England between 16 and 64.
oping a preference-weighted measure. Health Technol Assess. 2012;16(16):1– https://www.nomisweb.co.uk/census/2011/QS613EW/view/2092957699?cols=
166. measures. Accessed August 1, 2018.
37. Dolders MGT, Zeegers MPA, Groot W, Ament A. A meta-analysis demon- 52. Office for National Statistics. 2011 Census for England, all residents from
strates no significant differences between patient and population prefer- England and Wales. https://www.nomisweb.co.uk/census/2011/QS302EW/
ences. J Clin Epidemiol. 2006;59(7):653–664. view/2092957699?rows=c_health&cols=rural_urban. Accessed August 1,
38. Dolan P. Whose preferences count? Med Decis Mak. 1999;19(4):482–486. 2018.
39. McFadden D. Conditional logit analysis of qualitative choice behavior. In: 53. Mühlbacher AC, Kaczynski A, Zweifel P, Johnson FR. Experimental measure-
Zarembka P, ed. Frontiers in Econometrics. New York, NY: Academic Press; ment of preferences in health and healthcare using best-worst scaling: an
1974:105–142. overview. Health Econ Rev. 2016;6(1).
40. Train K. Discrete Choice Methods in Simulation. Cambridge, UK: Cambridge 54. Campbell D, Mørkbak MR, Olsen SB. Response time in online stated choice
University Press; 2003. experiments: the non-triviality of identifying fast and slow respondents.
41. Huynh E, Coast J, Rose J, Kinghorn P, Flynn T. Values for the ICECAP- J Environ Econ Policy. 2017;6(1):17–35.
Supportive Care Measure (ICECAP-SCM) for use in economic evaluation at 55. Hawkins GE, Marley AAJ, Heathcote A, Flynn TN, Louviere JJ, Brown SD.
end of life. Soc Sci Med. 2017;189:114–128. Integrating cognitive process and descriptive models of attitudes and pref-
42. Fiebig DG, Keane MP, Louviere J, Wasi N. The generalized multinomial logit erences. Cogn Sci. 2014;38(4):701–735.
model: accounting for scale and coefficient heterogeneity. Mark Sci. 56. Rose JM, Black IR. Means matter, but variance matter too: decomposing
2010;29(3):393–421. response latency influences on variance heterogeneity in stated preference
43. ALOGIT. http://www.alogit.com; 2005. experiments. Mark Lett. 2006;17(4):295–310.
44. Bierlaire M. BIOGEME: a free package for the estimation of discrete choice 57. Keele L, Park DK. Difficult choices: an evaluation of heterogenous choice
models. Paper presented at: 3rd Swiss Transport Research Conference; 2003; models. Paper presented at: 2004 Meeting of the American Political Science
Ascona, Switzerland. Association; Sept. 2-5, 2004; Chicago, IL.You can also read