Aircraft events correspond with vocal behavior in a passerine
←
→
Page content transcription
If your browser does not render page correctly, please read the page content below

www.nature.com/scientificreports
OPEN Aircraft events correspond
with vocal behavior in a passerine
Allison S. Injaian1,2,3*, Ethan D. Lane2 & Holger Klinck1
Airports can affect birds by hindering acoustic communication. Here, we investigated the impacts
of aircraft events on vocal behavior in wood thrush (Hylocichla mustelina) breeding one mile from
an airport in Ithaca, NY, USA. We identified the number of wood thrush songs between 0500 and
0800 h at various distances from the airport and on days with various morning flight schedules. We
also analyzed the number of sites from which birds sang during the peak of aircraft events (proxy
of number of wood thrush). We found that birds sang more from 0600 to 0640 h when there were
aircraft events during this period. This increased vocal behavior is likely explained by increased song
output per individual wood thrush, rather than more wood thrush vocalizing. Increased song rate may
negatively affect wood thrush fitness through increased energetic demands and/or time tradeoffs with
other important behaviors, such as foraging. Identifying the noise thresholds associated with fitness
costs (if any) and how different behavioral strategies (i.e. changing the pattern of vocalizations) may
allow individuals to evade these costs would be useful for establishing conservation policy in breeding
habitats used by passerines, such as the wood thrush.
Transportation networks continue to expand to accommodate the growing human population, causing anthro-
pogenic noise to affect land area across the urban–rural gradient 1. Indeed, anthropogenic noise, such as noise
from aircraft takeoffs, landings and flyovers, has even been found to double noise levels in the majority of pro-
tected areas in the United States 2. Noise profiles produced by aircraft are complex and broadband, due to many
components simultaneously producing sound at both high and low frequencies (e.g., engine noise and airframe
noise)3,4. Additionally, aircraft noise profiles manifest in a frequency range that is audible to many wildlife species
(approx. 500–5000 Hz)5 and are relatively high intensity compared to other anthropogenic noise sources. Areas
approximately 300 m from a 2-lane highway with relatively high traffic volume are exposed to approximately 47
dBA6, whereas areas approximately 300 m from a jet take-off are exposed to approximately 100 d BA7—a differ-
ence that is perceived by humans to be 32 times louder8. The response of wildlife to aircraft noise is an area of
current research, and a recent meta-analysis suggests that animals respond similarly to aircraft noise, as compared
to other types of anthropogenic n oise9. Also, habitats that host breeding birds are generally closer to roadways
than runways, therefore the actual received noise levels, and thus behavioral alterations, may be functionally
similar between aircraft and traffic noise.
To date, there has been much research on how animals, especially birds, respond to anthropogenic noise10,11.
These studies have found altered habitat use12–15, as well as altered communication, such as increased vocal
behavior16–18, decreased vocal b ehavior19, and/or shifts in the timing of vocal b
ehavior20,21 in noisy habitats. Some
studies have also found that exposure to anthropogenic noise is associated with reduced reproductive success22,23.
Species-specific responses to noise (e.g., altered timing of vocalizations) may indicate that behavioral plasticity
allows some individuals to avoid negative consequences of human-induced environmental change. However,
noise-induced behavioral plasticity does not always improve c ommunication24 and may also create a tradeoff
between communication success and mate a ttraction25.
The intermittent and relatively unpredictable nature of some sources of anthropogenic noise, like aircraft
events, may increase the likelihood of negative effects on wildlife, in certain scenarios. Indeed, unpredictable
traffic noise resulted in greater behavioral alterations during the breeding period in Greater sage-grouse (Cen-
trocercus urophasianus), as compared to chronic noise like natural gas drilling r igs26. Exposure to intermittent
aircraft noise and sonic booms, a phenomenon caused by aircraft traveling at speeds greater than the speed of
sound in air, has also resulted in startle responses, and altered parental behaviors, growth and reproduction
in domestic a nimals3,27. Therefore, the intermittent and relatively high amplitude noise associated with early
morning flights (0500–0800 h) may be associated with negative impacts on individual and/or population health
for birds breeding near airports or along flightpaths. These negative consequences may be driven by the overlap
1
Center for Conservation Bioacoustics, Cornell Lab of Ornithology, Ithaca, NY 14850, USA. 2Department of Ecology
and Evolutionary Biology, Cornell University, Ithaca, NY 14850, USA. 3Present address: Odum School of Ecology,
University of Georgia, 140 E. Green St., Athens, GA 30602, USA. *email: inja@uga.edu
Scientific Reports | (2021) 11:1197 | https://doi.org/10.1038/s41598-020-80380-4 1
Vol.:(0123456789)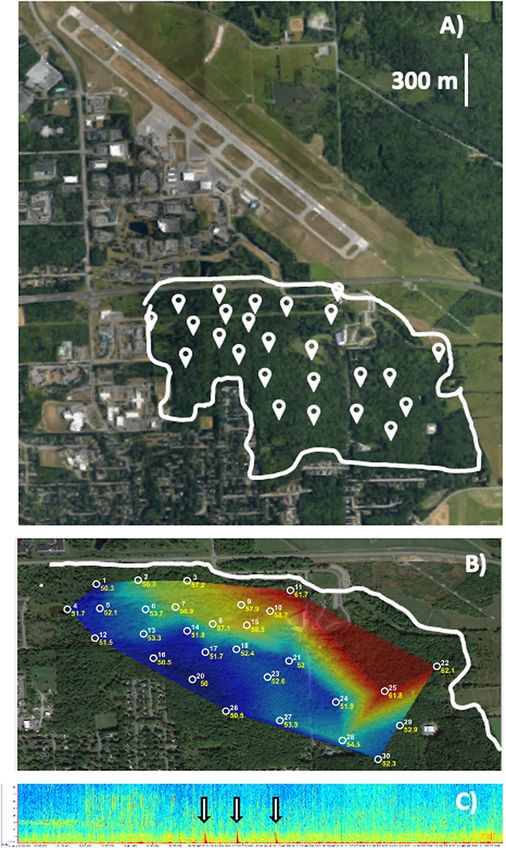
www.nature.com/scientificreports/
of early morning aircraft noise with dawn chorus, the period of time immediately surrounding dawn during
which passerines display their highest rates of vocal behavior to attract mates and maintain territories28. In the
Northern hemisphere, this early dawn chorus is most pronounced during the spring breeding season, as early
singing behavior avoids singing during optimal foraging times later in the day (when temperatures are w armer29).
Therefore, alteration to vocal behavior during dawn chorus may result in decreased pairing success or increased
energetic demands30.
Here, we investigated the impacts of aircraft events on vocal behavior in the wood thrush (Hylocichla mus-
telina) breeding in Sapsucker Woods Sanctuary (hereafter ‘SSW’), a bird sanctuary located approximately one
mile from the Ithaca Tompkins International Airport (ITH), NY, USA. We used passive acoustic monitoring
techniques to assess vocal behavior in wood thrush on days that differed in the number of aircraft events. Specifi-
cally, we calculated a ‘flight score’ for each 10-min period between 0500 and 0800 h (dawn chorus). This ‘flight
score’ parameter was the sum of the number of flights that occurred immediately before and during each 10-min
period from 0500 to 0800 h (see methods below). No birds were directly handled during this study. The wood
thrush is a suitable species in which to study anthropogenic noise impacts, as they, like other passerines, rely on
song to attract mates and maintain territories. Wood thrush vocalizations span a frequency range of approxi-
mately 2–9 kHz (Fig. 4A). Therefore, wood thrush can likely hear below 2 kHz, where much of the sound energy
associated with aircraft events o ccurs31.
We hypothesized a negative relationship between exposure to noise from aircraft events and wood thrush
vocal behavior during dawn chorus, such that the number of wood thrush songs would decrease with greater
exposure to aircraft events. We also predicted a negative relationship between the number of sites with wood
thrush song (our proxy of the number of wood thrush) and aircraft events from 0550 to 0650 h, the peak of
morning aircraft events at the Ithaca Tompkins Regional Airport. If our results show a negative relationship
between aircraft events and vocal behavior, wood thrush may suffer reduced mate pairing success in habitats
near airports or along flightpaths.
Results
Song rate. Our results showed a positive relationship between flight score and wood thrush song output
when taking into account time of day and distance from the airport. Specifically, the number of songs at sites
‘close’ to the runway was higher during the peak of aircraft activity (0550–0650 h; Fig. 1A). The best-ranked
model of wood thrush vocal behavior included a three-way interaction between ‘time’, ‘flight score’ and ‘distance
group’ (Table 1). Also, the 95% CIs for the ‘flight score’ parameter, as well as the interaction effect between ‘time’
and ‘flight score’, do not overlap zero (Table 2). Unsurprisingly, there was a negative relationship between ‘time’
and wood thrush vocal behavior, as peaks in wood thrush song rate occur early in the morning (Fig. 1A–C).
Number of sites with song. The mean number of sites with wood thrush song during the peak of aircraft
activity (our proxy of the number of wood thrush) did not differ based on flight score (Fig. 2). The null model
was best-ranked and received approximately 75% of the model weight (Table 3).
Discussion
Our results showed a positive relationship between aircraft events and wood thrush vocal behavior during certain
time periods, which was opposite our hypothesized negative impact of aircraft events on wood thrush song. This
pattern was strongest at sites closest to the runway, with a 387% average increase in wood thrush vocal behavior
over baseline when flight scores equaled 1 (Fig. 1D) and a 266% average increase over baseline when flight scores
equaled 2 (Fig. 1E). These results are consistent with the findings of previous studies of noise pollution on song
patterns in b irds18,32,33, as well as other t axa17,34,35. Additionally, natural noise sources, such as waterfalls and
torrents, have been found to increase song redundancy in chaffinches (Fringilla coelebs)36. However, it is worth
noting that other studies have found animals, like humpback whales (Megaptera novaeangliae), to be less likely
to produce vocalizations given anthropogenic n oise37. The altered vocal behavior found here may compensate
for any acoustic masking of song during brief aircraft events. Alternatively, altered song may create a tradeoff
between communication success and mate a ttraction25.
The fact that our data also showed no relationship between aircraft events and the number of sites with wood
thrush song during the peak of aircraft activity suggests that the increase in singing activity at sites closer to the
airport is not explained by stimulating more individuals to sing when flights scores equal 1 or 2, as compared to
baseline. Rather, aircraft events may stimulate increased song rate within individuals. Future research investigat-
ing if noise-exposed wood thrush also alter the pitch of their song, as has been found in urban great tits38, and/or
the complexity of their song, as has been found in red-winged blackbirds exposed to experimental n oise39, would
be of great value. Based on our data set, the timescale at which altered vocal behavior may persist in wood thrush
is also unclear. However, past studies have found that other passerines return to baseline song f requency40 and
timing patterns41 relatively soon after experimental noise exposure. Additionally, American black ducks (Anas
rubripes) and European seabass (Dicentrarchus labrax) have been found to behaviorally habituate to variable
sound impulses42,43. The intermittent and somewhat unpredictable nature of aircraft events at the Ithaca Tomp-
kins International Airport (due to inconsistencies in flight schedules) may make the likelihood of habituation
to aircraft noise relatively low for wood thrush in our study system.
Again, because habitat quality for wood thrush differs throughout SSW, regardless of distance from the
airport, we cannot make general claims about the effects of aircraft noise on the distribution of wood thrush
throughout SSW. Yet, our data suggest that forested sites that are only 450 m from the runway are still used by
breeding wood thrush. This lack of avoidance of noise-exposed habitats has also been found in other passerines,
such as serins32. However, it is worth noting that other studies have found that birds avoid noise-exposed habitats,
Scientific Reports | (2021) 11:1197 | https://doi.org/10.1038/s41598-020-80380-4 2
Vol:.(1234567890)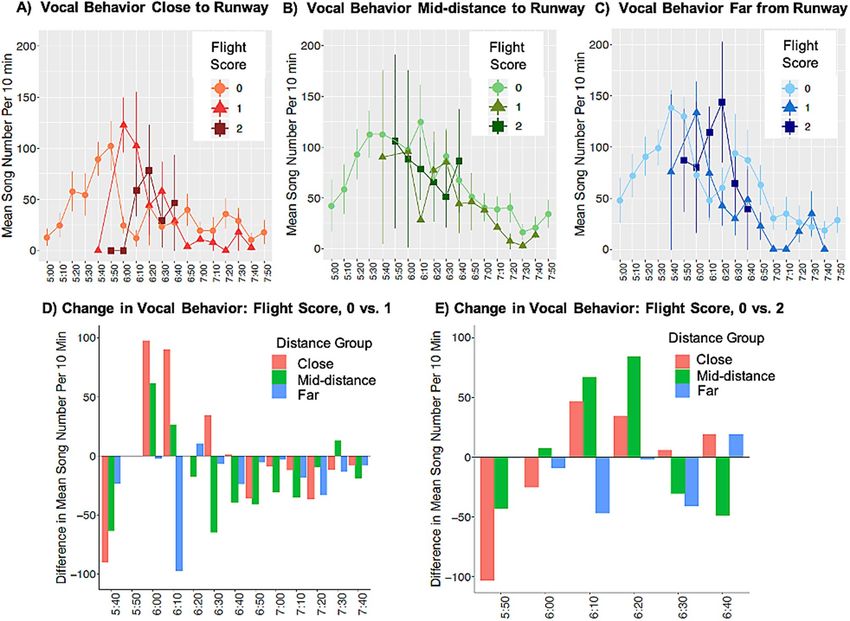
www.nature.com/scientificreports/
Figure 1. Data showing effects of aircraft events on wood thrush vocal behavior across flight scores, sites, and
time. (A–C) Mean wood thrush song number over 10-min time periods (0500–08,000 h) for sites A) close
(450–750 m) B), mid-distance (750–1050 m), and (C) far (1050–1350 m) from the runway. Data represent
means ± 1 Standard Error, split by flight scores. Flight scores represent the number of aircraft events in the focal
time period and the 10 min prior. (D,E) Alternative visualizations for the same data presented in (A–C). For
each time period, the mean number of wood thrush songs that occurred when the flight score equaled zero was
set to the baseline. The data in (D) and (E) are the differences in the mean number of wood thrush songs per
10-min time period between this baseline level and when the flight score was 1 or 2, respectively. Data are split
by distance group: close (red), mid-distance (green), and far (blue).
Model* K AICc ΔAICc Weight
Time + FlightScore + Distance Group + Time*Flight Score + Time*DistanceGroup + FlightScore*Distan
15 5109.34 0 0.999
ce Group + Time*FlightScore*DistanceGroup
Time + FlightScore + DistanceGroup + Time*FlightScore 9 5128.94 19.603 < 0.001
Time + FlightScore + DistanceGroup + FlightScore*DistanceGroup 10 5129.34 20.000 < 0.001
Time + FlightScore + DistanceGroup 8 5139.21 29.877 < 0.001
Time + DistanceGroup 7 5143.14 33.804 < 0.001
Time 5 5156.73 47.393 < 0.001
Table 1. Model comparisons for the relationship between aircraft noise and wood thrush song number. *Date
and site were included in all models as random effects.
both during b reeding14,44 and migration45. It is possible that aircraft noise levels above a certain threshold (which
was not reached in this study) could result in reduced wood thrush vocal behavior and/or habitat use (i.e. a dose
response). Dose–response models in killer whales (Orcinus orca) show avoidance behavior when exposure to ship
noise is greater than 150 dB re 1 μPa46. Also, zebra finches (Taeniopygia guttata) increase the amplitude of their
song with increasing background noise levels, but cease to sing once background noise levels reached 80 dB47.
Scientific Reports | (2021) 11:1197 | https://doi.org/10.1038/s41598-020-80380-4 3
Vol.:(0123456789)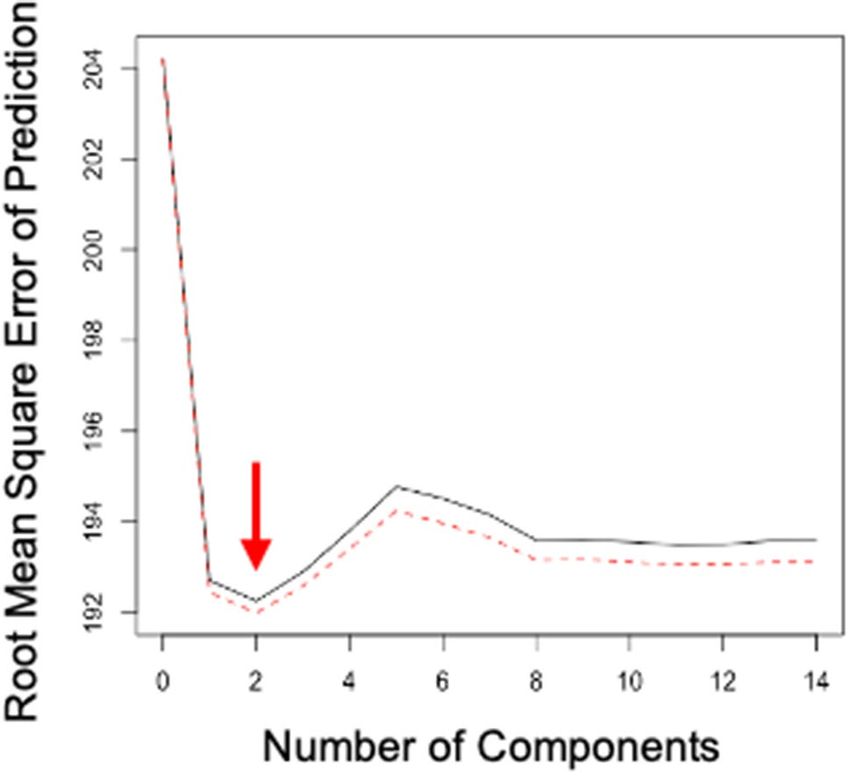
www.nature.com/scientificreports/
Parameter β estimate* 95% CI
(intercept) 63.101 12.555, 113.655
Time − 2.492 − 4.600, − 0.388
FlightScore 110.779 27.257, 193.852
DistanceGroup (mid) 41.068 − 17.602, 99.607
DistanceGroup (far) 52.569 − 10.155, 115.176
Time*FlightScore − 10.138 − 18.549, − 1.668
Time*DistanceGroup (mid) − 1.477 − 4.145, 1.1894
Time*DistanceGroup (far) − 2.285 − 4.951, 0.402
FlightScore*DistanceGroup (mid) − 27.490 − 130.886, 75.562
FlightScore*DistanceGroup (far) − 84.050 − 183.926, 18.046
Time*FlightScore*DistanceGroup (mid) 2.155 − 8.102, 12.423
Time*FlightScore*DistanceGroup (far) 7.868 − 2.263, 17.752
Table 2. Observed relationships (β estimates ± 95% CIs, calculated using ± 1.96*1 Standard Error) between
response variables and parameters for the top-ranked model of wood thrush song number. *Bold text indicates
that 95% CI did not overlap zero.
Figure 2. Data showing effects of aircraft events on a proxy for the number of wood thrush. The number
of mean sites (± 1 Standard Error) with wood thrush songs in 10-min time periods during the peak of flight
activity (0550–0650 h, n = 30 sites). Data is split by flight score (0 = light gray, 1 = medium gray, 2 = black).
Model* K AICc ΔAICc Weight
Time 3 234.02 0 0.654
Time + FlightScore 4 235.99 1.970 0.244
Time + FlightScore + Time*FlightScore 5 237.73 3.709 0.102
Table 3. Model comparisons for the relationship between aircraft noise and habitat use in wood thrush. *Date
was included in all models as a random effect.
Finding a noise threshold at which behavioral changes, and perhaps negative fitness impacts, are expected in
wood thrush, would be highly useful in this system and are an area of future focus.
The potential conservation implications for increased vocal behavior during time periods of increased air-
craft noise are unclear. The wood thrush is a near-threatened species on the IUCN ‘red list’, and their population
declines are thought to be related to reduced availability of forested breeding habitats48,49. Shifts in vocaliza-
tions by birds experiencing anthropogenic noise have been associated with positive, negative, or no effects on
fitness25,50–52. Here, it is possible that the increased wood thrush song rate is associated with slightly increased
energetic demands53,54 and/or time tradeoffs with other important behaviors, such as f oraging55. Alternatively,
Scientific Reports | (2021) 11:1197 | https://doi.org/10.1038/s41598-020-80380-4 4
Vol:.(1234567890)www.nature.com/scientificreports/
wood thrush may suffer no negative fitness consequences given increased vocal behavior, as the number of flights,
and thus the time period during which vocalizations may be masked, is relatively low for the Ithaca Tompkins
International Airport. Overall, the implications of increased vocalizations are unknown in this system. Although
logistically difficult, future work investigating the actual fitness costs associated with altered vocal strategies
for wood thrush in noise-exposed habitats would be of high value, and may be applicable across noise t ype9.
Additionally, knowing the noise thresholds associated with fitness costs (if any) and how different behavioral
strategies (i.e. changing the pattern of vocalizations) may allow individuals to evade these costs would be useful
for establishing conservation policy in breeding habitats used by passerines, such as wood thrush.
Methods
Sound recordings. Recordings were taken at 30 sites in SSW (Ithaca, NY, USA; Lat: 42.481673, Long:
− 76.460053, Fig. 3A), using autonomous recording units (Swifts, Center for Conservation Bioacoustics, Cornell
University) mounted to trees, approximately 2 m off the ground and spaced at least 250 m apart. Swifts recorded
in a single channel (mono) from 1 to 19 May 2017, from 0500 to 0800 h at a 48 kHz sampling rate, with a 16-bit
resolution. The sensitivity of the omnidirectional microphone was − 44 dB re 1 V/Pa (± 2 dB) and the frequency
response is flat (± 3 dB) in the relevant frequency range 100 Hz to 10,000 Hz. The gain was set to 33 dB and the
clipping level of the analog to digital converter (ADC) is ± 0.9 V. Swift sites varied in their distance from the
airport runway (456–1322 m), resulting in differential exposure to aircraft noise (Fig. 3B). Daily weather condi-
tions were similar in Ithaca, NY, USA from 1 May to 19 May 2017 (i.e. no days in which rain functionally altered
wood thrush song).
Sites were categorized as ‘close’ (450–750 m, n = 7 sites), ‘mid-distance’ (750–1050 m, n = 16 sites), or ‘far’
(1050–1350 m, n = 7 sites) from the Ithaca Tompkins International Airport runway for analysis. These three
distance categories were chosen because they equally split the range of distances (456–1322 m) from the runway
that existed in our data and created a parameter across which peak exposure to aircraft noise differed between
groups (ex. 5 May 2017: ‘close’; 73.8 dBA ± 3.9 SD, ‘mid-distance’; 69.3 dBA ± 5.2 SD, ‘far’; 67.3 dBA ± 5.5 SD).
Distance from the runway was measured from the GPS coordinates of each recording location (in decimal
degrees, accurate to approximately ± 3 m) and the center of the only runway at Ithaca Tompkins International
Airport. Additionally, habitat type varies throughout SSW, with larger, denser portions of forest located further
from the airport (see Fig. S2). Because wood thrush prefer these larger, denser forests, and thus might be more
likely to colonize sites further from the airport for reasons unrelated to aircraft noise, we focused on within
distance-group variation for analysis of vocal behavior.
We used a band-limited energy detector in Raven Pro 2.0 (Center for Conservation Bioacoustics, Cornell Lab
of Ornithology) to identify all flight times between 0500 and 0800 h on focal days (minimum frequency = 200 Hz,
maximum frequency = 1000 Hz, minimum duration = 10 s, maximum duration = 45 s, minimum separation = 60 s,
minimum occupancy = 30%, SNR = above 20 dB, block size = 180 s, hop size = 90 s, percentile = 20%). The detec-
tor output was then manually checked by researchers who listened to each auto-detection to ensure it was an
aircraft event. The ambient noise levels (L10 dBA) in SSW were calculated from 0600 to 0700 h on a subset of days
in May 2017 (see supplement). Based on these data, ambient noise levels in SSW differed during time periods
associated with aircraft overflights (5 May: 69.1 L A10 ± 7.2 SD, 9 May: 60.9 L
A10 ± 1.9 SD, 19 May: 65.8 L
A10 ± 4.8
SD), as compared to time periods without overflights (5 May: 58.5 LA10 ± 2.5 SD, 9 May: 54.5 LA10 ± 2.4 SD, 19
May: 58.2 L A10 ± 3.6 SD, see supplement for more details). Given that an increase of 10 dBA is perceived as twice
as loud in humans8 and passerines’ perceptions of sound is thought to be similar, but slightly less sensitive, than
humans31, our data suggest that aircraft events have a substantial impact on the soundscape for birds breeding
in SSW (Fig. 3C and Supplementary Fig. S1). Also, aircraft events altered the acoustic signature of SSW for an
rofiles56.
average of 47.5 s (± 27.4 s SD), similar to previous studies of aircraft noise p
Sound analysis. We analyzed the number of wood thrush songs in a subset of recordings in May 2017
(n = 10 days, Mon–Fri only, May: 1, 2, 3, 4, 5, 8, 9, 15, 17, 18). These specific dates were chosen because they fell
within the early breeding period for wood thrush in Ithaca, NY, USA, when singing for mate attraction and ter-
ritory establishment is most common. These dates also varied in their flight schedule and time of first flight, thus
allowing us to control for the potential impacts of time of day, time of first flight, and number of flights on wood
thrush vocal behavior. On each focal day, we identified all sites with wood thrush song from 0500 to 0800 h and
used data from these sites for our analyses.
To decrease the likelihood of duplicate song records from a given individual in our analysis, we eliminated
sites with simultaneous song if the sites were less than 500 m apart (i.e. adjacent Swift units). Given that we do
not have field data on the number of wood thrush territories present in SSW during May 2017, the presence
of distinct wood thrush song across recording sites is our best estimate of the number of wood thrush singing
in any given 10-min time period. It is important to acknowledge that wood thrush territory size ranges from
0.08 to 4 ha (approximately 800–40,000 m2). Therefore, we may have had multiple wood thrushes recorded by
one unit, or multiple recording units within a single wood thrush territory. Nonetheless, this limitation should
not impact our ability to identify relationships between aircraft events and vocal behavior, as we focused our
analysis on changes in vocal behavior compared to a baseline level (flight score = 0; see below for details). There-
fore, the spatial data found here can provide useful information on the relationship between aircraft events and
wood thrush vocal behavior within SSW and across time.
We used Raven Pro 2.0 to visualize sound recordings and identify all sites with wood thrush song before, dur-
ing, and after aircraft events between 0500 and 0800 h (Fig. 4B). Researchers trained in wood thrush song iden-
tification used template detectors in Raven Pro 2.0 (detection frequency range = 200 Hz and threshold = 0.6–0.8
Scientific Reports | (2021) 11:1197 | https://doi.org/10.1038/s41598-020-80380-4 5
Vol.:(0123456789)www.nature.com/scientificreports/
Figure 3. Maps and spectrograms associated with recoding sites. (A) Aerial map of the Ithaca Tompkins
International Airport and Sapsucker Woods (outlined in white, with recording locations marked by white
points), (B) Distribution of peak amplitude levels (dBA) associated with an aircraft overflight across recording
sites in Sapsucker Woods (greater received amplitude levels indicated in red, lower received amplitude levels
indicated in blue), (C) Spectrogram (kHz vs. h) from 0500 to 0800 h at one recording site in SSW. Aircraft
overflights indicated by arrows. Satellite images for A) and B) were generated from GoogleEarth (version 7.3.2,
https://earth.google.com/web/search/Sapsucker+Woods,+Ithaca,+NY/).
Scientific Reports | (2021) 11:1197 | https://doi.org/10.1038/s41598-020-80380-4 6
Vol:.(1234567890)www.nature.com/scientificreports/
Figure 4. Spectrograms associated with recoding sites. (A) Spectrogram (kHz vs. s) of four wood thrush songs,
with each song boxed in white. (B) Spectrogram (kHz vs. s) of wood thrush songs before, during and after an
aircraft event (start of aircraft event indicated by the white arrow).
depending on quality of recording, with loose matching and non-merged templates) to detect and annotate
each individual wood thrush song (Fig. 4A). Detector outputs were also manually checked to ensure accuracy.
In addition, we analyzed recordings to assess the relationship between aircraft events and the number of
sites with wood thrush song (our proxy of the number of wood thrush). Specifically, we focused on the peak of
morning aircraft activity at the Ithaca Tompkins International Airport, which occurs from 0550 to 0650 h. These
data on the number of sites with wood thrush song allow us to contextualize any differences in song number.
For example, if we found a negative relationship between aircraft events and wood thrush song number, but no
difference in the number of sites with wood thrush song, our results would suggest that wood thrush are reducing
song rate to some non-zero value, but not leaving their territories or completely ceasing song production during
time periods affected by aircraft noise.
To assess whether sites had thrush territories present, we again used Raven Pro 2.0 to visualize sound record-
ings from 0550 to 0650 h, the peak of morning aircraft activity at our sites. Therefore, our data represented the
presence or absence of wood thrush song in each 10-min time period at each site during May 2017. We then
compared the number of sites with wood thrush song in each 10-min time period across flight scores (flight
score = 0, 1, or 2; see paragraph on statistical analysis below). Similar to our previously described methods, we
only included simultaneous song data if the sites were greater than 500 m apart to avoid duplicate bird song in our
analysis. Unfortunately, there were no days in May 2017 in which zero flights went out from the Ithaca Tompkins
International Airport between 0550 and 0650 h; therefore, we cannot gauge wood thrush vocal behavior in the
complete absence of aircraft events.
To better understand the relationship between aircraft noise and wood thrush vocal behavior across time,
we summed the number of songs per 10-min time period at each site, from 0500 to 0800 h. Wood thrush vocal
behavior during a focal 10-min time period may be affected by flight(s) that occurred in that time period, as
Scientific Reports | (2021) 11:1197 | https://doi.org/10.1038/s41598-020-80380-4 7
Vol.:(0123456789)www.nature.com/scientificreports/
Figure 5. Figure output from partial least squares analysis. Root mean square error of prediction (RMSEP)
shown across ‘flight impact score’ components (e.g. FlightNumberT + FlightNumberT−1, + FlightNumberT−2
… FlightNumberT−13, n = 14 components). The red arrow indicates that the lowest RMSEP is achieved with 2
components.
well as any flights that occurred earlier in the morning. To identify the extent to which flight history affects
wood thrush songs in any successive 10-min time period, we ran a partial least squares analysis which included
a flight number parameter for each focal 10-min time period (e.g. FlightNumberT + FlightNumberT−1, + Flight-
NumberT−2… FlightNumberT−13, n = 14). The partial least squares analysis indicated that the error was lowest
with the first two parameters (e.g. F lightNumberT+ FlightNumberT−1, Fig. 5). Therefore, we created a ‘flight score’
parameter that was the sum of the number of flights that occurred in the focal 10-min time period, as well as
the 10-min time period prior (i.e. if the focal time period was 0600–0610 h and there was one flight at 0552 and
another flight at 0607, the flight score associated with the focal time period would be 2). We then ran general-
ized linear models, with the number of wood thrush songs per 10-min time period as the dependent variable.
In each model in our model set, we included ‘site’ and ‘date’ as random effects, and ‘time’ as a fixed effect. We
included ‘date’ in these analyses to account for the change in sunrise (and thus the expected time at which birds
will start singing) and the reproductive stage of individuals. Additional models included a combination of the
main effects and/or interaction effects for ‘distance group’ and ‘flight score’ parameters. Both ‘distance group’
and ‘flight score’ were included as fixed effects (see Table 2 for the full model set).
For our second analysis, data recorded the presence or absence of wood thrush song in each 10-min time
period, across sites and days. Therefore, we ran generalized linear mixed models with binomial distributions,
using the glmer function in the glmm package in R. All models in this model set included ‘date’ as a random
effect. We also included models that accounted for both the main and/or interaction effects between ‘time’ and
‘flight score’ (see Table 1 for the full model set).
For the models associated with each analysis, we used the values of Akaike Information Criterion corrected
for small sample sizes (AICc) and model weights for model c omparisons57,58. These comparisons allowed us to
evaluate the hypotheses that exposure to aircraft events was related to our dependent variables: if models includ-
ing the measure of ‘flight score’ were ranked higher than models that did not include this term, our results suggest
that aircraft events explain a considerable proportion of variation in our data. For the top-ranked models that
included the ‘flight score’ parameter, we estimated the effect size (β parameter estimates) and 95% confidence
intervals (CI) of our noise parameters through the summary function in R. We assessed the importance of effect
sizes based on whether the 95% CI overlapped zero (Table 2).
Data availability
Data will be made available on Dryad upon acceptance.
Received: 25 March 2020; Accepted: 9 December 2020
References
1. Barber, J. R., Crooks, K. R. & Fristrup, K. M. The costs of chronic noise exposure for terrestrial organisms. Trends Ecol. Evol. 25,
180–189 (2010).
2. Buxton, R. T. et al. Noise pollution is pervasive in US protected areas. Science (80-) 356, 531–533 (2017).
3. Manci, K. M., Gladwin, D. N., Villella, R. & Cavendish, M. G. Effects of aircraft noise and sonic booms on domestic animals and
wildlife: a literature synthesis (Engineering and Services Center U. S. Air Force, 1988).
Scientific Reports | (2021) 11:1197 | https://doi.org/10.1038/s41598-020-80380-4 8
Vol:.(1234567890)www.nature.com/scientificreports/
4. Pott-Pollenske, M. et al. Airframe noise characteristics from flyover measurements and prediction. In 12th AIAA/CEAS Aeroa-
coustics Conference (27th AIAA Aeroacoustics Conference) 2567 (2006).
5. Khardi, S. Reduction of commercial aircraft noise emission around airports. A new environmental challenge. Eur. Transp. Res.
Rev. 1, 175–184 (2009).
6. Dooling, R. J. & Popper, A. N. The effects of highway noise on birds (The California Department of Transportation Division of
Environmental Analysis, 2007).
7. Etzel, R. A. & Balk, S. J. Pediatric environmental health (American Academy of Pediatrics, Itasca, 2011).
8. Schomer, P. D. Growth function for human response to large-amplitude impulse noise. J. Acoust. Soc. Am. 64, 1627–1632 (1978).
9. Kunc, H. P. & Schmidt, R. The effects of anthropogenic noise on animals: a meta-analysis. Biol. Lett. 15, 20190649 (2019).
10. Shannon, G. et al. A synthesis of two decades of research documenting the effects of noise on wildlife. Biol. Rev. 91, 982–1005
(2016).
11. Slabbekoorn, H. et al. A noisy spring: the impact of globally rising underwater sound levels on fish. Trends Ecol. Evol. 25, 419–427
(2010).
12. Brown, A. L. Measuring the effect of aircraft noise on sea birds. Environ. Int. 16, 587–592 (1990).
13. McLaughlin, K. E. & Kunc, H. P. Experimentally increased noise levels change spatial and singing behaviour. Biol. Lett. 9, 20120771
(2013).
14. Injaian, A. S., Poon, L. Y. & Patricelli, G. L. Effects of experimental anthropogenic noise on avian settlement patterns and reproduc-
tive success. Behav. Ecol. 29, 1181–1189 (2018).
15. McClure, C. J. W., Ware, H. E., Carlisle, J., Kaltenecker, G. & Barber, J. R. An experimental investigation into the effects of traffic
noise on distributions of birds: avoiding the phantom road. Proc. R. Soc. London B Biol. Sci. 280, 20132290 (2013).
16. Kruger, D. J. D. & Du Preez, L. H. The effect of airplane noise on frogs: a case study on the Critically Endangered Pickersgill’s reed
frog (Hyperolius pickersgilli). Ecol. Res. 31, 393–405 (2016).
17. Melcon, M. L. et al. Blue whales respond to anthropogenic noise. PLoS ONE 7, e32681 (2012).
18. Sierro, J., Schloesing, E., Pavón, I. & Gil, D. European blackbirds exposed to aircraft noise advance their chorus, modify their song
and spend more time singing. Front. Ecol. Evol. 5, 68 (2017).
19. McCarthy, E. et al. Changes in spatial and temporal distribution and vocal behavior of Blainville’s beaked whales (Mesoplodon
densirostris) during multiship exercises with mid-frequency sonar. Mar. Mammal Sci. 27, E206–E226 (2011).
20. Dominoni, D. M., Greif, S., Nemeth, E. & Brumm, H. Airport noise predicts song timing of European birds. Ecol. Evol. 6, 6151–6159
(2016).
21. Gil, D., Honarmand, M., Pascual, J., Pérez-Mena, E. & Macías, G. C. Birds living near airports advance their dawn chorus and
reduce overlap with aircraft noise. Behav. Ecol. 26, 435–443 (2014).
22. Habib, L., Bayne, E. M. & Boutin, S. Chronic industrial noise affects pairing success and age structure of ovenbirds Seiurus auro-
capilla. J. Appl. Ecol. 44, 176–184 (2007).
23. Halfwerk, W., Holleman, L. J. M., Lessells, C. K. & Slabbekoorn, H. Negative impact of traffic noise on avian reproductive success.
J. Appl. Ecol. 48, 210–219 (2011).
24. Wolfenden, A. D., Slabbekoorn, H., Kluk, K. & de Kort, S. R. Aircraft sound exposure leads to song frequency decline and elevated
aggression in wild chiffchaffs. J. Anim. Ecol. 88, 1720–1731 (2019).
25. Halfwerk, W. et al. Low-frequency songs lose their potency in noisy urban conditions. Proc. Natl. Acad. Sci. 108, 14549–14554
(2011).
26. Blickley, J. L., Blackwood, D. & Patricelli, G. L. Experimental evidence for the effects of chronic anthropogenic noise on abundance
of Greater Sage-Grouse at leks. Conserv. Biol. 26, 461–471 (2012).
27. Pepper, C. B., Nascarella, M. A. & Kendall, R. J. A review of the effects of aircraft noise on wildlife and humans, current control
mechanisms, and the need for further study. Environ. Manag. 32, 418–432 (2003).
28. Staicer, C. A., Spector, D. A. & Horn, A. G. The dawn chorus and other diel patterns in acoustic signaling. In Ecology and evolution
of acoustic communication in birds, 426–453 (1996).
29. Gil, D. & Llusia, D. The bird dawn chorus revisited. In Coding strategies in vertebrate acoustic communication 45–90 (Springer,
Berlin, 2020).
30. Warren, P. S., Katti, M., Ermann, M. & Brazel, A. Urban bioacoustics: It’s not just noise. Anim. Behav. 71, 491–502 (2006).
31. Dooling, R. Avian hearing and the avoidance of wind turbines (University of Maryland, College Park, 2002).
32. Díaz, M., Parra, A. & Gallardo, C. Serins respond to anthropogenic noise by increasing vocal activity. Behav. Ecol. 22, 332–336
(2011).
33. Gentry, K. E. & Luther, D. A. Spatiotemporal patterns of avian vocal activity in relation to urban and rural background noise. J.
Ecoacoust. https://doi.org/10.22261/jea.z9tqh (2017).
34. Cunnington, G. M. & Fahrig, L. Plasticity in the vocalizations of anurans in response to traffic noise. Acta Oecologica 36, 463–470
(2010).
35. Kaiser, K. & Hammers, J. The effect of anthropogenic noise on male advertisement call rate in the neotropical treefrog, Dendrop-
sophus triangulum. Behaviour 146, 1053–1069 (2009).
36. Brumm, H. & Slater, P. J. B. Ambient noise, motor fatigue, and serial redundancy in chaffinch song. Behav. Ecol. Sociobiol. 60,
475–481 (2006).
37. Meh, F. et al. Humpback whales Megaptera novaeangliae alter calling behavior in response to natural sounds and vessel noise.
Mar. Ecol. Prog. Ser. 607, 251–268 (2018).
38. Slabbekoorn, H. & Peet, M. Ecology: birds sing at a higher pitch in urban noise. Nature 424, 267 (2003).
39. Ríos-Chelén, A. A., Lee, G. C. & Patricelli, G. L. Anthropogenic noise is associated with changes in acoustic but not visual signals
in red-winged blackbirds. Behav. Ecol. Sociobiol. 69, 1139–1151 (2015).
40. Gross, K., Pasinelli, G. & Kunc, H. P. Behavioral plasticity allows short-term adjustment to a novel environment. Am. Nat. 176,
456–464 (2010).
41. Gentry, K. E., McKenna, M. F. & Luther, D. A. Evidence of suboscine song plasticity in response to traffic noise fluctuations and
temporary road closures. Bioacoustics 27, 165–181 (2018).
42. Conomy, J. T., Dubovsky, J. A., Collazo, J. A. & Fleming, W. J. Do black ducks and wood ducks habituate to aircraft disturbance?.
J. Wildl. Manag. 62, 1135–1142 (1998).
43. Neo, Y. Y., Hubert, J., Bolle, L. J., Winter, H. V. & Slabbekoorn, H. European seabass respond more strongly to noise exposure at
night and habituate over repeated trials of sound exposure. Environ. Pollut. 239, 367–374 (2018).
44. Halfwerk, W., Both, C. & Slabbekoorn, H. Noise affects nest-box choice of 2 competing songbird species, but not their reproduc-
tion. Behav. Ecol. 27, 1592–1600 (2016).
45. Ware, H. E., McClure, C. J. W., Carlisle, J. D. & Barber, J. R. A phantom road experiment reveals traffic noise is an invisible source
of habitat degradation. Proc. Natl. Acad. Sci. 112, 12105–12109 (2015).
46. Williams, R., Erbe, C., Ashe, E., Beerman, A. & Smith, J. Severity of killer whale behavioral responses to ship noise: A dose–response
study. Mar. Pollut. Bull. 79, 254–260 (2014).
47. Cynx, J., Lewis, R., Tavel, B. & Tse, H. Amplitude regulation of vocalizations in noise by a songbird Taeniopygia guttata. Anim.
Behav. 56, 107–113 (1998).
Scientific Reports | (2021) 11:1197 | https://doi.org/10.1038/s41598-020-80380-4 9
Vol.:(0123456789)www.nature.com/scientificreports/
48. Rushing, C. S., Ryder, T. B. & Marra, P. P. Quantifying drivers of population dynamics for a migratory bird throughout the annual
cycle. Proc. R. Soc. B Biol. Sci. 283, 20152846 (2016).
49. Stanley, C. Q. et al. Connectivity of wood thrush breeding, wintering, and migration sites based on range-wide tracking. Conserv.
Biol. 29, 164–174 (2015).
50. Kleist, N. J., Guralnick, R. P., Cruz, A. & Francis, C. D. Anthropogenic noise weakens territorial response to intruder’s songs.
Ecosphere 7, e01259 (2016).
51. Ward, S., Speakman, J. R. & Slater, P. J. B. The energy cost of song in the canary, Serinus canaria. Anim. Behav. 66, 893–902 (2003).
52. Nemeth, E. & Brumm, H. Birds and anthropogenic noise: are urban songs adaptive?. Am. Nat. 176, 465–475 (2010).
53. Oberweger, K. & Goller, F. The metabolic cost of birdsong production. J. Exp. Biol. 204, 3379–3388 (2001).
54. Ophir, A. G., Schrader, S. B. & Gilooly, J. F. Energetic cost of calling: general constraints and species-specific differences. J. Evol.
Biol. 23, 1564–1569 (2010).
55. Thomas, R. et al. The trade-off between singing and mass gain in a daytime-singing bird, the European robin. Behaviour 140,
387–404 (2003).
56. Sheikh, P. A. & Uhl, C. Airplane noise: A pervasive disturbance in Pennsylvania Parks, USA. J. Sound Vib. https: //doi.org/10.1016/j.
jsv.2003.09.014 (2004).
57. Burnham, K. P. & Anderson, D. R. Multimodel inference understanding AIC and BIC in model selection. Sociol. Methods Res. 33,
261–304 (2004).
58. Hurvich, C. M. & Tsai, C.-L. Regression and time series model selection in small samples. Biometrika 76, 297–307 (1989).
Acknowledgements
We would like to that the Cornell Lab of Ornithology for the Edward W. Rose Postdoctoral Fellowship to ASI
and undergraduate research funding to EDL, which made this work possible. We would also like to thank Jim
Lowe for monitoring and maintaining Swifts during the study period.
Author contributions
A.S.I. and H.K. conceived the ideas and designed the methodology, A.S.I. and E.D.L. collected the data, A.S.I.
analyzed the data and led the writing of the manuscript. All authors contributed critically to the drafts and gave
final approval for publication.
Competing interests
The authors declare no competing interests.
Additional information
Supplementary Information The online version contains supplementary material available at https://doi.
org/10.1038/s41598-020-80380-4.
Correspondence and requests for materials should be addressed to A.S.I.
Reprints and permissions information is available at www.nature.com/reprints.
Publisher’s note Springer Nature remains neutral with regard to jurisdictional claims in published maps and
institutional affiliations.
Open Access This article is licensed under a Creative Commons Attribution 4.0 International
License, which permits use, sharing, adaptation, distribution and reproduction in any medium or
format, as long as you give appropriate credit to the original author(s) and the source, provide a link to the
Creative Commons licence, and indicate if changes were made. The images or other third party material in this
article are included in the article’s Creative Commons licence, unless indicated otherwise in a credit line to the
material. If material is not included in the article’s Creative Commons licence and your intended use is not
permitted by statutory regulation or exceeds the permitted use, you will need to obtain permission directly from
the copyright holder. To view a copy of this licence, visit http://creativecommons.org/licenses/by/4.0/.
© The Author(s) 2021
Scientific Reports | (2021) 11:1197 | https://doi.org/10.1038/s41598-020-80380-4 10
Vol:.(1234567890)You can also read


