Social Media Image Analysis in the Immediate Aftermath of the 2020 Beirut Blast - Exploratory activity for enhancement of Copernicus Emergency ...
←
→
Page content transcription
If your browser does not render page correctly, please read the page content below
Social Media Image Analysis in the
Immediate Aftermath of the 2020 Beirut
Blast
  Exploratory activity for enhancement of Copernicus Emergency
  Management Services.

                                       Rufolo, Paola
                                       Muraro, Davide
                                       Lorini, Valerio

                                      2021

                                                                 EUR 30632 EN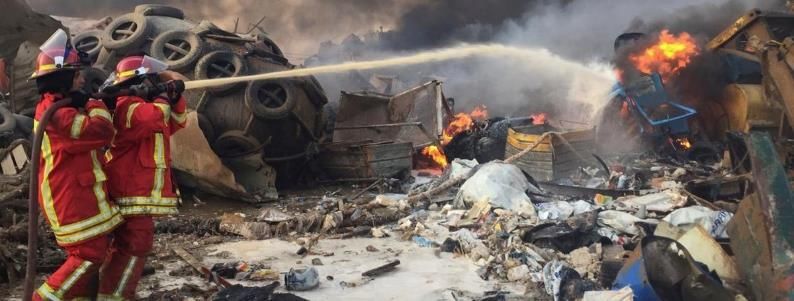
This publication is a Technical report by the Joint Research Centre (JRC), the European Commission’s science and knowledge service. It
aims to provide evidence-based scientific support to the European policymaking process. The scientific output expressed does not imply a
policy position of the European Commission. Neither the European Commission nor any person acting on behalf of the Commission is
responsible for the use that might be made of this publication. For information on the methodology and quality underlying the data used
in this publication for which the source is neither Eurostat nor other Commission services, users should contact the referenced source. The
designations employed and the presentation of material on the maps do not imply the expression of any opinion whatsoever on the part
of the European Union concerning the legal status of any country, territory, city or area or of its authorities, or concerning the delimitation
of its frontiers or boundaries.

Contact information
Name: Valerio Lorini
Address: Via E. Fermi 2749 – I - 21027 Ispra (VA) Italy Building 26B 01/146
Email: valerio.lorini@ec.europa.eu
Tel.: +39 033278-9192

EU Science Hub
https://ec.europa.eu/jrc

JRC124081

EUR 30632 EN

   PDF          ISBN 978-92-76-32151-4                ISSN 1831-9424             doi:10.2760/944555

Luxembourg: Publications Office of the European Union, 2021

© European Union, 2021

The reuse policy of the European Commission is implemented by the Commission Decision 2011/833/EU of 12 December 2011 on the
reuse of Commission documents (OJ L 330, 14.12.2011, p. 39). Except otherwise noted, the reuse of this document is authorised under
the Creative Commons Attribution 4.0 International (CC BY 4.0) licence (https://creativecommons.org/licenses/by/4.0/). This means that
reuse is allowed provided appropriate credit is given and any changes are indicated. For any use or reproduction of photos or other
material that is not owned by the EU, permission must be sought directly from the copyright holders.

All content © European Union, 2021,

How to cite this report: Rufolo, P., Muraro, D., Lorini, V., Social Media Image Analysis in the Immediate Aftermath of the 2020 Beirut Blast,
EUR 30632 EN, Publications Office of the European Union, Luxembourg, 2021, ISBN 978-92-76-32151-4, doi:10.2760/944555,.
JRC124081
Contents

1 Introduction..................................................................................................................................................................................................................................................... 5
2 Aim of the analysis ................................................................................................................................................................................................................................. 6
3 Data collection ............................................................................................................................................................................................................................................. 7
        3.1 Selection by location ................................................................................................................................................................................................................ 7
        3.2 Further selection and summary .................................................................................................................................................................................... 7
        3.3 Image flow and the importance of the first hours ..................................................................................................................................... 8
4 Preliminary data analysis.................................................................................................................................................................................................................. 9
        4.1 Manual assessment of data ............................................................................................................................................................................................. 9
        4.2 Visualisation of results .......................................................................................................................................................................................................10
5 Initial users’ feedback........................................................................................................................................................................................................................13
6 Image analysis .........................................................................................................................................................................................................................................14
        6.1 Duplicates detection ..............................................................................................................................................................................................................14
        6.2 Image classification ...............................................................................................................................................................................................................14
        6.3 Selection of relevant images ........................................................................................................................................................................................15
7 Outcome analysis and interpretation .................................................................................................................................................................................17
        7.1 Event confirmation..................................................................................................................................................................................................................17
        7.2 Impact assessment ................................................................................................................................................................................................................18
8 Conclusions and next steps ..........................................................................................................................................................................................................26
        8.1 Conclusions.....................................................................................................................................................................................................................................26
        8.2 Next Steps .......................................................................................................................................................................................................................................26
References .............................................................................................................................................................................................................................................................27
List of abbreviations and definitions ...........................................................................................................................................................................................28
List of figures .....................................................................................................................................................................................................................................................29
List of tables ........................................................................................................................................................................................................................................................30

                                                                                                                                     i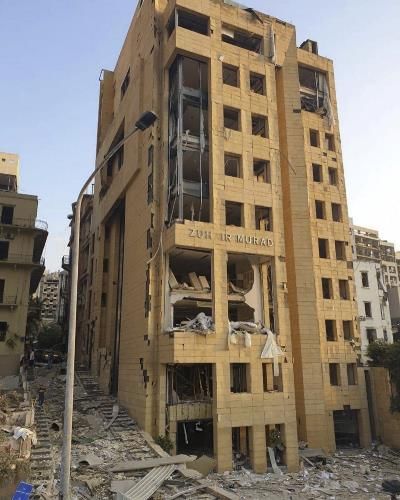
Foreword
     The continuous growing use of social media worldwide during disasters and emergencies,
     including developing countries, gives additional opportunities to decision making providing
     access to timely and relevant information.
     People post many informative as well as non-informative data and finding the informative
     contents that can help in decision making is a tedious and complex task. Emergency managers
     who were formerly used to one-directional dissemination of information to the citizens, are now
     exposed to vast amounts of data originating from the public which precedes formal
     communications and exposes emergency managers to a large volume of information.
     Therefore, it becomes essential to use specific instruments to filter the data that can enhance
     decision-making processes in a timeframe compatible with each emergency management
     phase and in particular during the response one.
     Recent advances in Natural Language Processing (NLP) and computer vision technologies
     provide an opportunity to improve situational awareness for management and response teams.
     For example, images have the potential to provide new insights contextualising the information
     stream while allowing crisis coordinators to react readily and appropriately in crisis situations.
     The analysis of disaster-related texts, images, and videos can help humanitarian response
     organizations to improve decision-making and in prioritizing their tasks.
     Images extracted from social media are particularly important in the immediate aftermath of an
     event such as an earthquake, when authoritative data and earth observation (EO) based
     products are not yet available. Ground truth information is crucial for a first assessment of the
     impact in terms of intensity and spatial distribution.

                                                 1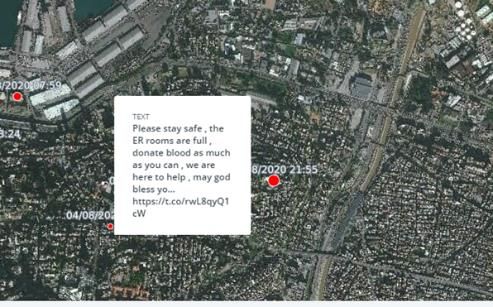
Acknowledgements
          This note is a joint work of the JRC.E1 unit, namely Copernicus Emergency Management
          Services (CEMS) Early Warning Services (EWS) and Validation Mapping teams, with support
          of Aldo Podavini member of Europe Media Monitor team (EMM) from JRC.I3 unit.
          Our acknowledgments go also to Marco Broglia, Peter Salamon, Jean-Francois Pekel and Alan
          Steel who reviewed the document and provided valuable comments.

Authors
          Paola Rufolo, Davide Muraro, Valerio Lorini.

                                                    2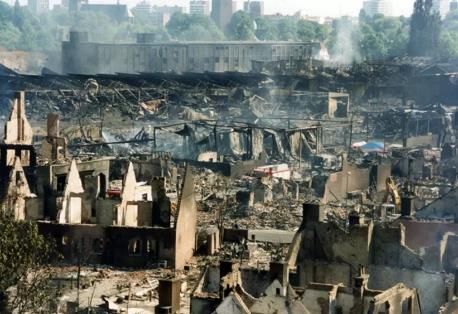
Disclaimer
This work fulfils all the law obligations according to the Twitter Terms of Service1
effective since June 18, 2020 and uses material extracted according to a fair-use2
given that:
Its purpose is scientific research
The nature of the work is factual
The purpose is non-commercial.
1
https://twitter.com/tos?lang=en last checked on 03/02/2021
2
https://help.twitter.com/en/rules-and-policies/fair-use-policy last checked on 03/02/2021
3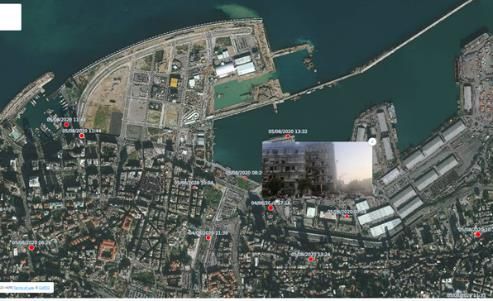
Executive Summary
     On the afternoon of August 4th 2020, two massive explosions devastated the port of Beirut and
     the surrounding area. DG ECHO immediately activated Copernicus Rapid and Risk & Recovery
     Mapping services, whose first product, based on Earth Observation (EO) data, was made
     available about 30h after the event.
     In order to fill in this gap, the CEMS Validation and Early Warning Services (EWS) teams
     (JRC.E1) started a test to understand how social media could be used to provide initial
     situational awareness to central and local emergency managers.
     A request was sent to the Europe Media Monitor team (EMM) team (JRC.I3) to collect the
     tweets posted during the 72h following the event and the outcome was analysed initially with a
     manual procedure to evaluate the validity of the approach before initiating the development to
     automate the required processing.
     The initial analysis consisted in selecting, across over 500k tweets containing the keywords
     “Beirut” “BeirutExplosions” “BeirutBlast” in 3 different languages and media content, which were
     geo-tagged with coordinates near the city of Beirut. This selection provided a manageable
     amount of data that we used for a preliminary study.
     The research was restricted to the first 24h, when, as also demonstrated by the processing
     done in this work, relevant content has a higher probability to be detected, and noise generated
     by indirect public in social media is lower.
     The following step consisted of processing the images contained in the tweets and classifying
     them as relevant to damage assessment, relevant to the event or not relevant. Those included
     in the first two classes where then displayed in an interactive map allowing the visualization of
     the positions from where the tweets were posted, the timestamps, the images and text of the
     post.
     This proof of concept for a potential enhancement of the Copernicus Emergency Services
     (CEMS), was shown to 28 practitioners who joined the workshop organized by JRC on
     December 1st 2020 “Social Media for Disaster Risk Management – Researcher meet
     Practitioners”. 79% said they would find such product useful in the initial phases of the crisis
     management, while the remaining 21% was unsure. This uncertainty was mainly due to
     concerns related to the reliability of social media.
     The outcome of this initial analysis shows that the potential of the social media in disaster
     management is significant. Images showing the impact of the event on assets and population
     are available from few seconds after the beginning of the crisis. Relevant information was
     concentrated in the initial phases with a peak between the 2nd and the 3rd hour, after which it
     starts decreasing. Contemporarily the probability of media content to belong to the category of
     “not relevant” escalates constantly, showing how the engagement of indirect public generates
     more and more noise reducing the confidence in the social media information.
     In conclusion this work proposes a framework to strengthen the use of social media for crisis
     management that could complement the current Copernicus Mapping service in the initial
     phases of the crisis. It introduces, as first development, an automatic system based on machine
     learning that, thanks to an automated image analysis, could improve the decision-making
     process in disaster monitoring, impact analysis and early-warning. Further developments aim
     at the automated detection of relevant media, their localization and classification providing an
     initial impact assessment starting from a few moments after the disaster. Its achievements may
     further help emergency managers to proactively implement specific actions enhancing their
     decision-making.
     While the methodologies presented can be applied to any social network, the experiment has
     been conducted using data extracted from Twitter platform because it offers the possibility to
     access freely the public stream of messages in real time and it is widely used worldwide.

                                                4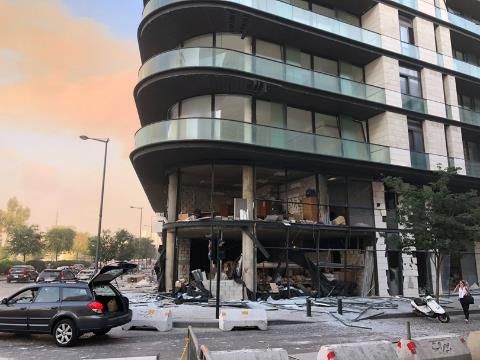
1       Introduction
            On August 4th 2020, at 18:08 local time (15:08 UTC), two explosions occurred at the port of the
            city of Beirut, the capital of Lebanon. The second explosion was extremely powerful and caused
            at least 207 deaths, 6,500 injuries, and US$15 billion in property damage, leaving an estimated
            300,000 people homeless3.
            DG ECHO activated CEMS with two requests: the Rapid Mapping EMSR4524 at 18:36 UTC and
            the Risk & Recovery EMSN0815 the following day at 19:30 UTC.
            The first product was released by Rapid Mapping service on August 5th at 21:09 UTC, and the
            first quality approved version6 was available on August 6th at 15:46, respectively 30 and 48
            hours after the main explosions.
            Following an initial feedback received from the CEMS Rapid Mapping Team, CEMS Mapping
            Validation team and CEMS EWS team jointly triggered a request to the EMM team to collect
            the tweets posted during the 72h following the event.
            Media contents have been extracted in order to study their potential usefulness in terms of
            situational awareness and support to first aid responders.
            This document shows the methodology and results of a data analysis performed on the media
            content available via Twitter during the first 24h after the event, starting from the collection of
            the raw data and moving through the different processing phases required to select informative
            and valuable content.
            The outcome of such analysis suggests that information extracted from social media can
            increase situational awareness for local and remote emergency managers supporting the
            operations of rescuers, especially before more comprehensive information is made available
            via Rapid and Risk & Recovery Mapping products.

3
    https://en.wikipedia.org/wiki/2020_Beirut_explosion last checked on 03/02/2021
4
    Explosion in Beirut, Lebanon
5
    Explosion in Beirut, Lebanon: detailed damage and impact assessment analyses
6
    https://emergency.copernicus.eu/mapping/ems-product-component/EMSR452_AOI01_GRA_PRODUCT_r1_RTP01/2

                                                             5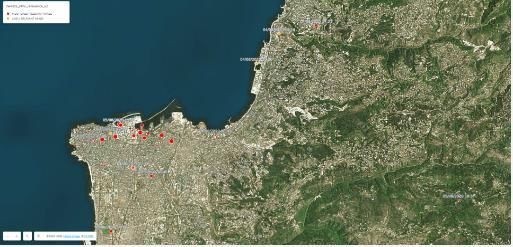
2 Aim of the analysis
The aim of this work is to:
Qualitatively understand the potential of social media data, in the context of emergency
management.
Assess the potential of an automated detection of relevant media, their localization and
classification which is currently under development within E1 activities framework.
Collect feedback from users about the usefulness of a product based on social media
content and what relevant information it should collect.
The diagram below shows the various steps included in the initial exploratory analysis and those
that will be developed in the upcoming months. The steps coloured in green are described in
this document. Those in yellow will be part of the future work.
Figure 1 Flowchart showing the steps of the work illustrated in the document
The steps included in the “Ongoing development” section are indicative and the order of blocks
might be different from the one represented.
6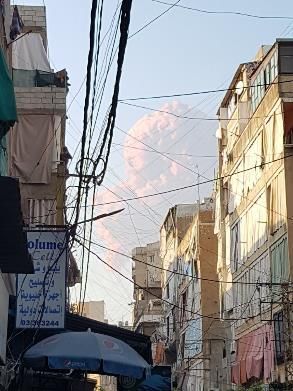
3 Data collection
Leveraging a contract that grants JRC access to Twitter PowerTrack API7, the EMM Team
collected posts from Twitter over a period of 72h after the event. The following paragraphs
describe the data selection process.
3.1 Selection by location
Two simultaneous approaches have been applied with the following queries.
Query 1 – Explicit location (user-defined)
The first query applied collected all tweets with media posted in the 72h after the event and
whose coordinates, assigned by user or inherited from the device location, fall into a given
bounding box (Lebanon National area).
Figure 2 Bounding box for Query 1
Query 2: Non-explicit location (inferred from text)
The second query used any of the following keywords:
EN: Beirut, Lebanon, Beirutexplosion/s, Beirutblast
FR: Beyrouth, Liban, Beyrouthexplosion / s, Beyrouthblast
AR: بيروت انفجار، بيروت بانج، لبنان، بيروت
Two filters selecting only tweets with media and excluding re-tweets were applied. This allowed
to reduce the outcome of the query from some millions of tweets to about 500k.
3.2 Further selection and summary
The tweets selected by the two queries have been furtherly classified according to their
timestamp.
Number of Tweets for Tweets First 24h
72h
Explicit location 4k 2.2k
(location coordinates 2184 tagged at national level
embedded in the (centroid of Lebanon or Beirut)
tweet's metadata)
69 tagged at urban level (facilities
or streets)
Not explicit location 500k 274k
(coordinates assigned
7
https://developer.twitter.com/en/docs/twitter-api/enterprise/powertrack-api/overview - last checked on last checked on
03/02/2021
7using mentions to
locations in the text)
Table 1 Tweets selection summary
The tweets with explicit location returned from the first query are 4k, less than 1% of the 500k
returned from the second query. This confirms a trend observed in recent years where users
prefer to deactivate the location service on their phone, thus not embedding geographical
information to the tweets preferring to mention a location in the text when needed.
3.3 Image flow and the importance of the first hours
Figure 3 shows how the number of images per hour, after duplicates removal, indicates that
the peak of images was disseminated in the first few hours after the event. Therefore, it can be
safely assumed that critical information can be extracted within the first 24h after the event,
when ground truth is of paramount importance because satellite products are normally not yet
available.
Figure 3 Hourly number of images after deduplication
For the remaining part of this report the term data refers to the data available within the first 24h
84 Preliminary data analysis
As seen in the previous chapter, the volume of data from social media is abundant.
Nevertheless, as the aim of the analysis performed was to assess the added value of such a
channel for crisis managers, the information needed to be further distilled for the sake of clarity.
Table 1 shows that the Query 2, looking for tweets with no explicit location, brings the most part
of information despite being the most challenging to process because of the undefined location.
It was decided to first perform a preliminary assessment of usefulness of data using the set of
natively geo-located tweets.
Tweets provided with explicit location have been further reduced as follows:
Duplicates were removed. Tweets linking to the same image url were excluded from the
dataset.
Tweets whose coordinates referred to a centroid too generic for mapping, such as generic
“Lebanon” or ‘Beirut’ terms, were excluded from the analysis.
4.1 Manual assessment of data
Images have been visually classified according to 3 different classes:
1) Relevant for damage assessment (High relevance)
2) Relevant to the event (Medium relevance)
3) Not relevant
✅✅ ✅✅
Image classified as relevant for damage Image classified as relevant for damage
assessment assessment
✅ ❌
Image classified as relevant to the event Image classified as not relevant
Figure 4 Example of images per class
952 of the 69 images geo located at sub-city level have been classified as relevant (high and
medium relevance). The outcomes of the manual assessment have been collected in an OGC
standard layer of points.
Each point represents an image whose location is defined in the tweet's metadata and the text
of the associated tweet.
The layer can be imported in any CEMS website or other GIS platform.
4.2 Visualisation of results
An online free service8 was selected to display the outcome layer as an interactive map.
Figure 5 General view of the filtered tweets
In the map shown in Figure 5, red dots represent most likely relevant images, providing details
about damages or rescuers active on the field, while the yellow ones represent images still
relevant to the event but not showing punctual information.
Each dot is placed according to the coordinates that were associated to the tweet by the user.
The bigger is the dot, the more re-tweets it received.
For each dot it is possible to display the image included in the post, see Figure 6.
8
www.carto.com
10Figure 6 Example of media relevant for damage assessment
Hovering over the dot enables the visualization of the text of the tweet, see Figure 7.
Figure 7 Example of text view
11Figure 8 Timestamps and distribution of tweets
More proposals about the visualization of results were suggested during the workshop
“Scientists meet practitioners” held on November 30th and December 1st. Details are discussed
in section 5 - Initial users’ feedback.
125 Initial users’ feedback
28 practitioners belonging to various organizations (civil protection, humanitarian ONG, local
administrations, volunteers in emergency situations) answered a survey during the “Social
Media for Disaster Risk Management – Researcher meet Practitioners” workshop held on
December 1st 2020, about applicability of social media in emergency management. It emerged
that an extensive usage is already done for different kind of events, from natural and man-made
disasters to conflicts.
In some cases, the information is already pre-processed, but in general a need for tools enabling
to reduce the noise and aggregate information is expressed. It is important to filter the sources,
extract useful information in an unbiased way to reduce the risk of inaccurate decisions taken
based on misleading and exaggerated information that could result in depleting resources and
affect the real people in need.
According to users’ opinion, Disaster Risk Management activities could be better supported by
social media information. It could be used beyond situational awareness, for detecting sub-
events within an emergency or monitoring how an emergency unfolds. Other employment could
be in performing damage assessment or in gathering feedback about measures and
recommendations.
According to practitioners, the most relevant information they would expect to be extracted from
social media is related to the location of the event, severity of the impact, affected population,
needs for search & rescue and, for humanitarian rights, information about any violence on
protesters. This feedback shows a good alignment between needs of users and potential of the
social media.
In order of preference, the three most useful formats suggested by the practitioners to visualise
the information after it is cleansed, are interactive maps, GIS compatible layers and interactive
viewers, followed by raw data (.csv, .json), tabular format and static maps/reports. Organization
by keywords, location, split in respective emergency support function categories or by
monitoring indicators would also be appreciated.
Crowdsourcing has also been highlighted as a useful tool to improve the timeliness and quality
of the information extracted. But its accuracy and reliability should be guaranteed, ensuring risk
of cognitive biases by crowdsourcing volunteers is avoided.
Taking into account the positive feedback from colleagues at JRC and practitioners, 79% of
which confirmed their interest in a product or service similar to the one described in section 4.2,
and after our preliminary analysis of a subset of images for which the location was given, it was
decided to process the remaining part of the images simulating real time data analysis for the
event.
136 Image analysis
It was evident that, due to the volume of tweets from both queries presented in section 3, an
automatic tool for distinguishing between relevant and irrelevant images was crucial. This
objective has been accomplished by training a Convolutional Neural Network (CNN) model for
disaster image classification9.
The first step was to build a dataset of disasters and emergencies images finely extracted and
labelled from multiple sources [1] [2]. The initial version was composed by relevant images from
various social media extracted by Google Images 10. ‘Earthquake’, ‘Flood’, ‘Storm’ and ‘Wildfire’
were the initial classes adopted. As expected, after a first check of sample images, it has been
noted that many images were similar. Thus, the need of a core component for removing exact
and near duplicate images arose.
6.1 Duplicates detection
Detecting exact and near duplicate images is a fundamental aspect during the training,
validation and testing of any classification model. The presence of duplicates in the dataset
used for training could favour a model biased toward features of the repeated images thus the
classifier won't be able to generalize when classifying new images. In other words, as expressed
in several papers [3][4], if an attribute usually co-appears with certain visual features, then the
CNN may learn to use the co-appearing features to represent this attribute. As a further
consideration, foreseeing a potential real time use of the suggested methodology, during each
event the model shall classify many images as fast as possible. One of the results of the de-
duplication is that roughly one third of images were exact or near-exact duplicates, so they were
removed before the classification phase and this operation drastically improved the
classification execution time.
Among the several techniques for identifying duplicate images [5], for this task a ‘percentual
hashing’ algorithm has been applied to identify the original image upon visible modifications,
such as colour and contrast changes, resizing, text insertion, etc.
6.2 Image classification
An image classifier based on a family of models called EfficientNets [6] has been trained to
recognize various classes of disasters (floods, wildfires, storms, earthquakes). The deep
learning tool is a novel architecture with the aim of better scaling CNNs, It has been used
because it is among the most efficient models requiring the least floating-point operations per
second (FLOPS) for image classification on reference dataset such as ImageNet.
The two steps process implemented transfer learning starting from a model pre-trained using
the Noisy Student Training [7] technique, which is a semi-supervised learning approach that
improves ImageNet top-5 accuracy11. The fine tuning consisted in integrating EfficientNet-B6
layers in the learning process, for 35 out of the total 582 layers. Data augmentation technique
which generates additional samples through image transformations of the circa five thousands
selected images, strictly acted as a regulator helping in reducing overfitting12. As a final result,
the achieved model accuracy is 96% (Figure 9) and its performance is illustrated in the
confusion matrix (Figure 10) where each row represents an actual class and each column
represents a predicted class.
9
A CNN is a class of deep neural networks most applied to analyse visual imagery because it makes the explicit
assumption that the inputs are images allowing to encode some of their properties into its architecture.
10
Google Images, https://images.google.com/
11
Top-5 accuracy means that any of the model 5 highest probability answers must match the expected answer.
Noisy Student Training improves it up to 98.7%.
12
Ying, X. An overview of Overfitting and its solutions. Journal of Physics: Conference Series. IOP Publishing,
2019, Vol.1168, p.022022.
14Figure 9 Model accuracy during the fine-tuning phase
Figure 10 Normalised confusion matrix after the fine-tuning phase
6.3 Selection of relevant images
Since the model was not trained for identifying directly images related to a blast, during the
analysis only images that had a good probability of belonging to an earthquake (> 50%) but with
a lower probability of being associated with other hazards (flood < 0.2%, wildfires < 0.3%, storm
< 0.5%) or none (< 0.2%) were considered relevant.
The images automatically annotated as relevant by our image classifier during the first 24h were
7940. These figures show how well social media information has potential for improving crisis
management, especially in the immediate aftermath of the event.
15Error! Reference source not found.shows the time series of the hourly aggregated images. The
first few hours after the event are the most critical for an analysis that could benefit crisis
managers since this is the period when the most images were posted.
Figure 11 Number of relevant images posted on Twitter aggregated by the hour
167 Outcome analysis and interpretation
Seen the timing of posts, the focus of the analysis has been put on two topics, namely the event
confirmation and the impact assessment. Both the topics are crucial for decision makers, but
the completeness of information and quantity needed could be different.
7.1 Event confirmation
Although the first image gathered from our collection was posted at 15:08:28 UTC, just few
seconds after the explosion, the first image considered relevant by our classifier thresholds has
been posted at 15:10:09 UTC, less than 2 minutes after the event.
Figure 12 Image posted on Twitter at 15:10:09 UTC
The first image extracted showing scene close to the blast was posted at 15:22:01, 14 minutes
after the explosion.
17Figure 13 Image posted on Twitter at 15:22:01 UTC
The two most retweeted images from the 1st hour are images about the plume from the fire
floating over the area of the event, confirming that in the immediate aftermath people were
posting about the occurrence of the event rather than picturing the impact.
Figure 14 Most retweeted relevant Images were posted less than 10 minutes after the event, sx 2020-08-04 15:14:45
UTC, dx at 2020-08-04 15:27:48 UTC
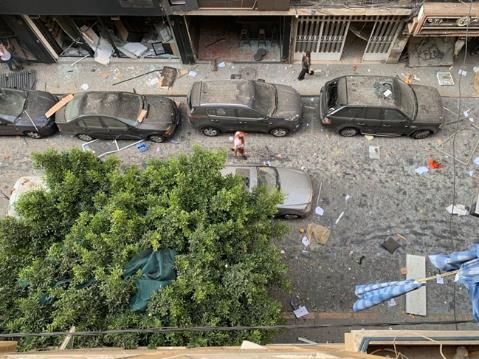
7.2 Impact assessment
While it is evident that the most retweeted images may be interpreted as a confirmation or a
notification of the event, the system could also identify some images more ‘descriptive’ of the
impact of the blast as shown in Figure 15.
1819
Figure 15 Image posted on Twitter - top) at 2020-08-04 15:43:40 - center) 2020-08-04 15:49:09 – bottom) 2020-08-
                                                   04 15:49:28

        In the 1st hour it was possible to identify also images from what can be considered the area of
        the disaster (Figure 16).

                                                      20
Figure 16 Image posted on Twitter at – top) 15:46:43 UTC and – b) 15:57:19 UTC
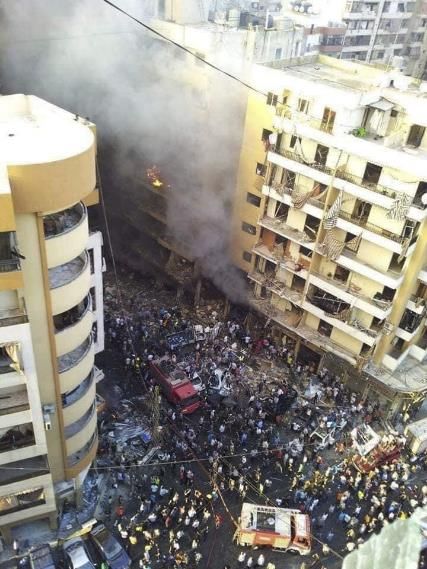
During the 3rd hour after the event, when the highest number of images have been circulated,
it was noticed that the most relevant images (according to filters described in section 6.3) were
detailing impacts on population and infrastructures as shown in Figure 17.
2122
Figure 17 Samples of images posted during the 3rd hour after the event – top) at 17:00 UTC – middle) at 17:28 and –
                                                 bottom) 17:31
       The images published after the first posts related to the occurrence of the event, carry the
       highest potential for impact assessment in terms of magnitude and location.
       In order to confirm what emerged from the visual inspection, a graph of the ‘effectiveness’
       potential of images over time, represented by the average probability of being classified as
       earthquake, is shown in Figure 18.

                                                       23
Figure 18 Distribution over time of average probability of belonging to earthquake for the images posted (higher
relevance)
The graph in Figure 19, showing the average probability of images of being classified as ‘none’
(noise) of the disasters for which the model has been trained, confirms the timeline of social
media activity when users during the first hours are mostly posting visual reports (witnesses)
and are later joined by messages of solidarity (thoughts and prayers).
Figure 19 Distribution over time of average noise of images posted
In Figure 20 the same data are reported together with the number of images collected and
filtered. The darkness of colour highlights how the number of relevant images, identified by the
higher probability of detecting an earthquake (Figure 20a) increases after the 3rd hour while
those not relevant, like thoughts and prayers, tend to increase over time (Figure 20b).
24(a) average effectiveness of images (b) average noise of images
filtered collected
Figure 20 Distribution over time of average effectiveness and noise of images posted
The figures confirm the hypothesis that in the very first minutes after the event the posts start
confirming the event (lower relevance) and after few hours the images describe damages to
infrastructures. At the same time, it is evident how the number of images not relevant to
damages increase over time, that is why the automated filter applied using the image classifier
is a core module for future deployment of the methodology proposed.
258 Conclusions and next steps
8.1 Conclusions
As soon as a disaster begins, immediate measures must be taken to mitigate the probability
and potential consequences of a disaster. Social media will play an increasingly important role
influencing disaster management, but at the same time the crowd-information exposes
emergency managers to a large volume of data. Therefore, it becomes essential to have
resilient instruments to filter the information and enforcing the decision-making process.
The current analysis shows that the collected media can provide in few minutes a good overview
of the impacted infrastructures and situational awareness. The first media posted after the event
have higher probability to be relevant to the detection of the event and to the damage
assessment process. This, according to practitioners, is helpful to crisis managers while waiting
for the first Copernicus Mapping products. Moreover, in the first hours after the event, the
information contains less noise, allowing to deliver a usable and valuable service in the early
phases of the crisis.
8.2 Next Steps
Future development of the current work would include:
Deploy a semi-operational system during a real event in order to test it as a potential
additional CEMS product.
Improve localization of tweets where location is not explicit by leveraging the text,
whether it mentions facilities, landmarks or information about the area.
Implement a viewer drawing on existing internal tools that will be populated in real time
once an alert is raised by CEMS or Rapid Mapping service is activated for certain events
(floods, storms, earthquakes, fires, explosions and in general other urban disasters).
Define a new EMS product/component enhancing the RM and RRM responses.
Other interesting fields of investigations could be:
Assessing if the collected media could be used as additional datasets for RM and RRM
service providers to carry out damage assessments.
Test the possibility to use the dataset as a tool to validate RM or RRM products.
26References
[1] Firoj Alam, Ferda Ofli, and Muhammad Imran, CrisisMMD: Multimodal Twitter Datasets from
Natural Disasters. In Proceedings of the 12th International AAAI Conference on Web and Social
Media (ICWSM), 2018, Stanford, California, USA.
[2] Björn Barz, Kai Schröter, Moritz Münch, Bin Yang, Andrea Unger, Doris Dransch, and
Joachim Denzler. "Enhancing Flood Impact Analysis using Interactive Image Retrieval of Social
Media Images." Archives of Data Science, Series A, 5.1, 2018.
[3] S. Zheng, Y. Song, T. Leung and I. Goodfellow, "Improving the Robustness of Deep Neural
Networks via Stability Training," 2016 IEEE Conference on Computer Vision and Pattern
Recognition (CVPR), Las Vegas, NV, 2016, pp. 4480-4488, doi: 10.1109/CVPR.2016.485.
[4] Q. Zhang, W. Wang, and S.-C. Zhu. Examining cnn repre-sentations with respect to dataset
bias.In AAAI, 2018.
[5] Thyagharajan, K.K., Kalaiarasi, G. A Review on Near-Duplicate Detection of Images using
Computer Vision Techniques. Arch Computat Methods Eng (2020).
https://doi.org/10.1007/s11831-020-09400-w
[6] Mingxing Tan and Quoc V. Le. EfficientNet: Rethinking Model Scaling for Convolutional
Neural Networks. ICML 2019.
[7] Self-Training With Noisy Student Improves ImageNet Classification. Qizhe Xie, Minh-Thang
Luong, Eduard Hovy, Quoc V. Le; Proceedings of the IEEE/CVF Conference on Computer
Vision and Pattern Recognition (CVPR), 2020, pp. 10687-106.
Twitter Data Dictionary (link)
27List of abbreviations and definitions
AI Artificial Intelligence
CEMS Copernicus Emergency Management Service
CNN Convolutional Neural Network
DG ECHO Directorate General for European Civil Protection and Humanitarian Aid Operations
EFAS European Flood Awareness Systems
EMM Europe Media Monitor
EO Earth Observation
ERCC Emergency Response Coordination Centre
EWS Early Warning Service
GDACS Global Disaster Alerting Coordination System
GIS Geographic Information System
JRC Joint Research Centre
ML Machine Learning
NLP Natural Language Processing
OGC Open Geospatial Consortium
RM Rapid Mapping
RRM Risk & Recovery Mapping
UTC Coordinated Universal Time
28List of figures
Figure 1 Flowchart showing the steps of the work illustrated in the document .................................. 6
Figure 2 Bounding box for Query 1 .................................................................................. 7
Figure 3 Hourly number of images after deduplication ............................................................ 8
Figure 4 Example of images per class ............................................................................... 9
Figure 5. General view of the filtered tweets ......................................................................10
Figure 6 Example of media relevant for damage assessment ....................................................11
Figure 7 Example of text view .......................................................................................11
Figure 8 Timestamps and distribution of tweets ...................................................................12
Figure 9 Model accuracy during the fine-tuning phase ...........................................................15
Figure 10 Normalised confusion matrix after the fine-tuning phase ............................................15
Figure 11 Number of relevant images posted on Twitter aggregated by the hour .............................16
Figure 12 Image posted on Twitter at 15:10:09 UTC ..............................................................17
Figure 13 Image posted on Twitter at 15:22:01 UTC ..............................................................18
Figure 14 Most retweeted relevant Images were posted less than 10 minutes after the event, sx 2020-08-04
15:14:45 UTC, dx at 2020-08-04 15:27:48 UTC ....................................................................18
Figure 15 Image posted on Twitter - top) at 2020-08-04 15:43:40 - center) 2020-08-04 15:49:09 – bottom)
2020-08-04 15:49:28 ................................................................................................20
Figure 16 Image posted on Twitter at – top) 15:46:43 UTC and – b) 15:57:19 UTC ............................21
Figure 17 Samples of images posted during the 3rd hour after the event – top) at 17:00 UTC – middle) at
17:28 and – bottom) 17:31 ...........................................................................................23
Figure 18 Distribution over time of average probability of belonging to earthquake for the images posted
(higher relevance) .....................................................................................................24
Figure 19 Distribution over time of average noise of images posted ............................................24
Figure 20 Distribution over time of average effectiveness and noise of images posted .......................25
29List of tables
Table 1 Tweets selection summary .................................................................................. 8
30GETTING IN TOUCH WITH THE EU In person All over the European Union there are hundreds of Europe Direct information centres. You can find the address of the centre nearest you at: https://europa.eu/european-union/contact_en On the phone or by email Europe Direct is a service that answers your questions about the European Union. You can contact this service: - by freephone: 00 800 6 7 8 9 10 11 (certain operators may charge for these calls), - at the following standard number: +32 22999696, or - by electronic mail via: https://europa.eu/european-union/contact_en FINDING INFORMATION ABOUT THE EU Online Information about the European Union in all the official languages of the EU is available on the Europa website at: https://europa.eu/european-union/index_en EU publications You can download or order free and priced EU publications from EU Bookshop at: https://publications.europa.eu/en/publications. Multiple copies of free publications may be obtained by contacting Europe Direct or your local information centre (see https://europa.eu/european-union/contact_en).
KJ-NA-30632-EN-N

    doi:10.2760/944555

ISBN 978-92-76-32151-4
You can also read


