2019 DISTRICT 2 HUNTING PROSPECTS Spokane, Lincoln, and Whitman counties - WDFW
←
→
Page content transcription
If your browser does not render page correctly, please read the page content below
2019
MICHAEL ATAMIAN, District Wildlife
Biologist
CARRIE LOWE, Assistant District Wildlife
Biologist

 DISTRICT 2 HUNTING
 PROSPECTS
 Spokane, Lincoln, and Whitman counties

1|P a g e
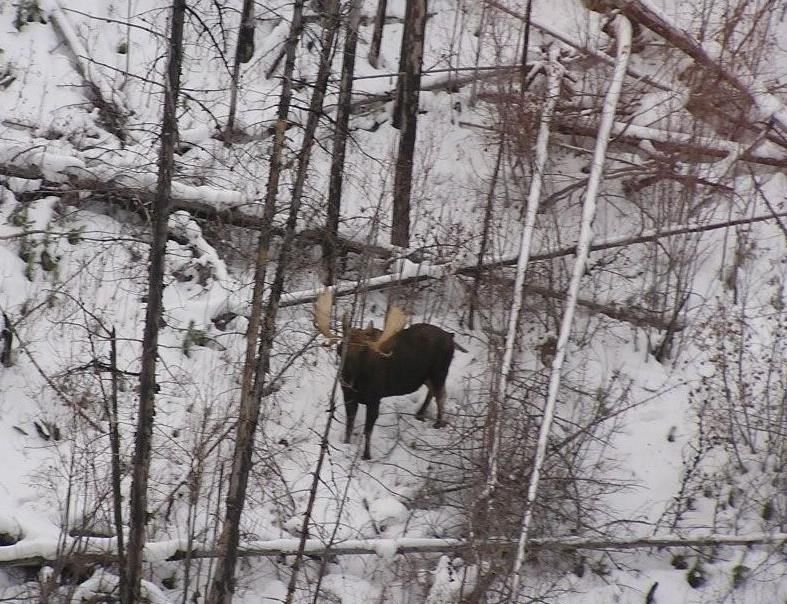
TABLE OF CONTENTS
DISTRICT 2 GENERAL OVERVIEW ........................................................................................................................4

ELK ...............................................................................................................................................................................6

        General Information, Management Goals, and Population Status ........................................................................6

        Which GMU Should Elk Hunters Hunt? ..............................................................................................................7

        Elk Areas ............................................................................................................................................................ 10

        What to Expect During the 2019 Season ............................................................................................................ 10

DEER........................................................................................................................................................................... 11

        General Information, Management Goals, and Population Status ...................................................................... 11

        What to Expect During the 2019 Season ............................................................................................................ 16

BIGHORN SHEEP ...................................................................................................................................................... 18

        General Information, Management Goals, and Population Status ...................................................................... 18

        What to Expect During the 2019 Season ............................................................................................................ 19

MOOSE ....................................................................................................................................................................... 20

        General Information, Management Goals, and Population Status ...................................................................... 20

        What to Expect During the 2019 Season ............................................................................................................ 21

COUGAR .................................................................................................................................................................... 24

        General Information, Management Goals, and Population Status ...................................................................... 24

        What to Expect During the 2019 Season ............................................................................................................ 24

BLACK BEAR ............................................................................................................................................................ 26

WATERFOWL ............................................................................................................................................................ 27

PHEASANT ................................................................................................................................................................ 29

CHUKAR AND GRAY PARTRIDGE ....................................................................................................................... 33

FOREST GROUSE ..................................................................................................................................................... 34

QUAIL......................................................................................................................................................................... 37

TURKEY ..................................................................................................................................................................... 39

DOVE .......................................................................................................................................................................... 41

2|P a g e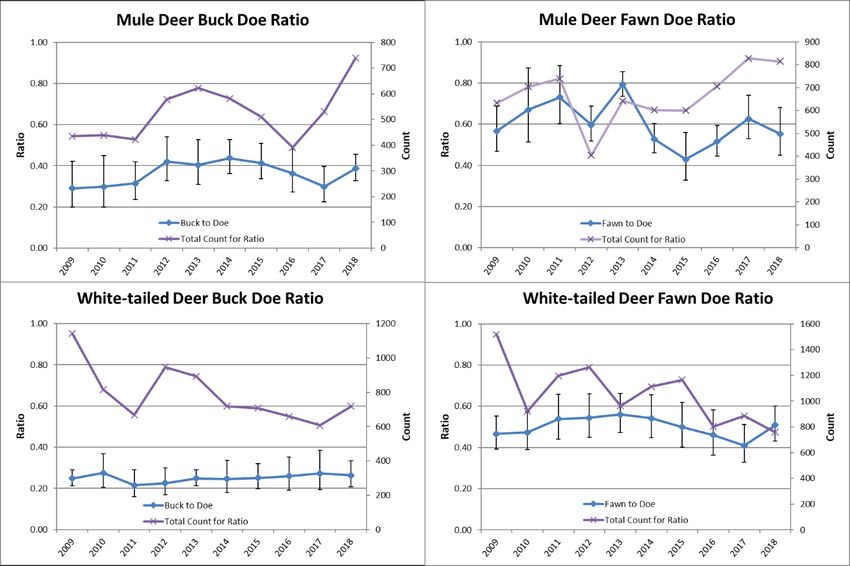
MAJOR PUBLIC LANDS .......................................................................................................................................... 43

PRIVATE LANDS ......................................................................................................................................................44

3|P a g e
DISTRICT 2 GENERAL OVERVIEW
The Washington Department of Fish and Wildlife (WDFW) District 2 is located in eastern
Washington, bordering Idaho, and covers Lincoln, Whitman, and Spokane counties. Game
management units (GMUs) in District 2 include 124 (Mount Spokane), 127 (Mica Peak), 130
(Cheney), 133 (Roosevelt), 136 (Harrington), 139 (Steptoe), and 142 (Almota) (Figure 1). The
majority of the district is in private ownership, so hunters are highly encouraged to secure access
prior to the hunting season or applying for special permits.

The geography of District 2 includes the edge of the Rocky Mountain Range in the east, the
Columbia Basin in the west, and the Channeled Scablands and Palouse in between. This diverse
geography supports a wide range of habitats that include mixed coniferous forests dominated by
Douglas fir, larch, Ponderosa pine, scattered aspen groves, scabland, sagebrush steppe,
grasslands, and extensive agricultural lands. Topography varies from ~500 feet above sea level
along the Snake River in the south to the 5883-foot Mount Spokane in the north. Dominant river
drainages include the Spokane, Palouse, Columbia, and Snake rivers.

District 2 is best known for its deer hunting opportunities, including white-tailed deer in the
Spokane and Palouse agricultural lands and mule deer in the Channeled Scablands and breaks of
the Snake River. Quality hunting opportunities also exist for other game species, including
pheasant and elk, if hunters have secured access to private lands. Moose and bighorn sheep
hunters can enjoy quality hunts if they are selected for special permit hunts and if they have
secured private land access prior to applying.

4|P a g e
Figure 1. General location and game management units (GMUs) for WDFW District 2.

5|P a g e
ELK

GENERAL INFORMATION, MANAGEMENT GOALS, AND POPULATION
STATUS
The elk population in District 2 is referred to as the Spokane sub-herd of the Selkirk herd. The
Selkirk herd of Rocky Mountain elk originated in Pend Oreille County and has expanded its
range over the last 40 years to this district. As elk habitat in District 2 continues to be lost to
agricultural conversion and urban sprawl, our goal is to maintain the population at its current
level (roughly 1000–1500 elk) to limit agricultural damage and conflict within urban areas.
Consequently, an “any elk” harvest is offered for the general season in all GMUs. The majority
of the land in the district is in private ownership, so managing this population requires landowner
tolerance and cooperation.

WDFW does not conduct formal population surveys to manage the elk in most of District 2.
Rather, harvest data (Figures 2-5), opportunistic surveys, sightings, and damage complaints are
used to indicate population trends. The exception is GMU 130 (Cheney), where the majority of
the district’s elk harvest (25-50 percent) typically occurs. The Cheney Unit includes Turnbull
National Wildlife Refuge, which has been regularly surveyed for herd size and composition for
the last 14 years. WDFW’s herd composition objective is to maintain a ratio of 15 to 35 bulls per
100 cows pre-hunt and/or 12 to 20 bulls per 100 cows post-hunt. The 2018 pre-hunt aerial survey
of Turnbull and surrounding area within GMU 130 found the bull to cow ratio to be above this
management objective. Based on the survey, 2018 calf production was above average, with a calf
to cow ratio of 73 calves per 100 cows. Combined data sources for the entirety of District 2 over
the last ten years indicate an overall stable population with some local populations declining and
others increasing. For more detail on the status of elk in Washington, see WDFW’s most recent
Game Status and Trend Report. Also available is a general how-to guide for elk hunting entitled
“The Basics of Elk Hunting in Washington.” You can find this document on the WDFW website
here.

6|P a g e
Figure 2. Elk general season total harvest in District 2 by GMU for all weapon types combined.

WHICH GMU SHOULD ELK HUNTERS HUNT?
For archery hunters, GMUs 124 and 127 provide the best terrain, whereas the terrain in GMUs
136–142 is better suited for muzzleloader and modern firearm. The highest proportion of the elk
harvest consistently occurs in GMUs 124, 127, and 130 (Figure 2). Hunters who gain access to
private lands in GMUs 127 and 130 have typically had the highest success, though success in
GMUs 136 & 139 has been higher the past couple of years (Figure 4). In GMU 130, hunters
likely benefit from animals moving on and off Turnbull National Wildlife Refuge during the
season. With one third of the elk hunters in District 2, GMU 124 (Mt Spokane) sustains the
greatest hunting pressure. As a result, overall hunter success is lower there, although the unit
periodically produces one of the higher harvests of mature bulls (6+ points; Figure 3). Private
timber companies, especially Inland Empire Paper (IEP), offer public access in this unit with a
paid permit. See Inland Empire Paper Company - Recreational Use for their rules and
regulations. Hunters should be aware that motorized access may be limited or closed completely
on IEP and other timber company lands due to road conditions, logging operations, or fire
danger. Hunters are advised to check closures and restrictions before setting out. Quality
Services, the property access manager for IEP, provides access updates online.

Elk in District 2 appear to be expanding into new areas, and harvest in GMUs 139 (Steptoe) and
142 (Almota) has increased over the last five years. Some of these elk appear to move back and

7|P a g e
forth between Idaho and Washington, so timing and access to private lands will be the key to
successful elk hunting in these GMUs. Complaints of agricultural damage have been on the rise,
especially in areas where crops have been recently converted to legumes. These scattered groups
of 20–100 elk have been reported causing damage in areas including Fairfield south to Tekoa in
GMU 127, the area from Dusty east to Palouse, south to Uniontown, and along the Snake River
breaks in GMUs 139 and 142, and from Tyler near the Lincoln/Spokane County border to
Sprague and north to Edwall in GMU 130. There has also been an increase in reported crop
damage by 60-80 elk along the river breaks in northern GMU 130 over the past 5 years.

For more detailed harvest information, see District 2 - 2018 Game Harvest Statistics Online:

Elk General Season Harvest

Elk Special Permits Harvest

Figure 3. Number of mature bulls (6+ points) harvested by GMU in District 2.

8|P a g e
Figure 4. Elk general season hunter success in District 2 by GMU for all weapon types combined.

Figure 5. Elk general season hunter effort (days/kill) in District 2 by GMU for all weapon types
combined.

9|P a g e
ELK AREAS
Elk Area 1015 is located within Turnbull National Wildlife Refuge. Turnbull special permit
hunts were created in 2010 to address damage to aspen stands and address complaints from
landowners in the area. These are walk-in only hunts, except for disabled hunt permit holders. In
past years, one bull permit (any weapon type) and 62 antlerless permits were offered. For the
2019 season this has been changed to 58, and includes 1 bull, 4 spike-only, and 53 antlerless
permits. Permits include each weapon type as well as hunts for youth, master hunters, and
hunters with disabilities. Turnbull hunters averaged 12 percent success for antlerless hunts in
2018, considerably below the previous 5-year average of 30 percent. The archery hunt has been
particularly challenging, with an average of 5 percent success rate, although archers harvested 4
animals in 2018, more than all other weapon types combined this year. The bull permittee has
been successful once in the past 5 years, but was successful each year for the first four years.
For more information about Turnbull National Wildlife Refuge, visit Turnbull - U.S. Fish and
Wildlife Service.

To address winter property damage in the area, there are also several late season raffle permits
and one WDFW special permit offered on Columbia Plateau Wildlife Management Association
(CPWMA) properties in areas around Turnbull National Wildlife Refuge. See the Private Lands
Program section for more information on acreage enrolled and the CPWMA website for details
on their hunt management.

WHAT TO EXPECT DURING THE 2019 SEASON
Across all GMUs, elk hunter success during the general season has averaged 12 percent over the
last 10 years, and hunter effort (days/kill) has averaged 41 days/kill. These numbers vary widely
by GMU (Figures 4–5), as hunter success depends heavily on the work the hunter is willing to
put in to obtain access to private property. There are well over 100 properties enrolled in
WDFW’s private land hunting access program in District 2. The majority of these are built
around upland game and deer hunting, however some support elk hunting as well, so
opportunities exist for elk hunters who do their research. For locations of these properties, visit
our new Hunt Regulations Webmap.

10 | P a g e
DEER

GENERAL INFORMATION, MANAGEMENT GOALS, AND POPULATION
STATUS
District 2 has both white-tailed deer (Odocoileus virginianus) and mule deer (Odocoileus
hemionus). White-tailed deer are found predominantly in the north and east portions of the
district, in the forest/agricultural interface and along riparian corridors. Mule deer are
predominantly found in the west and south of the district, in the shrubsteppe, scablands, and
farmlands.

Deer population levels are closely tied to droughts, severe winters, disease, and land use
practices. The primary management objective for white-tailed and mule deer in District 2 is to
keep the herds stable to slightly increasing and within landowner tolerance. Given that the
majority of the land in the district is in private ownership, managing this population without
landowner cooperation is impossible. Additional management objectives include maintaining
herds at 15–19 bucks per 100 does in the post-hunting season population.

Currently, WDFW does not use formal estimates or indices of population size to manage white-
tailed deer populations in District 2. Instead, trends in harvest (Figures 6 and 7), hunter success
(Figure 8), days per kill (Figure 9), and pre-hunting season sex and age ratios (Figure 10), are
used to monitor populations. WDFW recognizes the limitations of using this data to monitor
trends in population size and we are currently evaluating new approaches to monitoring white-
tailed deer populations. The harvest statistics above are also used for managing mule deer, but
congregations of mule deer on wintering grounds allows for viable postseason aerial surveys to
estimate populations periodically. Flights are conducted every three to five years in conjunction
with Districts 4 and 5. Recent flights estimate the mule deer herds in the Washtucna and Odessa
areas to be around 13,000 and 11,000 respectively. For more details on the results of these
flights, please see the Columbia Basin Mule Deer Management Zone section of the 2018 Game
Status and Trend Report.

11 | P a g e
Figure 6. Mule deer general season buck harvest in District 2 by GMU for all weapon types combined.

12 | P a g e
.
Figure 7. White-tailed deer general season buck harvest in District 2 by GMU for all weapon types
combined.

Mule deer general season buck harvest (1189 bucks total) increased in all GMUs in 2018 relative
to the previous year (Figure 6),but is still down 15 percent relative to the previous 10-year
average. The trend in white-tailed deer general season buck harvest (2103 bucks total) was
mixed in 2018, with GMUs 124 and 130 continuing to show a decline, while the other five
GMUs show an increase in harvest relative to last year (Figure 7). White-tailed buck harvest is
still down 32 percent overall relative to the previous 10-year average.

13 | P a g e
Figure 8. Deer general season hunter success in District 2 by GMU for all weapon types combined.

Similar to white-tailed deer harvest, hunter success varied in 2018, with GMUs 124 and 130
showing a decline in success and the other five GMUs showing an increase. Overall hunter
success averaged 29 percent in 2018, a decline of 13 percent from the previous 10-year average
(Figure 8). Hunter effort (days/kill) followed a similar pattern, with effort decreasing in all
GMUs except 124 and 130 which saw increases. Overall hunters averaged 15 days/kill in 2018
compared to 13 days/kill for the previous 10-year average (Figure 9).

14 | P a g e
Figure 9. Deer general season days/kill in District 2 by GMU for all weapon types combined.

Preseason fawn to doe ratios for white-tailed deer rebounded in 2018 from the previous four-year
decline, bringing it back in line with the previous 10 year average of 0.51 (Figure 10). Mule deer
fawn to doe ratio was 0.55 in 2018, lower than the previous 10 year average of 0.62, but in line
with more recent estimates (Figure 10). The lower fawn to doe ratios are associated with drought
in 2014 and 2015, the overall hotter and drier conditions in the basin resulting in reduction in
available forage in the late summer, and disease outbreaks for white-tailed deer specifically. Pre-
season buck to doe ratios for mule and white-tailed deer have been relatively stable over the past
10 years, averaging 37 mule and 25 white-tailed bucks per 100 does (Figure 10).

15 | P a g e
Figure 10. District 2 pre-season buck to doe (August) and fawn to doe (September) ratios (blue lines
with 90 percent CI) and total count (purple lines) by species.

The decline in harvest of both species is likely due to a series of events stemming from the 2014
and 2015 droughts and the hard winter of 2016/17. The droughts reduced fawn survival,
especially in the mule deer populations in 2015 (Figure 10), while the winter of 2016–2017
reduced overwinter survival of all deer. The 2015 drought was also a significant factor in the
blue tongue outbreak that year, which caused high mortality in white-tailed deer. Mule deer are
rarely affected by blue tongue, and the 2015 aerial flight in the Benge area estimated the mule
deer subpopulation at 12,919, in line with results from previous flights in 2009 and 2011.
Additionally, fewer hunters hunted in the district (14 percent decline relative to the 10-year
average) and landowners restricted access due to the bluetongue outbreak.

For more information related to the status of deer in Washington, hunters should read through the
most recent version of the Game Status and Trend Report, which is available for download on
the WDFW website.

WHAT TO EXPECT DURING THE 2019 SEASON
Overall, the white-tailed deer population is down in District 2 due to the blue tongue outbreak of
2015 and the harsh winter of 2016. The population is starting to recover, however the winter of
2018 was another difficult winter (though not as bad as 2016) and there was a small outbreak of
Epizootic Hemorrhagic Disease in northwest Spokane County. Overall the mule deer population,
while having lower than average fawn recruitment, is relatively stable. Though populations of

16 | P a g e
both species are starting to recover from the drought and disease outbreak of 2015, hunters
should still expect to have to put in more time to be successful (Figure 9).

White-tailed and mule deer hunting opportunities in District 2 vary from marginal to excellent,
depending on the GMU and if private land access has been secured. The best opportunities to
harvest a white-tailed deer in District 2 occur in GMUs 124 and 127. The best opportunities to
harvest a mule deer in District 2 occur in GMUs 136, 139, and 142. For archery hunters, GMUs
124 and 127 provide the best terrain, whereas the terrain in GMUs 136–142 is better suited for
muzzleloader and modern firearm.

There is a 3-point minimum regulation in GMUs 127–142 for white-tailed deer, and the late
white-tailed deer season in GMUs 127–142 is by permit only (the Palouse Special Permit Hunt)
as of 2006. Hunter success over the past 10 years is, on average, higher for the Palouse hunt (46
percent versus 33 percent in the general season), with 5+ point bucks making up, on average, a
greater percentage of the kill (38 percent versus 27 percent in the general season). There are
currently 750 permits offered for the Palouse hunt.

Mule and white-tailed deer populations overlap in District 2, so make sure to identify the species
before harvesting an animal, as regulations can differ between species within a GMU. The bulk
of District 2 is private land, and buck hunters will have to put in the time to get access. Doe
hunters should have an easier time given the agricultural nature of this district. We have enrolled
many cooperators in our hunter access programs in southeastern Washington. See the Private
Lands Program section below and note that the locations are mapped on the Hunt Regulations
Webmap.

For more 2018 harvest information from District 2, see:
      - Deer General Harvest District 2
      - Deer Special Permits Harvest District 2

17 | P a g e
BIGHORN SHEEP GENERAL INFORMATION, MANAGEMENT GOALS, AND POPULATION STATUS District 2 is home to one herd of California bighorn sheep, found in GMU 133 north of Highway 2 in Lincoln County (visit the Hunt Regulations Webmap for a map). These sheep can most often be seen throughout the residential community of Lincoln and the cliffs above it, and in the cliffs around Whitestone Rock approximately seven miles downriver from Lincoln on Lake Roosevelt. Sheep are also observed frequently in the cliffs and canyons above Sterling Valley (the area between Lincoln and Whitestone) and in surrounding agricultural fields, where they are sometimes reported causing crop damage. WDFW has conducted regular aerial surveys to assess the status of the Lincoln Cliffs herd since 2002. Minimum population size is estimated by the count of rams and ewes observed during these flights (Figure 10). After several years of increase, the population is showing signs of leveling off, and has likely reached the largest feasible herd size here due to human tolerance and available habitat quantity and quality. For more details on the history of the Lincoln Cliffs herd and the status of bighorn sheep in Washington, see WDFW’s 2018 Game Status and Trend Report here. Figure 10. Lincoln Cliffs minimum population estimate by sex for 2009–2018. Estimated as the maximum adult count from helicopter surveys conducted each year. 18 | P a g e
WHAT TO EXPECT DURING THE 2019 SEASON
Bighorn sheep hunting in Washington requires a special permit. One ram permit for this herd
was offered each year from 1997–2013 and in 2017. Based on ram numbers and population size,
this was increased to two permits in 2014–16 and again in 2018. The average number of
applicants for this ram hunt over the last five years is 2,188, and harvest success has remained at
100 percent. In 2018 two ewe permits were added– one in the Whitestone Unit and one in the
Lincoln Cliffs Unit. Both hunters were successful and the ewe hunts will continue for the 2019
season. The area is almost entirely private property and permittees will need to obtain permission
to access these properties for their hunt.

19 | P a g e
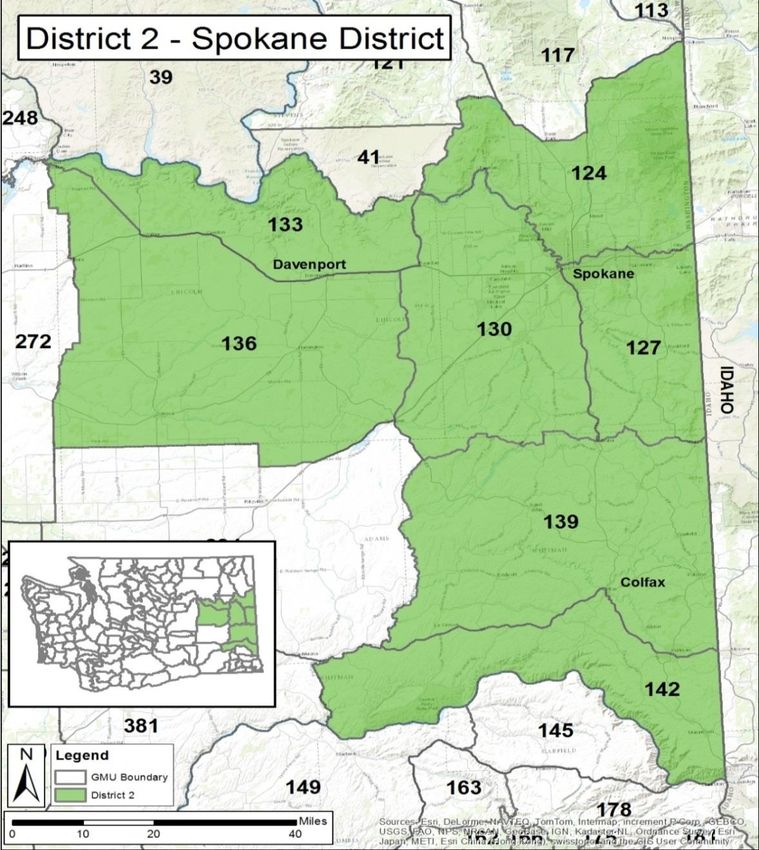
MOOSE

GENERAL INFORMATION, MANAGEMENT GOALS, AND POPULATION
STATUS
Moose in northeast Washington are Shiras moose (Alces alces shirasi), the smallest of the four
subspecies of moose in North America. Moose were not believed to be common or widely
distributed in the Rocky Mountain states in the 1800s, and it was not until 1908, when explorer
George Shiras III found a fairly large population in Yellowstone National Park, that this
mountain race was described. Shiras moose were only rarely noted in Washington until the late
1950s when distribution began to expand into eastern Pend Oreille County. Moose dramatically
increased in number and distribution in the decades that followed and are now relatively
common throughout northeast Washington.

Statewide moose management goals are to: 1) Preserve, protect, perpetuate, and manage moose
and their habitats to ensure healthy productive populations; 2) Manage for a variety of
recreational, educational, and aesthetic purposes; and 3) Manage statewide moose populations
for a sustained yield. The proximity of a moose population near the Spokane metropolitan area
adds the challenge of balancing population objectives with human safety and the community’s
tolerance of moose.

Currently, WDFW uses harvest metrics to monitor and manage moose populations in District 2.
From 2002 to 2012, annual winter aerial surveys were flown by district biologists covering a
sub-sample of each hunt unit in District 2. General trends in observed moose during aerial survey
flights indicated a stable to growing population in each area. However, there was large variability
in the observed count between years and the methodology was not successful in producing
reliable population estimates. From 2013-16, WDFW worked on developing a new survey
methodology that would produce reliable population estimates over the entire northeast (GMUs
101–130). Though the estimates produced by the new method were less variable, the larger area
of coverage made it impractical to apply the results to individual units. A brief flight was
conducted this winter, the purpose of which was to get a rough estimate of composition (e.g., sex
and age ratios), not a population estimate. A total of 101 moose were observed: 45 cows, 17
calves, and 39 bulls. Observations were not uniformly distributed; 49 moose were observed in
the Spokane West Moose Area, 26 in the Mt Spokane North Area, 8 in the Mt Spokane South
Area, and 18 in the Mica Peak Area.

Harvest management emphasizes quality hunting opportunities through limited special permits
drawn by lottery each year. A total of 39 permits are offered in District 2 in a variety of
categories (Table 1). Prior to 2012, District 2 had two moose hunt units (MHU), Mount Spokane
(GMU 124 east of Highway 395) and Hangman (GMUs 127 and 130). In 2012, the Mount
Spokane MHU was split into Mount Spokane North and Mount Spokane South Moose Areas
(maps found here) to help distribute hunters more evenly across the area and increase hunter

20 | P a g e
opportunity. In 2015, the Hangman MHU was split into the Mica Peak (GMU 127) and Cheney
(GMU 130) MHUs for the antlerless hunts to better distribute hunters and address increasing
moose conflict in Cheney. Additionally, in 2015, the Spokane West MHU was split off from the
Huckleberry MHU to distribute hunters and increase opportunity.

Table 1. Permits offered in District 2 by moose hunt unit for 2019.

                        Antlered
                                           Antlerless Only
                         Bull
  Moose Unit            General    General     Disabled      Youth
  Mount Spokane
                            8          4           1           0
  North
  Mount Spokane
                            8          4           0           1
  South
  Spokane West              1          2           0           0
  Hangman                   4          0           0           0
  Mica Peak                 0          4           0           0
  Cheney                    0          2           0           0

WHAT TO EXPECT DURING THE 2019 SEASON
Hunters should take note that moose are by nature a solitary animal and are scattered over very
wide areas as individuals or in small groups. While they can be found at any elevation, they are
most likely found between 3,000 and 5,000 feet. In the fall they are looking for deciduous
browse, primarily willow brush, alder, serviceberry, ceanothus, and other shrubs in clear-cuts or
burns 10–20 years old. Moose seek out cool, moist drainage basins and slopes, and generally
prefer north slopes or east flowing drainages. Moose are still in the rut in early October and some
hunters have been effective with calls. By November, snow is common and locating moose
tracks and seeing these dark animals with a snow background is much easier. However, by mid
to late November, there is usually enough snow that motor vehicle access can be limited.

Moose seek out snow rather than avoid it in late fall and early winter, because they are in their
winter coats and start to experience thermal stress at temperatures exceeding 23⁰F. In years
without much snow, they are typically found at higher elevation and on north slopes with tree
cover. In years with a lot of snow, they move down to the foothills of the mountains. Moose
habitat in District 2 is largely located on private timber company lands, but smaller private
ownerships can also harbor good moose concentrations. Permit holders should exercise caution
and know where they and the targeted moose are at all times given the percentage of private land
ownership, proximity to Idaho, and non-hunting lands (State and County parks, National
Wildlife Refuge) within the moose hunting units. WDFW requires all successful moose hunters
to submit tooth samples in the envelopes provided with their informational packet. Tooth
samples allow us to get an overview of the age structure of the moose population, which will
help inform future management decisions.

21 | P a g e
See below for specific harvest metrics for each MHU: Mount Spokane North Moose Area Success rate for the eight Bull Moose permits in this unit was 86 percent in 2018 and has averaged 92 percent since its creation in 2012. Hunters have spent seven days per kill on average but spent 12 days per kill in 2018 and 11 days in 2017. The average spread of bulls harvested is 36 inches, with the largest bull harvested measuring 49 inches. Success rates for all Antlerless Only hunts combined in this unit was 88 percent in 2018 and has averaged 87 percent since its creation in 2012. Hunters have spent seven days per kill on average, though it reached as high as 12 days per kill in 2016. Decreasing hunter success rates and increasing hunter effort combined with low pregnancy rates and low calf survival in a local study have led the department to reduce antlerless opportunity in this area from 16 permits offered previously to 5 starting in 2018. Additional reductions may occur due to loss of private timber land access. Mount Spokane South Moose Area Success rate for the eight Bull Moose permits in this unit was 100 percent in 2018 and has averaged 96 percent since its creation in 2012. Hunters spent 12 days per kill on average in 2018, which is two times the average for this hunt since its creation. The average spread of bulls harvested is 34 inches, with the largest bull harvested measuring 46 inches. Success rates for all Antlerless Only hunts combined in this unit was 100 percent in 2018 and have averaged 87 percent since creation in 2012. Hunters spent an average of two days per kill in 2018, compared to an average of five days per kill for this hunt since its creation. Similar to the North Unit, decreasing hunter success rates and increasing hunter effort combined with low pregnancy rates and low calf survival in a local study have led the department to reduce antlerless opportunity in this area from 16 permits offered previously to 5 starting in 2018. Spokane West Moose Hunt Area This Hunt Area was split off from the Huckleberry GMU 121 in 2015, so there is little historic data for comparison. The 2015 Any Moose permittee successfully harvested a 32-inch bull in one day of hunting. The 2016 Any Moose permittee successfully harvested a 44-inch bull in five days. The 2017 Any Moose permittee did not report their hunt. The 2018 Bull Moose permittee successfully harvested a 43-inch bull in one day. The two Antlerless permittees in 2015 were both successful, spending an average of two days hunting. The two Antlerless permittees in 2016 were also both successful. One hunter hunted only one day while the other hunter spent 18 days hunting. The two Antlerless permittees in 2017 were both successful, spending an average of two days hunting. Only one Antlerless permittee hunted in 2018 and was successful. Hangman Moose Hunt GMUs 127 and 130 The number of Bull Moose permits offered for this hunt was reduced from seven to four in 2017, due to reduced success, ≤86 percent, observed the previous four years. Hunters spent seven days 22 | P a g e
per kill on average in 2017, more in line with the average seen the first 10 years of this hunt and
all four were successful. In 2018, 75 percent of the Bull Moose permittees were successful,
spending on average 8 days per kill. The average spread of bulls harvested in the last 10 years is
38 inches, with the largest bull ever harvested measuring 52 inches. Average spread of the bulls
harvested in 2018 was 32 inches and ranged from 24–38 inches. Overall, the moose population
in this unit appears to be declining in areas open to general hunting access (e.g., DNR and Inland
Empire Paper Company), but increasing in areas closed to hunting or where access is limited
(Conservation Areas and suburban Spokane). Hunters are strongly encouraged to secure private
land access for this hunt prior to applying.

Mica Peak Moose Hunt GMU 127
There are no Any Moose permits specific to just this unit (Hangman MHU incorporates both
Mica Peak and Cheney MHUs). The following Antlerless harvest statistics include the Hangman
Unit data because the vast majority of permittees prior to 2015 harvested their animals in Mica
Peak. Due to declining hunter success, Antlerless Only permits were reduced from seven to four
in 2017. The success rate for this hunt increased to 100 percent in 2017, up significantly from the
previous five year average of 69 percent, and remained at 100 percent in 2018. Hunters spent on
average three days per kill in 2018, slightly less than the previous 10-year average of five days.
Overall, the moose population in this unit appears to be declining in areas open to general
hunting access (e.g., DNR and Inland Empire Paper Company), but increasing in areas closed to
hunting or where access is limited. Hunters are encouraged to secure private land access for this
hunt if they want to increase their odds of success.

Cheney Moose Hunt GMU 130
There are no Any Moose permits specific to just this unit (Hangman MHU incorporates both
Mica Peak and Cheney MHUs). This MHU was split off from the Hangman MHU in 2015 for
Antlerless only hunts because very few permittees hunted it while the number of complaints
regarding moose in the unit’s suburban/rural areas increased. This unit is almost entirely private
land. The larger blocks of public land are NOT open to hunting, and the moose are dispersed and
highly mobile. Only one of the two Antlerless Only permittees reported for this hunt in 2015.
The permittee was successful after 15 days of hunting. In 2016, neither permittee was successful
after spending a combined 20 days hunting. In 2017, one permittee did not hunt, while the other
was successful after nine days of hunting. In 2018, both hunters were successful after spending a
combined 36 days hunting. Hunters are STRONGLY encouraged to secure private land access
for this hunt prior to applying for the permit.

23 | P a g e
COUGAR
GENERAL INFORMATION, MANAGEMENT GOALS, AND POPULATION
STATUS

Cougars may be found in varying densities throughout District 2, depending on habitat
availability. Cougars are managed to provide maximum harvest opportunity, while promoting
population stability and social structure, and minimizing human-cougar conflict.

Beginning with the 2012 season, WDFW shifted away from using season length or permits to
manage cougar harvest, instead implementing a standard, liberal season along with harvest
guidelines. Hunt areas were created across the state, each one offering an opportunity to harvest
12–16 percent of its estimated cougar population from Sept. 1 until April 30. Starting Jan. 1,
harvest numbers and composition of the harvest in each hunt area are evaluated, and hunt areas
may be closed for meeting or exceeding the guideline with relatively short notice. Hunters that
plan on hunting cougar after Jan. 1 are responsible for knowing if their hunt area is open or
closed. To confirm, hunters must call the cougar hotline (1-866-364-4868) or check online at
https://wdfw.wa.gov/hunting/regulations/big-game/cougar..

GMUs 124, 127, and 130 comprise a single hunt area with a harvest guideline of 7–9. Therefore,
if you would like to hunt cougar in GMUs 124–130 after Jan. 1, you will have to verify the unit
is still open. Harvest in this unit has met or exceeded the guideline for the past 3 seasons and has
been closed. GMUs 133–142 are part of the Columbia Basin Hunt Area that has no harvest
guideline due to limited habitat and corresponding lower cougar population.

WHAT TO EXPECT DURING THE 2019 SEASON

General season cougar harvest has been increasing in District 2 over the last six years, with the
highest reported harvest of 20 cougars during the 2016 license year (Figure 11). Average harvest
across the district over the last 10 years is 13. Harvest is consistently the highest in GMUs 124
and 133, and sightings in these units are also common. Cougar harvest in GMUs 136–142 is
typically very low (Figure 11). Most of the general season cougar harvest in the district is
opportunistic, occurring most often while hunters are seeking deer or elk. The proportion of
males and females in the harvest varies each year, but the average age at harvest is typically three
years or younger. For harvest details by GMU, see the Game Harvest Reports. For information
on reporting and pelt-sealing requirements, see https://wdfw.wa.gov/hunting/regulations/big-
game/cougar.

Starting in 2017, cougar season was extended until April 30. If you hunt in a unit that has not
been closed to harvest, you will have to purchase a 2020 hunting license and cougar tag after
March 31.

24 | P a g e
Figure 11. General season cougar harvest by GMU for license years, 2009–2018.

25 | P a g e
BLACK BEAR

Black bears in Washington are managed with a goal of ensuring healthy and productive
populations while minimizing conflict with people. The state is divided into nine Black Bear
Management Units (BBMUs); District 2 is part of the Northeastern BBMU (GMUs 124─130)
and the Columbia Basin BBMU (GMUs 133─142). Harvest levels vary within and between
BBMUs depending on local habitat conditions and corresponding bear densities as well as hunter
effort and access limitations. We do not currently conduct annual surveys or have formal
population estimates but rely on harvest statistics to infer population trends and evaluate
management decisions.

Bear harvest in District 2 is substantially lower than in the rest of the Northeastern BBMU, likely
due to habitat and hunter access limitations. The majority of harvest consistently occurs in
GMUs 124 and 127. Although the Columbia Basin BBMU is not thought to support resident
black bear populations due to lack of habitat, GMU 133 has averaged 6 bears per year over the
past 10 years. Harvest in the other GMUs in the Basin is very low or nonexistent.

Bear harvest in District 2 also varies widely year by year, as bears are most often harvested
opportunistically by deer and elk hunters during their general seasons (Figure 12, top). Hunter
success (harvest per hunter) has steadily increased in recent years (Figure 12, bottom), while
effort has stayed about the same, at an average of 5.6 days per hunter.

26 | P a g e
Figure 12. Top graph: Black bear total harvest in District 2, 2009─2018.
Bottom graph: Average success (harvest per hunter) for black bear in District 2, 2009─2018.

WHAT TO EXPECT DURING THE 2019 SEASON

The fall general season dates have been standardized statewide beginning in 2019, allowing
eastside hunters to start hunting August 1 in all GMUs. Additionally, the bag limit has increased
to two bears, regardless of location. Hunters must purchase a second bear tag to harvest a second
bear. There are no spring permits for bear in District 2.

Bear hunters are urged not to shoot females with cubs. In the fall, cubs are 30 to50 pounds and
tend to lag behind when traveling. Please be patient and spend time watching for cubs before
shooting a bear. In addition, remember that it is mandatory to submit a premolar tooth from all
harvested bears. Tooth envelopes are available at WDFW offices, and hunters are welcome to
make an appointment for help with pulling the tooth if needed. Hunters that submitted a tooth
can look up the age of their harvest several months after the close of the season on our website
here.

27 | P a g e
WATERFOWL
At the statewide level, District 2 is not known for its duck hunting and is not a large duck
production area due to the ephemeral nature of the water bodies in the Channeled Scablands.
Local surveys indicate brood production was up overall in 2018 (Figure 13). However, this is
driven by coot broods, while duck brood numbers have fallen the past two years, back in line
with the numbers seen prior to the wet spring of 2016.The most common breeding duck species
in the area are mallard, gadwall, green-winged teal, and redhead. Other common waterfowl
species in District 2 include coot, ruddy duck, and northern pintail and American wigeon during
migration. Based on breeding population surveys (BPOP), duck numbers appear to be increasing
overall in the Potholes region of eastern Washington, while coot and Canada goose numbers
remain relatively stable (Figure 14). Given the limited number of local nesting ducks, the
waterfowl hunting opportunity in this district is dependent upon the number of migrants coming
from Canada and Alaska, the amount of summer and fall precipitation, and how long
waterbodies remain ice-free. Hunters should focus their efforts on larger perennial waterbodies
unless fall rains are significant when shallow, flooded agricultural fields become duck and goose
hot spots. For more information on waterfowl hunting techniques and waterfowl hunting areas in
Region 1, see the WDFW waterfowl webpage.

Figure 13. Total number of broods observed on District 2 brood ground survey routes.

28 | P a g e
Figure 14. Waterfowl estimates from breeding population surveys for the Potholes region of eastern
Washington.

29 | P a g e
PHEASANT
District-wide trends in harvest show an overall decline over the past 10 years, but harvest has
been up the past two years (Figure 15, top). Hunter numbers have been relatively stable (Figure
15, top), mirroring statewide trends. Days per hunter and harvest per hunter have remained
relatively stable in the district, with a slight increase in both in 2018 (Figure 15, bottom). The
majority of pheasant hunting occurs in Whitman County, which has about three times the harvest
and about two times more hunters than Lincoln or Spokane counties. Overall, pheasant
populations in the district should remain relatively stable this year but are experiencing long-
term declines. This is a trend seen across the country and it is likely associated with current
cleaner farming practices and habitat loss. Examples of this include the switch to larger scale
mono-culture farming, removal of hedge row (farming through small creeks beds and all the way
up into the gravel of the road), the more efficient harvest machinery leaving less waste grain,
increased use of herbicides and pesticides, and more recently the use of neonicotinoid
insecticides. All of these combine to reduce adult, nest, and chick survival through less food
(fewer insects and forbs) and less cover, and in the case of neonicotinoids, potential direct
mortality of individuals that consume the coated seeds.

For more information on harvest statistics see the Statewide Small Game Harvest Statistics here:
Pheasant - Statewide and by County. For more information on pheasant status in Washington,
see the most recent Game Status and Trend Report.

30 | P a g e
Figure 15. Top graph: Pheasant harvest and hunter numbers for District 2 from 2009–2018. Bottom
graph: Pheasant harvest and days hunted per hunter for District 2 from 2009–20118.

31 | P a g e
Since most of the land in this district is private, hunters will need to spend some time knocking
on doors to get access to the better sites. Many private landowners have enrolled in WDFW
hunter access programs recently in southeast Washington. See the Private Lands Program section
below for access program acres by GMU, and the Hunt Regulations Webmap for mapped
locations. For tips on pheasant hunting in general, see
https://wdfw.wa.gov/hunting/requirements/upland-birds/pheasant and the “Basics of Upland Bird
Hunting in Washington” publication available on the WDFW website here.

WDFW will be releasing game farm-produced roosters once again this fall at the traditional
release sites, which are also mapped on the Hunt Regulations Webmap and the Eastern
Washington Pheasant Enhancement Program publication.

32 | P a g e
CHUKAR AND GRAY PARTRIDGE
Nest and early chick survival for chukar and partridge should be good this year if broods
survived the spring showers. The warm summer should increase forage and help with brood
survival and recruitment. Except for the spike in 2012, harvest has been fairly stable over the
past 10 years, averaging 1791 birds a year (Figure 16). Harvest in 2018 was 2236, considerably
above both the 10-year average and almost twice the 2017 harvest for both species. Hunter
numbers increased slightly last year, and those hunters put in a lot of effort (measured by days
per hunter); harvest per hunter remains relatively stable (Figure 16). Partridge are most common
in Lincoln and Whitman counties and are most often seen in, and adjacent to, agricultural fields.
There are very few chukar in District 2. They are predominantly found along the breaks of the
Snake River, where terrain is steep and rocky with limited public access from above. There is
some access via U.S. Army Corps of Engineers land along the Snake River from below, but not
all of the Corps lands allow hunting. See their website for details.

For more information on gray partridge and chukar, see the Statewide Small Game Harvest
Statistics: Statewide and by County, and the most recent Game Status and Trend Report. For tips
on chukar and gray partridge hunting in general, see
https://wdfw.wa.gov/hunting/requirements/upland-birds as well as the “Basics of Upland Bird
Hunting in Washington” publication available on the WDFW website here.

33 | P a g e
Figure 16. Top graph: Chukar and partridge harvest and hunter numbers for District 2 from 2009–2018.
Bottom graph: Chukar and partridge harvest and days hunted per hunter for District 2 from 2009–2018.

34 | P a g e
FOREST GROUSE
Overall, forest grouse populations appear to be low but stable in District 2, with the best success
found in the forested portions of GMUs 124, 127, and 133. Of the four forest grouse species,
only ruffed and dusky grouse are found in District 2. Ruffed grouse are by far the most common
of the two, but dusky grouse can be found in GMUs 124, 127, and 133. The long winter may
have depressed nesting a little, but the wet spring and warm summer should combine to produce
good nest and brood success if hens were able to keep chicks dry during the critical first couple
of weeks following hatch. Harvest and hunter numbers are down relative to long term averages,
but have been relatively stable the past eight years (Figure 17, top). Hunter effort decreased in
2018, at 3.5 days per hunter relative to the previous five-year average of five. Hunter success
(harvest per hunter) was lower in 2018 than the five-year average of two birds per hunter (Figure
17, bottom).

For more information on forest grouse, see the Statewide Small Game Harvest Statistics:
Statewide and by County, and the most recent Game Status and Trend Report. For tips on grouse
hunting in general, see the new “Basics of Upland Bird Hunting in Washington” publication
available on the WDFW website here.

To evaluate population trends and harvest changes, WDFW began collecting forest grouse wings
and tails from hunters in 2016 and will continue these in 2019. Collection barrels will be
distributed at various hunting access points, as well as WDFW offices throughout Region 1. You
can help with this effort by dropping off a wing and tail from each forest grouse you harvest,
following the instructions at the barrel. Locations of wing barrels and other information about
this sampling effort can be found here.

35 | P a g e
Figure 17. Top graph: Forest grouse harvest and hunter numbers for District 2 from 2009–2018.
Bottom graph: Forest grouse harvest and days hunted per hunter for District 2 from 2009–2018.

36 | P a g e
QUAIL
The 2018-19 winter extending late into the season was likely hard on adult survival. However,
the cool spring and warm summer should combine to produce good nest and brood success, with
increased recruitment into the population if hens were able to keep chicks dry during the critical
first couple of weeks following hatch. Harvest and hunter numbers were both up in 2018 (Figure
18, top), as were success rates (harvest/hunter) and hunter effort (days/hunter) (Figure 18,
bottom). Access can be challenging, especially with most of the good quail habitat occurring in
and around farmsteads and towns. For more information on harvest statistics, see the Statewide
Small Game Harvest Statistics here: Quail - Statewide and by County. For more information on
quail status in Washington, see the most recent Game Status and Trend Report.

37 | P a g e
Figure 18. Top graph: Quail harvest and hunter numbers for District 2 from 2009–2018. Bottom graph:
Quail harvest and days hunted per hunter for District 2 from 2009–2018.

38 | P a g e
TURKEY
Opportunistic observations during field work, public reports, and damage claims all indicate that
the turkey population is doing well in GMUs 124–133 and stable in GMUs 136–142. This
corresponds with the observed stable to increasing harvest in the district and stable number of
hunters (Figure 19). Hunter effort in 2018 was 10 days/kill, a slight increase over the previous 5-
year average of 9 days/kill. GMU 124 saw the most harvest by far, with 1143 birds taken in
2018. GMUs 133 was a distant second with 434 birds harvested. GMU 130 had 383 birds
harvested and GMU 127 had 183. GMUs 136–142 had 153 birds harvested combined in 2018.
Hunter success was 42 percent in 2018, a 7 percent increase over the previous 5-year average.

Again, the district is predominantly private land and hunters will need to secure access. Access
during the spring hunt can be competitive, but access should be relatively easy to acquire in
GMU 124 for the fall hen season, given the extensive turkey damage complaints the department
has received from this area.

For more information on turkey in Washington, see the Turkey Game Harvest Statistics and the
most recent Game Status and Trend Report.

39 | P a g e
Figure 19. Top graph: Turkey harvest (spring, fall, & total) for District 2 from 2008–2017. Bottom
graph: Turkey hunters (spring, fall, & total) for District 2 from 2008–2017.

40 | P a g e
DOVE
Doves in District 2 occur at low population densities relative to the Columbia Basin and similar
regions. As often as not, cool temperatures just prior to or during the dove season push many
doves further south out of the district. Hunter harvest metrics have been highly variable (Figure
20, top), with harvest averaging about 3000 birds a year by about 370 hunters. Hunter effort
(days per hunter) has been slowly increasing the past ten years, and harvest per hunter has been
fairly stable over the past five years (Figure 20, bottom). It is important to note that eastside
hunters have an additional dove opportunity – the Eurasian collared dove. This dove is an exotic
dove that has invaded most of eastern Washington. It can be hunted and trapped with a license
year-round. Eurasian collared doves are commonly found in and around towns and around grain
elevators.

For more information on doves, see the Statewide Small Game Harvest Statistics: 2018
Statewide and by County, and the most recent Game Status and Trend Report.

41 | P a g e
Figure 20. Top graph: Dove harvest and hunter numbers for District 2 from 2009–2018. Bottom graph:
Dove harvest and days hunted per hunter for District 2 from 2009–2018.

42 | P a g e
MAJOR PUBLIC LANDS
The majority of the district is privately owned. However, WDFW and BLM own about 60,000
acres in the center of Lincoln County and about 15,000 acres in northwest Whitman County. For
more information on BLM property, or to order maps, please visit the BLM website. To hunt on
WDFW wildlife areas, you will need to display a WDFW Vehicle Access Pass (free with hunting
or fishing license purchase) or a Discover Pass. For more information on WDFW lands, see the
wildlife areas webpage.

The Washington Department of Natural Resources maintains land open to the public for
recreational purposes. Visitors to DNR land should be aware that a Discover Pass is required for
access. Further information regarding recreational opportunities on DNR land can be found on
the DNR website.

The U.S. Army Corps of Engineers also maintains lands associated with the Snake River open to
the public for recreational purposes. Not all of these lands are open to hunting, so hunters will
want to research beforehand. More information can be found here.

Turnbull National Wildlife Refuge (TNWR) has a limited entry youth waterfowl hunt (details
available through TNWR) and allows elk hunting by permit only (permits allotted via WDFW
special permit draw in June).

Riverside State Park and Mount Spokane State Park, along with all county parks and
conservation areas in Spokane County, are open to public access, but NOT to hunting.

There are several private timber companies that allow hunting in Spokane County, and
throughout the district there are private landowners enrolled in WDFW hunt access programs
(see Private Lands Program below and visit the WDFW Private Lands Access website).

43 | P a g e
PRIVATE LANDS
Since 1948, WDFW has worked with private landowners across the state to provide public
access through a negotiated agreement. Landowners participating in a WDFW cooperative
agreement retain liability protection provided under RCW 4.24.210. Landowners receive
technical services, materials for posting (signs and posts), and in some cases, monetary
compensation. In addition, lands under agreement are well known by WDFW Enforcement.

Currently, the private lands access program includes five basic access agreement types: Hunt by
Written Permission (HBWP), Feel Free to Hunt (FFTH), Hunt by Reservation (HBR),
Landowner Hunting Permit (LHP), and Register to Hunt (RTH). As of July 2019, the total
accessible acreage in District 2 is 5,980 acres in Spokane County, 47,376 in Lincoln County, and
91,800 in Whitman County. A summary of these acres by GMU and the program are in Table 2
below. The LHP in GMU 130 is managed by the Columbia Plateau Wildlife Management
Association (CPWMA). Access is only available through WDFW special permitting and
CPWMA raffle permit hunts (see WDFW’s 2019 Big Game Hunting Seasons and Regulations
pamphlet). More information on the other four access programs and where these enrolled lands
occur can be found at WDFW’s Hunt Regulations Webmap and the WDFW Private Lands
Access site.

44 | P a g e
Table 2. Acres of private land enrolled in WDFW access programs by GMU in District 2 as of July 2019.

                Hunt by Written                                                   Landowner
                                     Feel Free To Hunt         Hunt By                                Register to Hunt
   Game           Permission                                                     Hunting Permit
                                          (FFTH)          Reservation (HBR)                               (RTH)
 Management        (HBWP)                                                           (LHP)
 Unit (GMU)
               Properties   Acres    Properties   Acres   Properties   Acres    Properties   Acres   Properties   Acres

 124 Mt                                                       2         370         0         0          0         0
                   1         146         0         0
 Spokane

 127 Mica          3        2,613                             0          0          0         0          0         0
                                         0         0
 Peak

 130 Cheney        1        1,800        0         0          0          0          1        2,852       0         0

 133                                                          1        2052         0         0          0         0
                  18        20,788       1        612
 Roosevelt

 136                                                          0          0          0         0          0         0
                  12        16,658       7        7,266
 Harrington

 139 Steptoe      15        13,989       6        7,386      34        29,099       0         0          1         75

 142 Almota       12        16,666       1        336        20        22,457       0         0          0         0

 TOTAL

45 | P a g e
You can also read