GRIHA: Synthesizing 2-Dimensional Building Layouts from Images Captured using a Smart Phone
←
→
Page content transcription
If your browser does not render page correctly, please read the page content below
GRIHA: Synthesizing 2-Dimensional Building Layouts from
                                                     Images Captured using a Smart Phone
                                              Shreya Goyal, Naimul Khan, Chiranjoy Chattopadhyay, and Gaurav Bhatnagar
                                                                                        March 2021

                                                                                           Abstract
                                                  Reconstructing an indoor scene and generating a layout/floor plan in 3D or 2D is a widely
                                              known problem. Quite a few algorithms have been proposed in the literature recently. However,
arXiv:2103.08297v1 [cs.CV] 15 Mar 2021

                                              most existing methods either use RGB-D images, thus requiring a depth camera, or depending on
                                              panoramic photos, assuming that there is little to no occlusion in the rooms. In this work, we
                                              proposed GRIHA (Generating Room Interior of a House using ARCore), a framework for generating
                                              a layout using an RGB image captured using a simple mobile phone camera. We take advantage of
                                              Simultaneous Localization and Mapping (SLAM) to assess the 3D transformations required for layout
                                              generation. SLAM technology is built-in in recent mobile libraries such as ARCore by Google. Hence,
                                              the proposed method is fast and efficient. It gives the user freedom to generate layout by merely
                                              taking a few conventional photos, rather than relying on specialized depth hardware or occlusion-free
                                              panoramic images. We have compared GRIHA with other existing methods and obtained superior
                                              results. Moreover, the system is tested on multiple hardware platforms to test the dependency and
                                              efficiency.

                                         1    Introduction
                                         Generating Building Information Model (BIM) in 2D/3D from indoor scenes has applications including
                                         real estate websites, indoor navigation, augmented/virtual reality, and many more. BIM should include
                                         the global layout of the entire floor plan of the space, number of rooms, and arrangements. The most
                                         natural way to create the floor plan is by manually measuring each room and integrating everything in
                                         Computer-Aided Design (CAD) software to have a global layout. However, such manual measurement
                                         is a tedious task and requires a significant amount of work hours. Hence, there is a need to develop
                                         a graphics and visualization system that takes a few images or videos of the entire indoor scene and
                                         automatically generates a floor plan. The pictures or videos may or may not have depth information
                                         since a typical user might not have a depth camera or specialized hardware to measure depth in the
                                         scene.
                                              However, estimating an accurate layout from RGB images is a challenging task. It requires precise
                                         depth information along with the RGB images and an exact point cloud with real-world scaling. The
                                         current state of scholarship (as discussed in Sec. 2), as well as commercial applications for layout
                                         estimation, uses RGB-D images or panorama images to solve this problem. Despite good accuracy, these
                                         methods require special hardware (depth camera) or a particular photo capture mode (panorama with
                                         little to no occlusion). Such requirements restrict widespread adoption. In this work, we propose a
                                         framework named GRIHA (Generating Room Interior of a House using ARCore). This a framework to
                                         estimate the 2D floor plan of an indoor scene using RGB images captured through a mobile camera.
                                         Figure 1 depicts the potential partial input RGB images of indoor locations and their corresponding floor
                                         plan of the entire indoor scene. In our proposed method, the user needs to take pictures of all the indoor
                                         scene rooms using our developed application. The depth map of the locations is extracted from these
                                         pictures adapting the method in [6] followed by edge map extraction using [31]. The RGB images and
                                         depth maps are used for 3D reconstruction. The point clouds and edge maps are then mapped in 2D for
                                         the final layout using a novel regularization technique. We take advantage of Google ARCore library for
                                         pose estimation, thus saving computational time.
                                              In this paper, our major contributions are: (1) 2D floor plan estimation from RGB images without
                                         using panorama or 360◦ spherical images, (2) Development of an ARcore based Android mobile appli-
                                         cation for data collection and application of ARcore pose data for 3D reconstruction of the scene, (3)
                                         Near accurate layout estimation with a fewer number of images captured through the camera, compared
                                                                                               1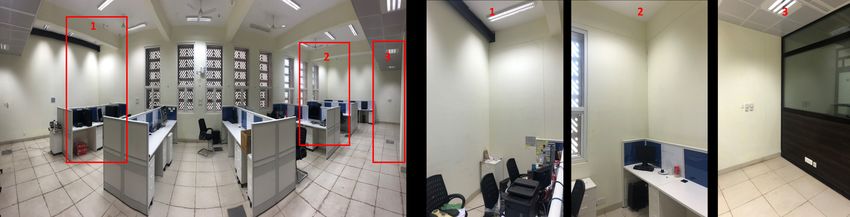
to the existing techniques, and (4) Cross-platform testing of the proposed framework on multiple de-
vices. Currently, we are assuming only Manhattan and weak Manhattan scenes. The proposed method
compares well in terms of dimensions measured by the existing commercial applications on the Android
platform to generate the layout and measure the dimensions. GRIHA works well in case of occlusion in
the indoor scene where existing methods may fail.
    The remaining of this manuscript is organized as: Section 2 highlights the main differences between
GRIHA and the state-of-the-art. Section 3 defines the problem statement and Sec. 4 gives the overview
of the data collection step for the proposed system. Section 5 describes the proposed system and its
constituent steps. Section 6 describes the various qualitative and quantitative experiments performed
for the proposed algorithm and sub-modules, and Sec. 7 concludes with an outlook for the future work.

2    Related Work
Layout estimation from RGB-D and panorama images has been a widely explored. The authors in
[20, 28] have reconstructed the indoor scene in 3D using monocular images and estimated the layout
using vanishing points and depth features. In [29], authors have calculated layouts on RGB images by
an encoder-decoder framework to jointly learn the edge maps and semantic labels. In [9] room layout is
generated from pictures taken from multiple views and reconstructed using SfM and region classification.
In another work,[13] authors estimated layout in a cluttered indoor scene by identifying label for a pixel
from RGB images, using deep FCNN, and refined using geometrical techniques.
    Since monocular images cannot capture the entire scene, layout from panorama images to increase,
view is an alternative. In [31], an encoder-decoder network predicts boundary and corner maps and
optimized over constrained geometrical properties of the room. Authors in [25] estimated room layout
by regressing over boundaries and classifying the corners for each column representation of an image.
Furthermore, [16] generated a 3D structure for 360-degree panorama image by reasoning between geome-
try and edge maps returned by a deep neural network. The work presented in [18] proposes an approach
to generate indoor scene layout by learning the encoded layout representation in row vectors. In [14],
the authors have generate a navigation mesh with captured point clouds using SfM. In [27, 30], layout is
obtained from a panorama image by estimating object locations and pose in the room. The indoor layout
has also been generated from monocular video sequences in [17], where SLAM/SfM techniques are used
for 3D reconstruction. In another work [7], the author has generated a 2D layout of the room using depth
data and 3D reconstruction using SLAM. In the context of floor plan generation, [10] has reconstructed
the layout from the input panorama images using SfM and generated a 2D floor plan by posing it as
the shortest path problem. In addition, [19] predicts the global room layout and transformations using
partial reconstructions of indoor scenes using RGB-D images without using feature matching between
partial scans. In another work, [24] proposed a floor plan estimation method from 3D indoor scans by
offering a 2 stage method, where the first-stage clusters the wall and room instances the second stage
predicts the perimeter of the rooms.
    In [21], a BIM of the interior of the house was generated from 3D scans. In [12], authors proposed
CrowdMap, which used sensor-rich video data for reconstructing floor plans from indoor scenes. Authors
in [26] have generated floor plans by triangulating the space between wall samples and partitioning
space into the interior and exterior spaces. In [11], 2D floor plans are generated by estimating camera
motion trajectories from the depth and RGB sequences and by registering 3D data into a simplified
rectilinear representation. In [23], authors have proposed a system to create 2D floor plans for building
interiors which takes 3D point clouds from 3D scanners by utilizing height data for detecting wall and
ceiling points and projecting the rest of the points in a 2D plane. In the work proposed by [22], authors
have proposed an end to end framework for 3D reconstruction of a scene using RGB images by directly
regressing to 3D. The existing layout estimation methods in the literature largely depends upon the
depth-sensing hardware and occlusion free panorama. Hence, we propose a layout estimation system,
GRIHA, which uses multiple 2D images of an indoor scene, taken from a traditional mobile phone’s
camera, which suppresses the requirement of depth-sensing hardware and easier to use in the occluded
indoor environment.

3    Problem Statement
Figure 1 shows the input and output of the proposed system GRIHA. Figure 1(a) shows the partial
images taken from every corner of the room by mobile phone’s camera. Here, C 1 , C 2 , C 3 , C 4 are the

                                                    2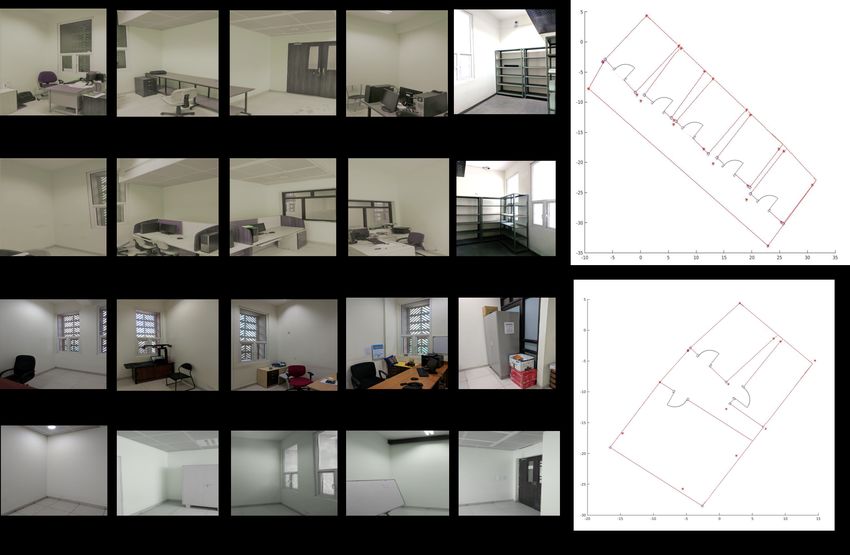
Figure 1: A schematic illustration of the entire input and output scenario while using GRIHA.
four locations from which a user captures four room images using a mobile camera. These captured
images are marked as I1 , I2 , I3 , I4 , where image Ik is captured from camera pose C k . These are the
images that act as inputs to the GRIHA framework. Figure. 1 (b) depicts every corner image’s mapping
to a partial 2D layout. To construct the 2D floor plan, we need to map the images to the corresponding
corner points of a room in a Manhattan world and establish a sequence to get the room’s complete
layout. Figure. 1 (c), and (d) show the input stream of indoor scene images for a complete floor and its
respective output floor plan. To summarize, the task at hand is Given a sequence of images of all the
rooms (for every room, images of four corners and the door) in a single floor of a building, generate the
2-D plan of the entire floor.
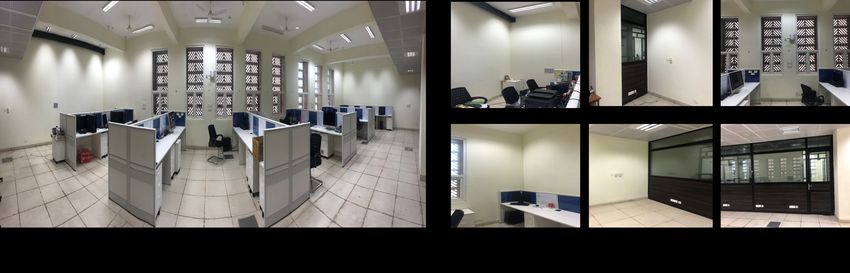
Figure 2: Panoramic image and multiple 2D images for the same scene.
3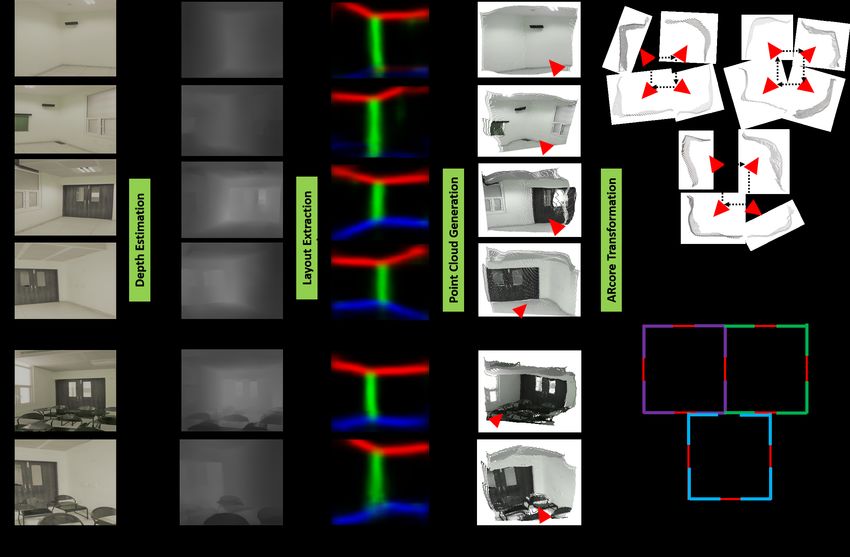
Figure 3: Highlighted occluded portions of the scene and corresponding 2D images.

4    Image Acquisition Platform
Most of the methods for 3D reconstruction of a room and floor plan estimation requires an ample amount
of specific hardware such as depth camera, Kinect camera, LiDAR. Although some methods exist for
layout generation from monocular images [31], they rely on occlusion-free panoramic photos, which are
almost impossible to take in common spaces such as an office or home. Instead, our proposed method
relies on multiple regular 2D photos, which are easier to capture in an occlusion free manner. Figure 2
(a) shows the panoramic image of a large office space and Fig. 2(b) shows multiple 2D images for the
same scene.
    It can be seen that the panoramic image of a vast space may have several occlusions, which make
their 3D reconstruction difficult and erroneous. Most of their corners and other important edges may
get occluded in the panorama because of the furniture and other decors. At the same time, they are
easier to capture in their multiple 2D images. It’s not possible to cover the complete scene (backside of
the camera) in a panoramic image without losing important information. While capturing multiple 2D
images makes it easier to capture all the corners, edges, and other portions of the scene, without getting
occluded by the furniture and without losing any information. Figure 3 shows the highlighted portions
of the scene in the panoramic image and their corresponding 2D images, which have more information
about the scene than their panoramic version. Hence, generating the scene’s layout from their separate
2D images gives more information about the scene than generating it from its panoramic image.
    We used smartphones to capture images and track camera motion for our experiments. The proposed
method attempts to address this issue by taking advantage of recent mobile Augmented Reality libraries
for pose estimation. Figure 4 shows an illustration of how GRIHA collects data using ARCore, which
readily available on almost all Android devices. ARcore [2] is a library by Google, which uses the
phone’s IMU sensor’s data along with image feature points for tracking the pose of the camera utilizing
a proprietary Simultaneous Localization and Mapping (SLAM) algorithm. It performs pose estimation
in real-time, challenging to achieve with a third-party SLAM algorithm. To collect the data, an android

    Figure 4: A schematic representation of the image acquisition framework developed for GRIHA.

                                                    4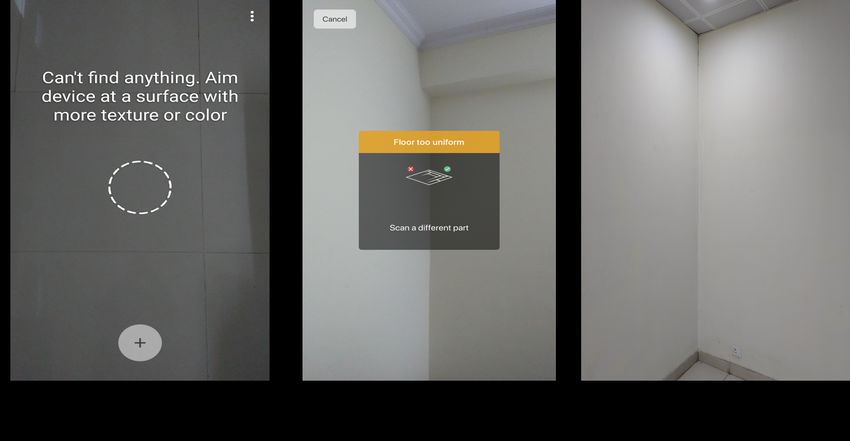
Figure 5: Pipeline of the proposed framework.

application was developed in Unity3D environment. The camera’s real-world position and orientation
were extracted. The proposed method takes partial scene images for each room in the house for floor
plan reconstruction.

5     Proposed System
5.1    Overview of GRIHA
Figure 5 depicts a step-by-step visual illustration of the working principle of GRIHA. As shown in Fig.
5(a), a stream of RGB images are taken for each partial scene in the entire house. Depth estimation is
done individually for each RGB image (see Fig. 5(b)) and edge/boundary map is estimated by adapting
the network proposed in [31] for perspective images (see Fig. 5(c)). Mapping the depth maps with RGB
images and edge maps of layouts, the point clouds are generated and layout is extracted from the point
clouds (see Fig. 5(d)). When the pictures are being taken, we utilized ARCore’s built-in SLAM algorithm
to extract the 3D pose of the camera and saved it alongside the images. The camera poses are utilized
to rebuild the camera trajectory, which is utilized for transforming each partial scene point cloud after
projecting them into a 2D plane. The point cloud of the layout is extracted from the 3D reconstructed
scene using edge maps generated in the previous steps. All the partial point clouds are projected in
2D and translated using ARcore transformations. Each partial point cloud is then regularized locally
and globally to generate the 2D floor plan for the house (see Fig. 5(e)). The red markers indicate the
trajectory of the camera while capturing the images for each room in the house.

5.2    Depth Estimation
Depth perception is essential for estimating the correct dimension of the targeted floor plan. Figure 6
depicts an illustration of how the depth map is computed from a given image. Traditionally, a device
with a built-in depth camera such as Google Tango or Microsoft Kinect is used for capturing point
clouds directly from the scene. However, in GRIHA, the input taken is an RGB image taken from a
traditional mobile device’s camera. Hence, depth estimation is a mandatory step in this context. For
depth perception from RGB images, multiple methods exploit feature matching techniques in multiple
                                                   5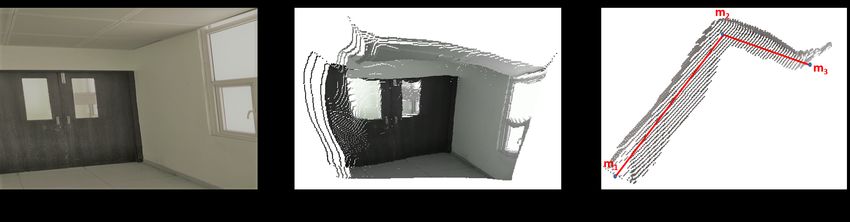
Figure 6: An illustration of how depth is estimated by adapting the encoder-decoder model proposed in
[6].

images of the same scene and reconstruct a 3D model for it. However, such schemes require a trained user
to capture the data to ensure correspondence across images. Hence, a feasible solution for estimating
depth from a single image is to use a pre-trained machine learning model. Depth for RGB images can
be learned in a supervised manner from ground truth depth-maps and a trained neural network can
be used for estimating depth for new images. We have adapted the method proposed in [6], where
an encoder-decoder architecture is used after extracting image features with DenseNet-169, resulting in
high-resolution depth-maps. The encoder used in this method is a pre-trained truncated DenseNet-169.
The decoder consists of basic blocks of convolutional layers, concatenated with successive 2× bilinear
upsampling blocks, and two 3 × 3 convolutional layers, where the output filter is half the size of the
input. Figure. 7 shows the results for the depth estimation model on our dataset. The depth estimation
model’s performance analysis is present in Sec. 6.

5.3    Layout Estimation
While analyzing each partial scene, it is required to identify each pixel’s classification as a wall or edge
pixel. This classification/segmentation helps in the identification of the layout of the indoor scene into
consideration. Hence, edge and boundary maps of a scene is a requirement for layout estimation. In
our work, we have adapted the technique proposed in [31] to identify the scene’s edge/boundary maps.
Figure. 8 shows the network architecture of LayoutNet and its inputs and respective outputs. LayoutNet
network is an encoder-decoder structure. The encoder consists of seven convolutional layers with a filter
size of 3 × 3 and ReLU (Rectified Linear Unit) function and max-pooling layer follow each convolutional
layer. Decoder structure contains two branches, one for predicting boundary edge maps and the other
for corner map prediction. Both decoders have similar architecture, containing seven layers of nearest
neighbor up-sampling operation, each followed by a convolution layer with a kernel size of 3 × 3 with the
final layer being the Sigmoid layer. Corner map predictor decoder additionally has skip connections from
the top branch for each convolution layer. Since their FOV (Field Of View) of the images is smaller, an
additional predictor for predicting room type is added to improve corner prediction performance. The
RGB image of the scene also takes Manhattan line segments as additional input that provides other input
features and improves the network’s performance. Figure 9 shows the predicted edge and corner maps
for the input image on our dataset. All the annotations for performance evaluation is done using the
annotation tool proposed in [15]. Our dataset’s images also include images that have occluded corners
and wall edges, so there is no requirement for the manual addition of corners.

                          Figure 7: Results of depth generation on our dataset.

                                                     6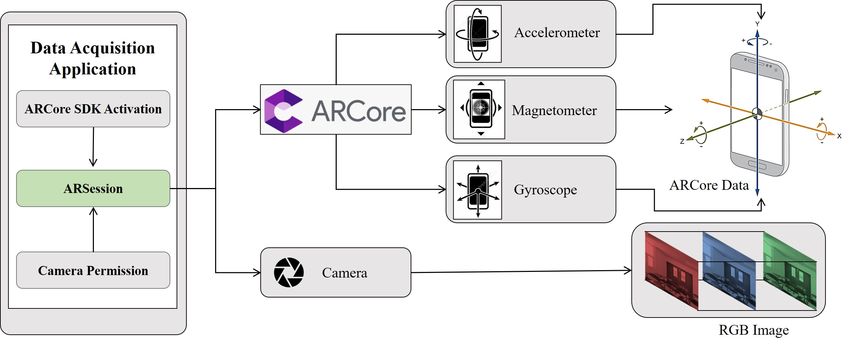
Figure 8: An illustration of how LayoutNet is adapted for the layout estimation in GRIHA.

5.4    3D Reconstruction
To generate a layout of the entire scene, a 3D reconstruction of each partial scene must be done. This
step is not required in the methods where depth cameras or specialized hardware are used to capture
the images/point clouds. However, in the proposed work, RGB images are taken from a mobile phone’s
camera, which does not have the first place’s depth information. Hence, 3D reconstruction of each scene
image is required to be done since we have tried to suppress additional hardware requirements for this
task. We mapped every pixel of the RGB image with depth maps generated in the previous steps to
create a point cloud for the scene. This step is preceded by a camera calibration step to identify the
phone’s camera’s intrinsic parameters: focal length (f ), center coordinates (Cx , Cy ). Here, coordinates
in the point cloud are generated by:

                                               Du,v
                                            Z=                                                         (1)
                                                 S
                                               (u − Cx ) ∗ Z
                                           X=                                                          (2)
                                                    f
                                               (v − Cy ) ∗ Z
                                           Y =                                                         (3)
                                                    f
    Here, X, Y, Z are coordinates corresponding to the real world and Z is the depth value. Du,v is the
depth value corresponding to the (u, v) pixel in the image in the depth map. S is the scaling factor of
the scene, obtained empirically and comparing dimensions of real-world objects and point clouds.Here,
f , Cx , Cy are the intrinsic parameters of the camera, generated by calibration. At the end of this step,
we have 3D reconstruction of each partial scene in the real world scale ( Fig. 5(d)). The red marker
shows the pose of the camera while capturing the RGB image in the scene.

                         Figure 9: Results of layout generation on our dataset.

                                                    7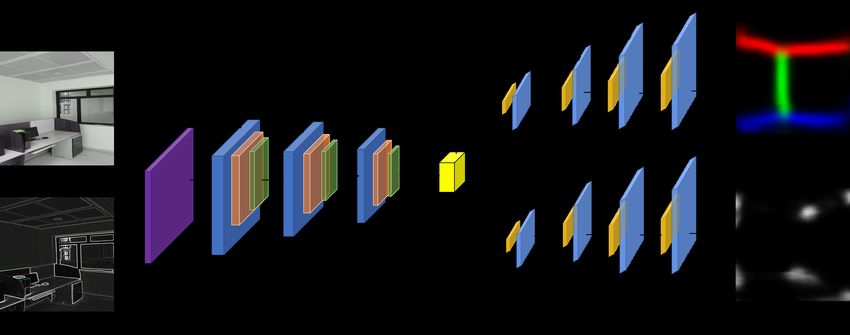
5.5    Point cloud transformation and regularization
The generated point clouds in the previous step are then mapped with the edge maps generated to
identify the boundary pixels in the point cloud and projected in 2D space (as illustrated in Fig. 5(e)).
These edge maps (as discussed in Sec. 5.3) are used to classify the pixels in point clouds in-wall and
edge classes to identify the room’s geometry. These point clouds are scattered 3D points of the layout
and required to be regularized to reduce the error in the generated 2D layout’s geometry (as illustrated
in Fig. 10 for a given room). We utilized ARCore to extract the 3D pose and generated the camera
trajectory from the extracted pose, which is depicted by dotted arrows, as shown in the top panel of Fig.
5(e). It returns rotational and translation coordinates for each scene image for the first images taken.
All the captured images are mapped to the local coordinate system of the image acquisition application
discussed in Sec. 4. Also, there is no requirement of rotating the coordinate system while considering
the transformation.

Algorithm 1 Regularize point clouds (PC)
 1: ∀Rj ∈ R                                                                        . R: Total number of rooms
 2: for i = 1 : n do                                                                            . n: no of PC
 3:    Pi = 2DP ointClouds
 4:    K = boundary(Pi )
 5:    C(c1 , c2 , ..., ck ) = kmeans(Pi (K))                                                      . C: Clusters
 6:    m1 , m2 , m3 = mean(c1 ), mean(c2 ), mean(c3 )
 7:    line1 = line(m1 , m2 )
 8:    line2 = line(m2 , m3 )
 9:    while angle(line1 , line2 )  90 or φ < 90 then
17:        φ(si , si+1 ) = 0

    Algorithm 1 regularizes the local point cloud of each partial scene image for every room(Rj ) in all the
room in a scene dataset (R). Here, Pi is the point cloud of each i-th scene where n is the total number of
point clouds. Boundary points for each Pi is extracted in Pi (K). Using the k-means algorithm, clusters
of point set are made for k = 3 on the Euclidean distance between them, where m1 , m2 , m3 are the
cluster means (line 6). Since we are assuming the Manhattan world for the scene, the lines joining means
are re-adjusted to have a right angle (line 10). Each regularized local point cloud (RPi ) is transformed
(T Pi ) using rotation angle θx , θy , θz , along each x, y, z axis and translation coordinates [tx , ty ] returned
by ARcore (line 12). For global regularization, using each transformed point cloud, polygon (F P ) is
formed (line 13), with p number of sides (s). For each pair of sides, the angle between them (φ) is
checked and if they are not perpendicular, they are made collinear (line 17) assuming the world to be
Manhattan.

           Figure 10: An illustration of partial scene layout generation from 3-D point cloud.

                                                        8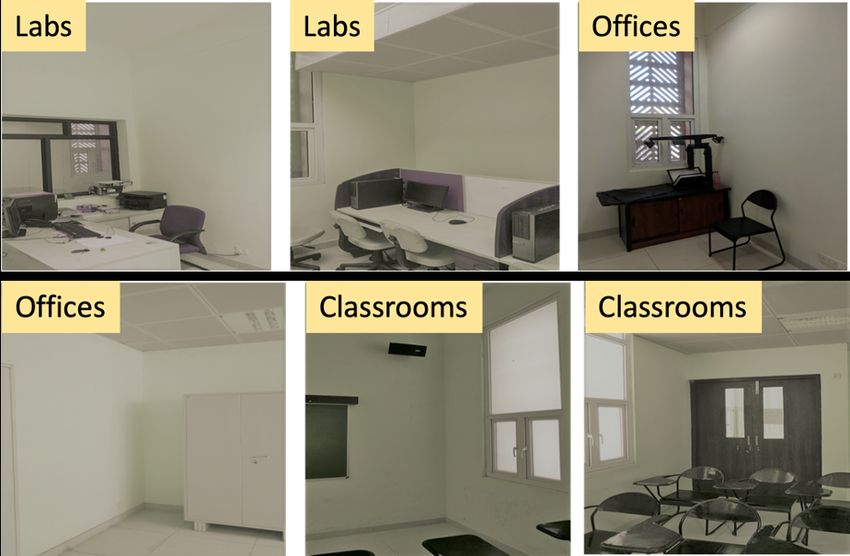
GRIHA performs regularization in 3 steps. In step 1, unique layouts are regularized, and in steps
2 and 3, the complete floor plan is regularized, taking everything collectively. Figure 10 depicts the
partial indoor scene with 2D layout generation. Figure 10(a) is the partial indoor scene RGB image
into consideration, Fig. 10(b) is its 3D reconstruction in the form of point cloud, and Fig. 10(c) is the
layout extracted from a 3D reconstructed point cloud using the previous steps’ layout. It shows the 2D
projection of the layout point cloud, where m1 , m2 , m3 are the means of three clusters extracted. It also
shows the lines joining m1 , m2 , and m3 , the regularized point cloud from the projected set of points.
    Figure 11 depicts the transformation of partial point clouds and regularization of global layout. Fig-
ure. 11 (a) shows the coordinate system in real-world (XW , YW , ZW ) and in ARcore with the mobile
device (XA , YA , ZA ). ARcore transformations have to be rotated about the ZA axis to align the coor-
dinate systems. Each partial 2D point set is then rotated and translated with the transformation given
by ARcore (Fig. 11 (b)). Figure 11(c) shows the globally regularized 2D point set for the partial point
clouds for a set of rooms, and it agrees with the real world dimensions.
    The further steps involved in the floor plan’s regularization include (1) generating boundaries for
all the rooms and (2) a post-processing step, which aligns all the rooms with the boundary generated.
Algorithm 2 and Alg. 3 depicts the process of finding a boundary for all the regularized layouts and
their post-processing to align them along the boundary polygon, respectively. Algorithm 2 identifies the
points for each room polygons inside the boundary polygon or on the boundary so that room polygons
could be aligned with the boundary. Points that are supposed to be on the boundary but lying inside

                      Figure 11: Depiction of translation and global regularization.

    (a) Finding the points which lie inside the boundary   (b) Aligning the rooms with the boundary.
    polygon.

           Figure 12: An illustration of the intermediate stages of the regularization process.

                                                       9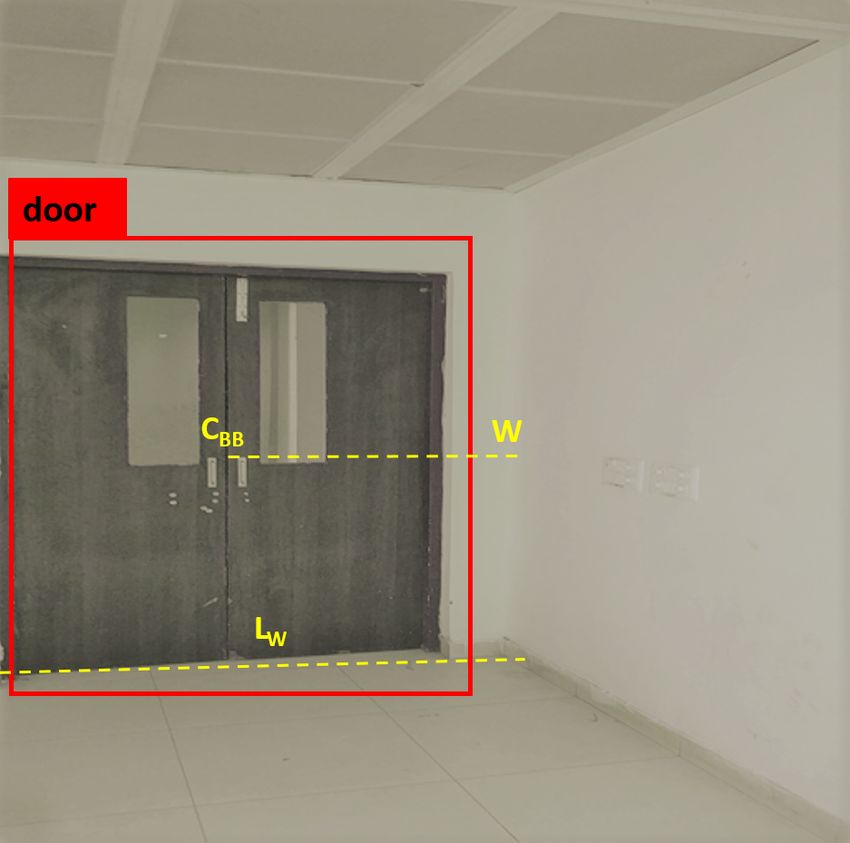
Algorithm 2 Finding the points inside the boundary polygon
 1: for i = 1 : n do
 2:    Li = (Pi , ∞)
 3:    if intersection(Li , Chull ) == even then           . Chull : Convex hull forming boundary
 4:        Pi ← Poutside                            . Poutside : Pool of points outside the boundary
 5:    else
 6:        Pi ← Pinside                               . Pinside : Pool of points inside the boundary

                   Figure 13: Step by step generation of the floor plan of an indoor scene.

are identified using this algorithm. In Alg. 2, line 2, a line Li is traced for each point Pi to ∞, where line
3 checks if the intersection of line Li with the boundary of Convex hull Chull is even number of times
or odd number of times. If the intersection has happened 0 or even number of times, then the point is
considered to be outside the boundary, otherwise it is considered to be inside or on the boundary. Figure
12 (a) illustrates an example of such process. For each room polygon, points closer to the boundary line
are identified, and a line is drawn from that point to infinity. If the line intersects the boundary polygon
0 or even times (point A, F, G), then that point is outside the polygon. Otherwise, it is inside or on the
polygon boundary (point B, C, D, E). The purpose of using Alg. 2 is to find the points which are lying
inside the boundary and use them for further post-processing. If the point is identified to be inside the
boundary polygon, then using Alg. 3, they are aligned to the boundary line.
    Algorithm 3 shows the process of aligning the points of room polygons to the boundary polygon which
are found to be inside. Figure. 12 (b) shows the example of the polygon P1 P2 P3 P4 which is required to
be aligned with the boundary line CF . Points P1 and P4 are found to be inside the boundary polygon
and needs to be aligned with line CF . Hence they need to be replaced with points A and B respectively.
Algorithm 3 finds the location of points A and B on line CF and replaces P1 with A and P4 with B
by dropping a perpendicular line P1 A on CF and using properties of perpendicular line segments for

Algorithm 3 Aligning the points of each polygon to the boundary
 1: ∀Pi ∈ polygon
 2: L1 = Pi ⊥ CF
 3: L2 = CF
 4: find equation of each line
 5: y = YC + mL1 ∗ (x − XC )
            (Y −Y )
 6: mL1 = (XC −XF )
              C   F
              (Y   −Y )
 7:   mL2 = (XPPi −XAA )
                i
 8:   mL1 ∗ mL2 = −1                                                         . Perpendicularity condition
                        −YA
 9:   XA = XPi + XYCC −X  F
                            ∗ (YPi − YA )             . Substituting the known  values to find unknowns
10:   YA = YC + mL1 ∗ (XA − XC )
11:   XPi = XA                      . Replacing the points of polygon with respective points on boundary
12:   YPi = YA

                                                     10
Figure 14: A schematic representation of the network architecture of YOLO for door detection.
(a) Bounding box around the door. (b) Positioning of the doors on a (c) Door centroid placement.
floor plan.
Figure 15: An illustration of the performance of the door detection and placement algorithm. in floor
plan.
identifying the coordinates for A and B. It checks slopes of both line segments (Alg. 3, line 6 and line
7) and checks the property of slopes of perpendicular line segments to identify (XA , YA ) and (XB , YB ),
(Alg. 3, line 8). Once identified, it replaces both P1 and P4 with A and B (Alg. 3, line 11 and line 12).
Figure 13 depicts the entire phases of generating a floor plan from its 2D projection to the final 2D
floor plan. Figure 13(a) depicts the 2D projection of each room’s partial point clouds on a floor after
transformations taken by ARcore data. Figure 13(b) shows the local and global regularized 2D layouts of
each room, depicting the global relationship among them. In Fig. 13 (c), the boundary for all the rooms
is generated by finding a convex hull for all the polygons and lines. Figure. 13(d) shows the further
refined and post-processed floor plan from the 2D projections. Further to the process of post-processing
of the floor plans generated at this stage, door detection in the scenes and marking them in the floor
plans is explained in the coming section.
5.6 Door Detection and placement
Indoor object detection such as doors, windows or other objects in indoor environment, from images
or videos is a widely explored problem, solved using object detection networks such as YOLO, Faster-
RCNN, SSD, etc. However, a dataset containing doors or windows specific to indoor scenes is not
commonly available. In the current scenario, the post-processing has been limited to marking of doors,
leaving others indoor objects due to very less variation in the other objects in the available dataset. It
is challenging to generate a dataset containing doors in an indoor environment with diversity to train/
fine-tune existing networks. Hence, we used the DoorDetect dataset [8]. In our work, we have trained
the YOLO object detection network on the DoorDetect dataset to detect doors in the indoor scenes
to complete the floor plans. YOLO’s detection network has 24 convolutional layers followed by 2 fully
connected layers (see Fig: 14). Each alternating convolutional layer has a reduction of feature space
from its preceding layer. The network is pre-trained with ImageNet-1000 class dataset.
The DoorDetect dataset contains 1213 images with annotated objects in an indoor environment. The
11door images contain various doors such as entrance doors, cabinet doors, refrigerator doors, etc. The
mAP on DoorDetect dataset for YOLO came out to be 45%. Figure 15(a) shows the door detected in
one of the partial scene images in our experiments. Figure 15(b) shows the door placement in the floor
plan generated in the previous steps. Figure 15(c) shows the parameters used for the door placement.
The door placement is carried out using the following equations:
dist(CBBI , WI )
RatioD = (4)
LWI
dist(CBBF , WIF ) = LWF ∗ RatioD (5)
Where CBBI is the centroid of the bounding box of door detection (returned by door detection) in
the real world image, dist(CBBI , WI ) is the distance between CBBI and WI (wall), LWI is the distance
between two corners of the walls in the real world image and RatioD is the ratio between them. RatioD
is the ratio used for marking the doors in the generated floor plans with the reference of real world
images of the scene. For each individual partial scene with a door, is marked with a respective door
symbol in its corresponding floor plan. Here, LWF is the distance between two corners of the walls in the
corresponding 2D mapping (floor plan), dist(CBBF , WIF ) is the distance between centroid of the door
symbol (CBBF ) and wall (WIF ) in the corresponding 2D mapping (floor plan) which is the unknown
entity and needs to be identified using RatioD to mark the doors in the floor plan. The axis of the
door is kept perpendicular to the wall it belongs to. RatioD is the ratio which is scale invariant for the
generated floor plan and will remain same in the partial indoor scene image and its corresponding 2D
map. In the next section, experimental findings will be discussed in details with their qualitative and
quantitative comparison with state of the art methods.
6 Experimental Findings
6.1 Setup and Data Collection
Figure 16: Sample images from the dataset.
For all the experiments, we have used two hardware platforms. They are Google Pixel 2 XL and
Samsung A50. We have utilized both of these mobile phones to deploy the data collection application
and capture the images’ for all the locations. For depth estimation accuracy analysis on our dataset,
structural similarity, and peak SNR metrics are used. Also, we have used the metrics like pixel error and
12Figure 17: Estimated layouts for Labs and office datasets.
corner error for layout estimation accuracy analysis on our dataset. For evaluating the proposed layout
estimation system’s performance, GRIHA, area, and aspect ratio error metrics are used as quantitative
analysis. Qualitative analysis is also done to depict the proposed system’s robustness over existing
Android and iOS based mobile applications. We have also compared the performance of GRIHA on the
two hardware platforms mentioned at the beginning of this paragraph. In GRIHA, we have performed
experiments with a 3 set of images. The first dataset is the right-wing of the ground floor of the Computer
Science Department building in IIT Jodhpur, which are Classrooms, the second is the left-wing of the
same floor, which are Labs and the third is the first floor of the same building which are Offices. Figure
16 shows sample images from the collected data from each category. It can be seen that the images in
the dataset can contain zero to moderate or heavy occlusion with differently illuminated environments.
6.2 Depth Estimations analysis
Table 1 shows the performance analysis of the depth estimation step in the proposed method. Ground
truth depth maps for all the images in our dataset were generated using Kinect XBOX 360 depth camera.
The performance evaluation is done on two metrics, Structural Similarity (SS) and peak SNR (PSNR)
are defined as:
(2µx µy + C1 ) ∗ (2σxy + C2 )
SS(x, y) = (6)
(µ2x+ µ2y + C2 ) ∗ (σx2 + σy2 + C2 )
P SN R = 20log10 ∗ (M AXI ) − 10log10 ∗ (M SE) (7)
In Eq. 6 , µx and µy are the mean intensity terms, while σx and σy are the standard deviations
in the two image signals x and y, C1 & C2 are included to avoid instability when summations of mean
intensities are close to zero. Also, for P SN R, M SE is the mean square error between the reference
image and generated image, M AXI is the maximum possible pixel value of the image. Lower value of
SS and PSNR indicates low quality of generated images as compared to reference ground truth image.
It can be seen that the images in Labs dataset are performing worse than other dataset given its lowest
value in terms of Structural Similarity, and PSNR because of the presence of variety of occlusion creating
surfaces which creates irregular planes and limited field of view, making depth estimation a challenging
task. As shown in Fig. 16, for Labs scene images, the corners of partial scenes are highly occluded
because of laboratory equipment, fixed sitting spaces and various other immovable heavy indoor objects.
13Table 1: Performance analysis of depth estimation on our dataset
Method Classrooms Labs Offices
Structural similarity 0.8433 0.7528 0.8174
Peak SNR 22.46 17.55 20.7808
6.3 Corner and edge estimation analysis
Table 2 shows GRIHA’s performance on estimating the corners and edges of a room. The annotations
for the layouts were generated using the tool proposed in [15]. The evaluation is done on two parameters,
pixel error P and corner error. Pixel error identifies the classification accuracy of each pixel with the
estimated layout and ground truth and averaged over all the images in a dataset.
PIn
Similarity(P ixelE , P ixelGT )
P = n=1 (8)
( n
P ixel ∈ EdgeM ap, if P ixel > 0
Similarity = (9)
P ixel ∈
/ EdgeM ap, Otherwise
where, n is the total number of images in a dataset, P ixelE and P ixelGT are the pixels in estimated
and ground truth images. Corner error C calculates the L2 distance between the estimated corner and
the ground truth corner of a room, normalized by image diagonal and averaged over all the images in a
dataset. Here, CornerE and CornerGT are the estimated and ground truth corners.
PIn
DistL2 (CornerE , CornerGT )
C = n=1
(10)
n
It can be seen that Labs and Offices image dataset is more challenging than other datasets because
of more occluded corners and edges with complex design of furniture and other experimental setups.
6.4 Comparative Result
Figure. 17 shows the generated layouts for our collected image datasets. Figure. 17 (a) shows resultant
layout for labs dataset and Fig. 17(b) shows for offices dataset. Layout for labs dataset also include
formation of corridor in the final layout, where the right panel shows the input stream of RGB images
for the respective scenes.
A comparative study was performed with applications such as Magic Plan [5], Tape Measure [4],
Measure [3], and AR Plan3D [1] with the given ground truth measurements for each dataset. For
every categories of images, the ground truth measurement is done by manually measuring each room’s
dimension in each dataset and evaluating the area and aspect ratio, respectively. Quantitative evaluation
is done on mean absolute % error for area and aspect ratio for each dataset.
R
1 X xGT − xi
Mean Absolute % Error (E) = (11)
R i=1 xGT
where R is the total number of rooms in a dataset, xi is the area/ aspect ratio of room Ri and xGT is
the ground truth area/ aspect ratio for the same.
Table 3 depicts the quantitative evaluation for the estimated layout for different scene dataset and
other applications of Android and iOS. Results show that GRIHA performs best in terms of mean error
% (E) in area and aspect ratio for Class Room dataset and area error for office dataset. For the lab
dataset, ARplan3D performs best in terms of area error and Tape measure in aspect ratio error.
Table 4 depicts the qualitative comparison between the proposed method and other applications.
Here, the number of user interactions and the amount of manual intervention required were considered
Table 2: Corner and edge estimation analysis on our dataset
Scene Corner error (%) Pixel error (%)
Classrooms 1.04 3.38
Labs 1.30 4.15
Offices 1.12 3.67
14Table 3: Quantitative evaluation of the estimated layouts for different scenes(S) and methods(M)
Scene −→ Classrooms Offices Labs
Methods↓ Area (E%) Aspect Ratio (E%) Area (E%) Aspect Ratio (E%) Area (E%) Aspect Ratio (E%)
GRIHA 3.12 2.21 3.25 2.65 5.59 3.07
Magic Plan [5] 4.53 3.34 3.67 1.81 5.52 3.03
Tape Measure [4] 3.55 3.58 8.26 1.71 6.93 1.21
Measure [3] 7.27 4.06 6.65 2.93 6.02 3.07
ARplan 3D [1] 3.15 5.20 4.40 1.62 4.39 2.87
based on the comparison. In terms of user interaction, our method requires only 4 interactions, i.e.,
images of 4 corners of a room, while other applications require a continuous scan and movement in the
entire room. In terms of manual intervention, the proposed method does not require any after clicking
the pictures. Whereas the other apps require manually adding the corners and height of the room. The
proposed method’s only requirement is to click images, while other apps take some time and manual
calibration to understand the environment and features. Due to this continuous scanning and more
manual intervention, techniques like [5] yield more accurate results than ours. However, in the existing
apps, if some object occludes the corner, the user has to add the corner themselves. A slight user error
can heavily affect the accuracy of the layout. The accuracy of the existing apps also suffers in limited
salient features in different scene frames while scanning.
(a) ARplan 3D (b) Magic Plan (c) Tape Measure
Figure 18: Graphical User Interfaces (GUI) for different layout estimation applications.
6.5 Robustness
Figure. 18 shows the screenshots of other publicly available mobile applications while collecting the
dataset for evaluation. Figure. 18(a) is GUI for ARplan 3D, Fig. 18(b) is for Magic Plan, and Fig. 18(c)
is for Tape Measure. There is a lot of manual interruption that requires layout estimation using these
apps. For example, for ARplan 3D and Magic Plan, the rooms’ corners have to be added manually, which
Table 4: Qualitative comparison of GRIHA and state-of-the-art.
Method User Interaction Manual Intervention
GRIHA 4 Nos. Not required
Magic Plan [5] Continuous Scan Add corners
Tape Measure [4] Continuous Scan Add corners
Measure [3] Continuous Scan Add corners
ARplan 3D [1] Continuous Scan Add corners, height
15Figure 19: Scenes captured in different environments.
is a very error-prone process. The person holding the mobile device has to be cautious and accurate
while adding the corners. Otherwise, there will be an error in the measurement of the edges of the room.
Also, Fig. 18(c) shows that if the edges or corners of the room are occluded by furniture or other room
fixtures, measuring the edges with these applications is impossible since the wall edges are invisible and
have to be scanned through the furniture only.
However, in the proposed system GRIHA, these issues have been taken care of making it more robust
than the existing mobile applications. GRIHA, do not require any manual interruption. Hence, the
possibility of introducing any manual error is ruled out. Also, it does not require the mobile device to be
run through all the room edges, making it easy for a user to use and robust in an occluded environment.
The existing applications require some time after their launch and need a manual/automatic calibration of
AR sensors by rotation and device scanning against the plane ground or wall. The automatic calibration
by plane detection becomes difficult or takes longer when the room’s lighting condition is not proper
or there is no difference in the color of the wall or ground. However, this is not a requirement in the
proposed system. The user only requires to click images of the room, making it more robust in different
lighting and interior environments.
Different light conditions and environments affect the quality of images and final results of layout
generation. In state of the art methods, different illuminated environment plays a key role in the
functioning of the method. In poor illumination, different applications discussed in the previous section
are not able to extract visual features. The applications require scanning of the entire scene with camera
and require high contrast, edges and curved surfaces to detect feature points. If the captured images
do not have enough feature points, then different keypoints and features are not detected. In poorly
illuminated images there is a lack of contrast between two portions of a scene. Due to inconsistent indoor
lighting they are not able to capture feature points and do not start functioning. In contrast, the proposed
method GRIHA does not depend upon the illumination or high contrast surfaces in the captured images.
Figure 19 depicts various scenes taken with mobile applications under different environments. Figure
19 (a) is taken with measure, under low illumination, in a smooth surface, which could not be scanned
because keypoints could not be detected. Figure 19 (b) is taken with Magic Plan app in low light and
consistent surface, which could not be scanned because of the same reason. However Fig. 19 (c) is a
part of dataset collected in GRIHA, which is taken in low illumination and has a consistent surface of
smooth walls, and it successfully contributed in the generation of layout.
Figure. 20 and Fig. 21 shows the mean absolute error comparative analysis for area and aspect ratio
across the two devices used. These plots infer the robustness and platform independence of the proposed
system GRIHA. The relative performance of GRIHA is similar for both devices in terms of area error
and aspect ratio error. Figure 22 shows the comparative analysis of power consumption in mAh with a
growing number of query images across devices. It can be seen that Samsung Galaxy A50 is consuming
16Classroom Offices Laboratory
7.27 9.02 7.3
6.89
8.26 6.93
7
8 6.63
7.3
6 6.65
6.02
Error
6
6 5.59 5.59
5.52
4.53
5.3
4.12 4.75
4.02 4.4
4 3.55
3.69 4.2 5 4.83
3.4 4 3.59 3.67
3.12 3.15 3.29 4.39
re
re
re
an
3D
an
3D
an
3D
A
re
A
re
A
re
su
su
su
IH
IH
IH
su
su
su
Pl
Pl
Pl
an
an
an
ea
ea
ea
ea
ea
ea
R
R
R
ic
ic
ic
pl
pl
pl
G
G
G
M
M
M
M
M
M
ag
ag
ag
R
R
R
pe
pe
pe
M
M
M
A
A
A
Ta
Ta
Ta
Google Pixel2 XL Samsung Galaxy A50
Figure 20: Comparative analysis of area error across devices.
more power for the proposed system and less efficient than Google Pixel 2 XL. Energy consumption is
measured in terms of the battery used on each mobile device, which was recorded manually, from the
start of data collection, with each query image collected.
State-of-the-art methods, such as [31], are also used to estimate the room’s entire floor plan. However,
[31] work on the panorama image of the scene. As compared to the proposed approach, [31] requires
more information to generate a layout. GRIHA works with non-overlapping pictures of the room, which
do not have any shared features. Due to the lack of available datasets for partial scene images, we could
not test our method on any publicly available datasets. We tested GRIHA on our dataset and performed
experiments using the other apps under the same experimental condition to ensure fairness. GRIHA can
generate a reasonably accurate layout in terms of the error in area, aspect ratio while requiring far less
user interaction and intervention.
7 Conclusion
In this paper, we propose a technique, GRIHA, to generate room layout or floor plans using RGB
images taken from the mobile phone’s camera and camera pose data given by Google ARcore. Depth
estimation and 3D reconstruction of the scene are done for the RGB images, and image stitching is done
by transformation coordinates given by ARcore, assuming the world to be Manhattan. The estimated
layout agrees well in terms of real-world dimensions. The proposed method works well for cluttered
indoor settings and occluded walls and corners. The technique requires fewer user interactions and no
manual intervention, as compared to other layout generation applications. We will try to estimate the
entire floor’s layout by relaxing the Manhattan world assumption and for a more generalized scene in
future work.
Acknowledgement
This work is partially supported by Science and Engineering Research Board, India under the project
id ECR/2016/000953 and the Natural Sciences and Engineering Research Council of Canada (NSERC)
under grant no. CRDPJ530666-18.
References
[1] AR Plan 3D Ruler – Camera to Plan, Floorplanner.https://arplan-3d.en.aptoide.com/
[2] ARcore, fundamental concepts. https://developers.google.com/ar/discover/concepts
17Classroom Offices Laboratory
5.7 3.1 3.58
3.43 3.43
5.2 3 2.9 2.93
3.07 3.03 3.07
5 2.65
3
3.01
2.87
4.4
2.5
Error
4.06
4
3.58
3.4
3.34 3.42
2 1.81
1.93 2
3 1.7 1.71 1.58
2.5 1.62
2.21 1.45 1.21
1.5
re
re
re
an
3D
an
3D
an
3D
A
re
A
re
A
re
su
su
su
IH
IH
IH
su
su
su
Pl
Pl
Pl
an
an
an
ea
ea
ea
ea
ea
ea
R
R
R
ic
ic
ic
pl
pl
pl
G
G
G
M
M
M
M
M
M
ag
ag
ag
R
R
R
pe
pe
pe
M
M
M
A
A
A
Ta
Ta
Ta
Google Pixel2 XL Samsung Galaxy A50
Figure 21: Comparison of aspect ratio error across devices.
[3] Google Measure App. https://developer.android.com/
[4] Occipital. The fastest way to measure (iOS application).https://tapmeasure.io/
[5] Sensopia. MagicPlan. https://www.magicplan.app/magicplan/
[6] Alhashim, I., Wonka, P.: High quality monocular depth estimation via transfer learning. arX-
ivpreprint arXiv:1812.11941 (2018)
[7] Angladon, V.: Room layout estimation on mobile devices. Ph.D. thesis, University of Toulouse(2018)
[8] Arduengo, M., Torras, C., Sentis, L.: Robust and adaptive door operation with a mobile manipulator
robot (2019)
[9] Bao, S.Y., Furlan, A., Fei-Fei, L., Savarese, S.: Understanding the 3d layout of a cluttered roomfrom
multiple images. In: WACV, pp. 690–697. IEEE (2014)
[10] Cabral, R., Furukawa, Y.: Piecewise planar and compact floorplan reconstruction from images.
In:CVPR, pp. 628–635. IEEE (2014)
400
mAh
Google Pixel2 XL
200
Samsung Galaxy A50
0
5 10 15 20
Query Images
Figure 22: Comparison of power consumption across devices.
18[11] Chelani, K., Sidhartha, C., Govindu, V.M.: Towards automated floorplan generation (2018)
[12] Chen, S., Li, M., Ren, K., Qiao, C.: Crowd map: Accurate reconstruction of indoor floor plans-
from crowdsourced sensor-rich videos. In: 2015 IEEE 35th International conference on distributed
computing systems, pp. 1–10. IEEE (2015)
[13] Dasgupta, S., Fang, K., Chen, K., Savarese, S.: Delay: Robust spatial layout estimation for cluttered
indoor scenes. In: CVPR, pp. 616–624 (2016)
[14] Dong, Jiang and Xiao, Yu and Noreikis, Marius and Ou, Zhonghong and Y J, Antti,: Using smart-
phones for image-based indoor navigation. In: Proceedings of the 13th ACM Conference on Embed-
ded Networked Sensor Systems, pp. 85–97 (2015)
[15] Dutta, A., Zisserman, A.: The VIA annotation software for images, audio and video. In: Proceed-
ings of the 27th ACM International Conference on Multimedia, MM ’19. ACM, New York, NY,
USA(2019). DOI 10.1145/3343031.3350535. URLhttps://doi.org/10.1145/3343031.3350535
[16] Fernandez-Labrador, C., Perez-Yus, A., Lopez-Nicolas, G., Guerrero, J.J.: Layouts from
panoramic images with geometry and deep learning. IEEE Robotics and Automation Letters3(4),
3153–3160(2018)
[17] Furlan, A., Miller, S.D., Sorrenti, D.G., Li, F.F., Savarese, S.: Free your camera: 3d indoor scene
understanding from arbitrary camera motion. In: BMVC (2013)
[18] Hsiao, C.W., Sun, C., Sun, M., Chen, H.T.: Flat2layout: Flat representation for estimating layoutof
general room types. arXiv preprint arXiv:1905.12571 (2019)
[19] Lin, C., Li, C., Furukawa, Y., Wang, W.: Floorplan priors for joint camera pose and room layout
estimation. arXiv preprint arXiv:1812.06677 (2018)
[20] Liu, C., Schwing, A.G., Kundu, K., Urtasun, R., Fidler, S.: Rent3d: Floor-plan priors for monocular
layout estimation. In: CVPR, pp. 3413–3421 (2015)
[21] Murali, S., Speciale, P., Oswald, M.R., Pollefeys, M.: Indoor scan2bim: Building information mod-
elsof house interiors. In: 2017 IEEE/RSJ International Conference on Intelligent Robots and Sys-
tems(IROS), pp. 6126–6133. IEEE (2017)
[22] Murez, Z., van As, T., Bartolozzi, J., Sinha, A., Badrinarayanan, V., Rabinovich, A.: Atlas: End-
to-end 3d scene reconstruction from posed images. arXiv preprint arXiv:2003.10432 (2020)
[23] Okorn, B., Xiong, X., Akinci, B., Huber, D.: Toward automated modeling of floor plans.
In:Proceedings of the symposium on 3D data processing, visualization and transmission, vol. 2
(2010)
[24] Phalak, A., Badrinarayanan, V., Rabinovich, A.: Scan2plan: Efficient floorplan generation from
3dscans of indoor scenes. arXiv preprint arXiv:2003.07356 (2020)
[25] Sun, C., Hsiao, C.W., Sun, M., Chen, H.T.: Horizonnet: Learning room layout with 1d representa-
tion and pano stretch data augmentation. In: CVPR, pp. 1047–1056 (2019
[26] Turner, E., Zakhor, A.: Floor plan generation and room labeling of indoor environments from-
laser range data. In: 2014 international conference on computer graphics theory and applica-
tions(GRAPP), pp. 1–12. IEEE (2014)
[27] Xu, J., Stenger, B., Kerola, T., Tung, T.: Pano2cad: Room layout from a single panorama image.In:
WACV, pp. 354–362. IEEE (2017)
[28] Zhang, J., Kan, C., Schwing, A.G., Urtasun, R.: Estimating the 3d layout of indoor scenes and its
clutter from depth sensors. In: ICCV, pp. 1273–1280 (2013)
[29] Zhang, W., Zhang, W., Gu, J.: Edge-semantic learning strategy for layout estimation in indooren-
vironment. IEEE-T on cybernetics (2019)
[30] Zhang, Y., Song, S., Tan, P., Xiao, J.: Panocontext: A whole-room 3d context model for panoramic
scene understanding. In: ECCV, pp. 668–686. Springer (2014)
[31] Zou, C., Colburn, A., Shan, Q., Hoiem, D.: Layoutnet: Reconstructing the 3d room layout from
asingle rgb image. In: CVPR, pp. 2051–2059 (2018)
19You can also read