Structures of the Skin Microbiome and Mycobiome Depending on Skin Sensitivity - MDPI
←
→
Page content transcription
If your browser does not render page correctly, please read the page content below
microorganisms
Article
Structures of the Skin Microbiome and Mycobiome
Depending on Skin Sensitivity
Hye Lim Keum 1,† , Hanbyul Kim 2,† , Hye-Jin Kim 1 , Taehun Park 2 , Seoyung Kim 2 ,
Susun An 2, * and Woo Jun Sul 1, *
 1   Department of Systems Biotechnology, Chung-Ang University, Anseong 17546, Korea;
     hyelim0904@gmail.com (H.L.K.); hjinkim327@gmail.com (H.-J.K.)
 2   Safety and Microbiology Lab, Amorepacific Corporation R&D Center, Yongin 17074, Korea;
     id1star@amorepacific.com (H.K.); huny802@amorepacific.com (T.P.); sy1414@amorepacific.com (S.K.)
 *   Correspondence: ssan@amorepacific.com (S.A.); sulwj@cau.ac.kr (W.J.S.);
     Tel.: +82-31-280-5851 (S.A.); +82-31-670-4707 (W.J.S.)
 †   These authors contributed equally to this work.

 Received: 12 June 2020; Accepted: 9 July 2020; Published: 12 July 2020

 Abstract: Sensitive skin (SS) syndrome is a globally widespread, self-diagnosed discomfort
 characterized by subjective complaints. Although the skin microbiome is considered important
 in skin health, the relationship between the skin microbiome and skin sensitivity is still unknown.
 Here, we aimed to (i) investigate whether the microbiome and mycobiome of SS are distinct from
 those of non-sensitive skin (NS), and (ii) define the characteristics of the skin microbiome associated
 with skin sensitivity. A total of 42 Korean women subjects were recruited (SS, n = 23; NS, n = 19)
 and the microbiome/mycobiome of their right facial cheeks were analyzed. We identified the
 differential microbiome and mycobiome structures between SS and NS. The mycobiome of SS was
 more phylogenetically diverse than that of NS. Lactobacillus and Mucor racemosus were more abundant
 on SS than NS, whereas Malassezia restricta was less abundant. Interestingly, both skin microbiome and
 mycobiome varied according to the perceived skin sensitivities of the subjects. This study suggests
 that the skin microbiome and mycobiome are associated with skin sensitivity. Accordingly, it lays the
 foundation for developing microbiome-based cosmetics or remedies for individuals suffering from
 SS syndrome.

 Keywords: sensitive skin; microbiome; mycobiome; perceived skin sensitivity

1. Introduction
      The sensitive skin (SS) syndrome, characterized by abnormal and unpleasant sensations, such as
burning, stinging, and itching, manifests as exaggerated responses to stimuli [1]. Chemicals in
cosmetics, sun exposure, and seasonal changes, which generally do not provoke irritation, can act as
irritants for SS. Such a hyper-reaction can occur in seemingly healthy skin although it is sometimes
accompanied by erythema [1,2]. The causes of this syndrome have been attributed to various
factors [3,4]. Ponts-Giraud has described three forms of the SS: (i) high sensitivity to endogenous or
exogenous factors; (ii) sensitivity to environmental factors; (iii) sensitivity to cosmetics [5]. Although
skin sensitivity is not classified as a dermatological disease, it affects the well-being of many people.
Studies have shown that approximately half of the world population claims to suffer from this
syndrome [6–9].
      Although SS is a subjective skin condition, there are several methods to determine whether a
person has SS, such as sting tests using lactic acid, skin irritation tests using chemicals, and diagnosis
with self-reported scales [2,9]. Sensory skin irritation, identified by the lactic acid sting test (LAST),

Microorganisms 2020, 8, 1032; doi:10.3390/microorganisms8071032           www.mdpi.com/journal/microorganisms
Microorganisms 2020, 8, 1032                                                                     2 of 12

can explain chemically induced burning, stinging, or itching sensation of SS [10]. Furthermore,
patch tests on SS are more likely to respond to allergens than those on non-sensitive skin (NS) [11].
Despite extensive research on the physiological properties and etiology of SS, there is currently no
precise treatment strategy. Furthermore, various exogenous and endogenous factors necessitate
personalized treatment strategies [12].
     Extensive research centered on the involvement of the skin microbiome in skin health has
been conducted to target various skin conditions, such as atopic dermatitis, psoriasis, acne vulgaris,
seborrheic dermatitis, and rosacea [13–15]. However, the microbial community of SS has been
poorly investigated [16,17]. Accordingly, we here assessed for a correlation between the skin
microbiome/mycobiome and skin sensitivity.
     We recruited 42 Korean women and divided them into SS (n = 23) and NS (n = 19) groups
based on the results of the 0.3% sodium lauryl sulfate (SLS) patch tests and 5% LASTs along with the
information collected via a sensitivity questionnaire [18]. To investigate the correlation between the
skin microbiome/mycobiome and skin sensitivity, we analyzed the bacterial and fungal communities
of the facial skins (right cheek) of these subjects.

2. Materials and Methods

2.1. Subject Recruitment and Sample Preparation
      All the 42 Korean women aged 22–52 years, except those with chronic skin diseases, were recruited
between November and December 2017. They were divided into two skin groups, SS (n = 23) and
NS (n = 19), by the following criteria: the subjects were considered to have SS if they had skin
irritation scores >1.0 from 0.3% SLS patch test, skin sensory scores >0.4 from 5% LAST, and sensitivity
questionnaire scores ≥2 [18] (Table S1); the remaining subjects were considered to have NS. The SLS
patch test was performed on the upper back and LAST was performed on the right cheek of the face.
The sensitivity questionnaire included questions that fall into the categories of basic information,
skin type/problems, recognition of skin sensitivity, and quality of life (Table S2). All the subjects
expressed their perceived skin sensitivity (PS) on a scale from 1 to 7. Additionally, the SS group was
subjected to a survey about the causes and symptoms of SS. For the collection of microbiological
samples, the subjects told not to engage in facial cleansing or use any cosmetics within 24 h before
the sampling. For all subjects, sampling was conducted from a 4 cm2 area of the right cheek by
using Catch-All sample collection swabs (Epicentre, Madison, WI, USA). With the temperature and
humidity controlled at 22 (±2) ◦ C and 50% (±10%), respectively, the right cheek of the face was
swabbed approximately 50 times for ≥1 min. The collected swabs were stored at −80 ◦ C until used for
genomic DNA (gDNA) extraction. All the subjects gave their informed consent for inclusion before
they participated in the study, and the study protocol was approved by the Institutional Review Board
(2018-1SR-N067R).

2.2. Assessment of Skin Parameters
     After collecting the microbial samples, the subjects washed the face and waited 30 min. Then,
skin parameters were measured from the area on the left cheek that was the mirror image of the
sampling site on the right cheek. Skin hydration was assessed using Corneometer® CM 825 (Courage +
Khazaka Electronic GmbH, Cologne, Germany) and expressed in arbitrary units. The sebum level was
measured using Sebumeter® SM 815 (Courage + Khazaka Electronic GmbH, Cologne, Germany) and
expressed as a unique value of the device. Skin elasticity was evaluated using Cutometer® (Courage
+ Khazaka Electronic GmbH, Cologne, Germany). Wrinkles and melanin level were assessed using
Antera 3D® Pro (Miravex Limited, Dublin, Ireland) and expressed in pixels.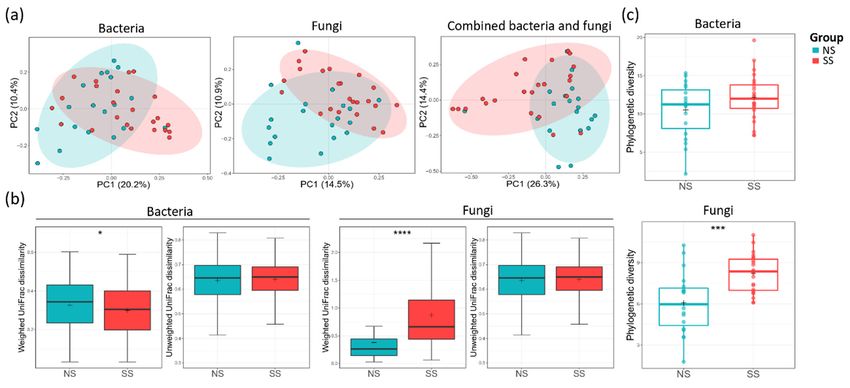
Microorganisms 2020, 8, 1032                                                                          3 of 12

2.3. Bacterial and Fungal gDNA Extraction
      Bacterial and fungal gDNA extraction was simultaneously conducted from each swab by following
the gram-positive bacterial cell lysate protocol of the PureLink™ Genomic DNA Mini Kit (Invitrogen,
Carlsbad, CA, USA) with a bead-beating step to break down the fungal cell wall. Briefly, the head of
each swab sample was excised and then transferred to a 1.5 mL screw-capped tube. Then, 400 µL of
digestion buffer (20 mM Tris-HCl, pH 8.0, 2 mM EDTA, and 1.2% Triton X-100) containing lysozyme
(20 mg/mL) was added. After incubating at 37 ◦ C for 60 min, 45 µL of proteinase K (20 mg/mL) and
445 µL of PureLink™ genomic lysis/binding buffer were added. Bead-beating was performed using
Mini-Beadbeater-16 (BioSpec Products, Bartlesville, OK, USA) with two 5-mm stainless steel beads
(QIAGEN, Germantown, MD, USA) per tube for 1 min. The tubes were consecutively incubated on
ice, at room temperature, and at 55 ◦ C for 10, 10, and 30 min, respectively. Afterward, 445 µL of 100%
ethanol was added per tube, and the samples were vigorously mixed by vortexing. Subsequent steps
followed the purification protocol of the kit. Finally, extracted bacterial and fungal gDNA was eluted
with 30 µL PureLink™ genomic elution buffer per tube and stored at −20 ◦ C until use.

2.4. Next-Generation Sequencing of 16S rRNA Genes and ITS1 Regions
      The V4–V5 regions of bacterial 16S rRNA genes were amplified using PCR with primers 518F
and 927R. The primer sequences were as follows: 518F (50 -CCAGCAGCYGCGGTAAN-30 ) and 927R
(50 -CCGTCAATTCNTTTRAGT-30 ). The fungal ITS1 regions were likewise PCR-amplified using primers
18S-F (50 -GTAAAAGTCGTAACAAGGTTTC-30 ) and 5.8S-1R (50 -GTTCAAAGAYTCGATGATTCAC-30 ).
The following thermal cycling conditions were used: initial denaturation at 95 ◦ C for 3 min; then 33 cycles
of 95 ◦ C for 30 s, 55 ◦ C for 30 s, and 72 ◦ C for 5 min; followed by a final extension at 72 ◦ C for 5 min.
The PCR products were purified using AMPure XP beads (Beckman Coulter Ltd., Wycombe, UK).
Indexing PCR was performed to barcode each sample using i7 and i5 index adapters of the Illumina
Nextera XT Index Kit v. 2. The thermal cycling conditions were as described above, except that
only eight amplification cycles were performed. The products were purified, as indicated above.
Paired-end sequencing (2 × 300 bp) was performed by Macrogen Inc. (Seoul, Korea) by using the
Illumina MiSeq platform. The Illumina sequencing data were uploaded to the National Center
for Biotechnology Information (NCBI) Sequence Read Archive (SRA) database under the SRA and
BioProject accession numbers SRR11605054–SRR11605095 and PRJNA627788 for the microbiome data,
respectively, and SRR11604870–SRR11604911 and PRJNA627798 for the mycobiome data.

2.5. Analysis of the Skin Microbiome and Mycobiome
     Skin microbiome sequences were processed using the plugins of the QIIME™ 2 (Quantitative
Insights Into Microbial Ecology) pipeline 2018.11.0 [19]. Primer sequences were removed from the
bacterial sequences by using Cutadapt 1.18 [20] with the default settings. Reads that contained no
bacterial primer sequence or a poor-quality primer sequence (i.e., error rate >10%) were eliminated
at this step. Paired-end sequence reads were merged, and the combined reads were trimmed based
on Q-score 20 by using VSEARCH [21] and the quality-filter [22] plugin. The remaining sequences
were denoised using a 370 trim length via the deblur [23] plugin, whereby bacterial amplicon sequence
variants (ASVs) were identified. The 99% Greengenes database was used to assign bacterial taxonomy
by using the feature-classifier classify-sklearn [24] plugin, and mitochondrial or chloroplastic ASVs
were eliminated. The ASVs were aligned using the phylogeny align-to-tree-mafft-fasttree plugin,
and α-diversity (shannon, Faith’s phylogenetic diversity (PD), Pielou’s evenness) and β-diversity were
determined with a rarefied depth of 2123 reads per sample by using the diversity plugin.
     Fungal sequence reads were merged and trimmed using the ITSxpress [25] plugin with ITS1
region parameters after removing the primer sequences through the same method used for the bacterial
sequences. The remaining sequences were denoised using a 180-trim length via the deblur plugin,
whereby fungal ASVs were identified. The taxonomic assignment was conducted using the 99% UNITE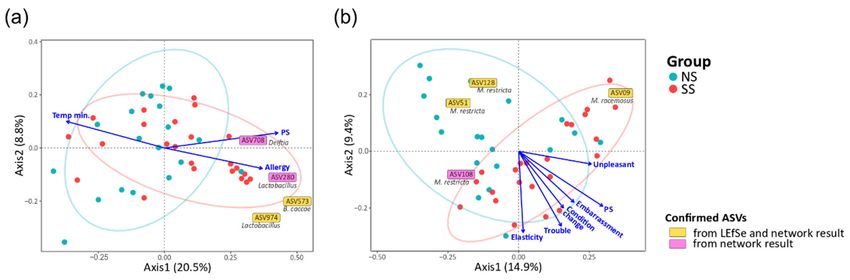
Microorganisms 2020, 8, 1032                                                                          4 of 12

database. Using the same methods described above, ASV alignment was conducted, and diversities
were determined with a rarefied depth of 2478 reads per sample. QIIME2 default parameters were
used, except for the values described above.

2.6. Microbial Network Analysis
     To construct the microbial networks of the two skin groups, we selected bacterial and fungal ASVs
with frequencies ≥50% and excluded those with an abundance of zero in each group. We selected
106 ASVs in the NS group (99 bacterial and seven fungal ASVs) and 112 ASVs in the SS group (105
bacterial and seven fungal ASVs) for further analysis. The microbial networks were estimated using
the “SParse InversE Covariance estimation for Ecological Association Inference” (SpiecEasi) package
and visualized with the igraph package in R.

2.7. Statistical Analysis
     Spearman’s rank correlation coefficient was calculated to determine the correlations among the skin
parameters and PS by using the Hmisc package in R. Analysis of similarity (ANOSIM) was conducted
to identify the factors that differentiate the microbial community. The Wilcoxon rank-sum test, or t-test,
was performed to determine whether the UniFrac dissimilarities, alpha diversities, and taxonomies
of the two skin groups (SS and NS) were significantly different. To identify the significant gradient
factors influencing or associated with the community structure of the skin microbiome and mycobiome,
the factors of metadata were fitted to the ordinated space based on unweighted UniFrac dissimilarity
by using the envfit function of vegan in R with 999 permutations. Linear discriminant analysis (LDA)
Effect Size (LEfSe) analysis was conducted with an LDA score ≥3.0 to identify the significant ASVs in
each group.

3. Results

3.1. The Skin Characteristics of the Subjects
      The 42 women subjects were divided into SS (n = 23) and NS (n = 19) groups according to the skin
irritation, skin sensory, and sensitivity questionnaire scores, as described in Table S1. The mean age of
the subjects was 35.0 years (±8.6 years), and there was no significant difference in mean age between
the SS (32.6 ± 8.2 years) and NS (37.8 ± 8.3 years) groups (Table 1, point a). The indices of the subjective
questionnaire evaluations showed that PS (expressed on a scale from 1 to 7) was significantly higher
(p < 0.001) on SS than on NS (Table 1, point b). However, no significant difference was observed in any
of the assessed skin parameters between the two groups (Table 1, point c).

3.2. Comparison of the Microbiome and Mycobiome of SS and NS
     We obtained a mean of 20,728 (microbiome) and 39,266 (mycobiome) sequence reads for the
community analysis (Table S3). After denoising using deblur, 1210 and 342 unique bacterial and fungal
ASVs were identified, respectively.
     Principal coordinate analysis (PCoA) plot based on unweighted UniFrac dissimilarity revealed
that both bacterial (ANOSIM, R = 0.083, p = 0.020) and fungal (ANOSIM, R = 0.112, p = 0.006)
communities were segregated between the two skin groups (Figure 1a). However, when weighted
UniFrac dissimilarity was used, segregation was observed only in the fungal community (ANOSIM,
R = 0.079, p = 0.027) (Figure S1a). The skin group was the major factor differentiating SS from
NS in both microbiome and mycobiome. PS was another factor differentially affecting the fungal
community (ANOSIM, R = 0.13, p = 0.016). Age group (20–30 s and 40–50 s) or perceived skin type
(dry, combination, normal, or oily skin) did not have statistically significant effects in distinguishing
the two skin groups in microbiome or mycobiome (Table S4). The weighted UniFrac dissimilarity of
the fungal community was increased in the SS group, whereas the value of the bacterial community
was decreased (Figure 1b). From these results, we found that the fungal community varied more
Microorganisms 2020, 8, x FOR PEER REVIEW 5 of 12
c. Skin Parameters (SD)
Hydration 47.43 (16.80) 46.55 (16.51) 48.16 (17.37)
Microorganisms 2020, 8, 1032 5 of 12
Sebum 17.37 (18.60) 19.68 (22.74) 15.46 (14.60)
Melanin 0.54 (0.060) 0.56 (0.049) 0.53 (0.067)
among the subjects
Maximum in Temperature
the SS group than among those in the NS group,
36.49 (0.45) 36.52but, conversely,
(0.52) 36.46the bacterial
(0.39)
community Minimum Temperature
was more similar. 28.43
For both bacterial and (2.57)communities,
fungal 28.07 alpha
(2.87) diversity
28.75tended
(2.30) to be
higher on SS Average
than on NS Temperature 34.20 (0.94)
(Figure 1c, Figure S1b). Faith’s 34.28community
PD of the fungal (0.94) 34.13significantly
was (0.95)
higher on SS Elasticity
than on NS (skin touch)
(t-test, p < 0.001), suggesting
69.93 (12.26) 67.53 (12.17)
that SS mycobiome 71.91 (12.24)more
was phylogenetically
diverseData
thanarethat of NS. as mean values (SD, standard deviation) or count (%, the percentage in each
presented
group). Statistical analyses were conducted to determine the significance of the differences between
the sensitive skin (SS) andTable 1. The skin
non-sensitive characteristics
(NS) groups for allof the
the subjects. and quantitative values.
information
The statistical significance of the differences between the skin groups is indicated by ns > 0.05 and ***
Variable Overall (n = 42) NS (n = 19) SS (n = 23)
p ≤ 0.001.
a. Basic Information
Mean age (SD) 35.0 (8.6) 37.8 (8.3) 32.6 (8.2)
3.2. Comparisonb.ofSubjective
the Microbiome and Mycobiome of SS and NS
Information
Perceived Skin Type (%)
We obtained a mean Dry of 20,728 (microbiome)
15 (35.7%)and 39,2666 (31.6%)
(mycobiome) sequence9 (39.1%) reads for the
community analysisCombination
(Table S3). After denoising using deblur,
17 (40.5%) 1210 and 34210unique
7 (36.8%) (43.5%) bacterial and
Normal 7 (16.7%) 4 (21.1%) 3 (13.0%)
fungal ASVs were identified, respectively.
Oily 3 (7.1%) 2 (10.5%) 1 (4.3%)
PrincipalPerceived
coordinate analysis (%)
Skin Sensitivity (PCoA) plot based on unweighted UniFrac dissimilarity revealed
that both bacterial (ANOSIM,
Level 1 R = 0.083, p 2=(4.8%)
0.020) and fungal
2 (10.5%) (ANOSIM, R 0= 0.112, p = 0.006)
Level 2 4 (9.5%)
communities were segregated between the two skin groups 4(Figure
(21.1%)
1a). However, 0
when weighted
Level 3 6 (14.3%) 5 (26.3%) 1 (4.3%)
UniFrac dissimilarity was used,
Level 4 segregation was observed
9 (21.4%) only in
7 (36.8%)the fungal community
2 (8.7%) (ANOSIM,
Level 5 12 (28.6%) 1 (5.3%) 11
R = 0.079, p = 0.027) (Figure S1a). The skin group was the major factor differentiating SS from NS in (47.8%)
Level 6 7 (16.7%) 0 7 (30.4%)
both microbiome and mycobiome. PS was
Level 7
another factor 0differentially 2affecting
2 (4.8%) (8.7%)
the fungal
community (ANOSIM, MeanR(SD) = 0.13,
*** p = 0.016). Age group (20–30
4.29 (1.52) s and
3.05 (1.13)40–50 s) 5.30
or perceived
(0.93) skin type
(dry, combination,c. Skin Parameters
normal, (SD) skin) did not have statistically significant effects in distinguishing
or oily
Hydration 47.43 (16.80) 46.55 (16.51) 48.16 (17.37)
the two skin groups inSebum microbiome or mycobiome (Table S4).
17.37 (18.60)
The weighted UniFrac
19.68 (22.74) 15.46 (14.60)
dissimilarity of
the fungal communityMelanin was increased in the 0.54 SS group,
(0.060) whereas0.56the value of the
(0.049) 0.53bacterial
(0.067) community
was decreased Maximum
(Figure 1b).Temperature 36.49 (0.45)
From these results, we found that36.52the(0.52) 36.46 (0.39) varied more
fungal community
Minimum Temperature 28.43 (2.57) 28.07 (2.87) 28.75 (2.30)
among the subjects in the
Average SS group than among
Temperature those in the 34.28
34.20 (0.94) NS group,
(0.94) but, conversely,
34.13 (0.95) the bacterial
community was Elasticity
more similar. For both bacterial
(skin touch) and fungal67.53
69.93 (12.26) communities,
(12.17) alpha diversity tended to
71.91 (12.24)
beData
higher on SS than
are presented onvalues
as mean NS (Figure 1c, Figure
(SD, standard S1b).
deviation) Faith’s
or count PD
(%, the of the fungal
percentage community
in each group). was
Statistical
analyses were conducted to determine the significance of the differences between the
significantly higher on SS than on NS (t-test, p < 0.001), suggesting that SS mycobiome was sensitive skin (SS) and
non-sensitive (NS) groups for all the information and quantitative values. The statistical significance of the
phylogenetically more diverse than that of NS.
differences between the skin groups is indicated by ns > 0.05 and *** p ≤ 0.001.
Figure Bacterial
1. 1.
Figure Bacterialand
andfungal
fungalcommunities
communities ofof the
the two skin groups. (a)
skin groups. (a)The
Thebacterial
bacterial(analysis
(analysis
of of
similarity (ANOSIM),
similarity (ANOSIM), p=p =0.002)
0.002)and
andfungal (ANOSIM, p ==0.006)
fungal (ANOSIM, 0.006)principal
principalcoordinate
coordinate analysis
analysis (PCoA)
(PCoA)
plots by unweighted UniFrac distance and combined bacterial/fungal PCoA by Bray–Curtis distance
(ANOSIM, p = 0.001). (b) The UniFrac dissimilarity in the bacterial and fungal communities calculated
within each skin group. (c) The alpha diversities of the bacterial and fungal communities by using
Faith’s PD index. The statistical significance of the differences between the skin groups is indicated by
ns > 0.05, * p ≤ 0.05, *** p ≤ 0.001, and **** p ≤ 0.0001.plots by unweighted UniFrac distance and combined bacterial/fungal PCoA by Bray–Curtis distance
(ANOSIM, p = 0.001). (b) The UniFrac dissimilarity in the bacterial and fungal communities calculated
within each skin group. (c) The alpha diversities of the bacterial and fungal communities by using
Faith’s PD index. The statistical significance of the differences between the skin groups is indicated
by ns > 0.05,
Microorganisms ≤ 0.05, *** p ≤ 0.001, and **** p ≤ 0.0001.
2020,*8,p 1032 6 of 12
3.3. The Difference in Taxonomic Compostition Between SS and NS
3.3. The Difference in Taxonomic Compostition Between SS and NS
A total of 23 phyla and 322 genera were found in the bacterial communities. Although the
A totalcomposition
taxonomic of 23 phylavaried
and 322 genera were
depending on thefound in the
subjects, the bacterial
followingcommunities. Although
four phyla occupied ≥90%theof
taxonomic composition varied depending on the subjects, the following four phyla occupied
the skin microbiome across all the samples: Actinobacteria (39.6%), Proteobacteria (35.5%), Firmicutes ≥90% of
the skin microbiome
(13.8%), across all(4.8%).
and Bacteroidetes the samples:
At theActinobacteria
genus level, (39.6%), Proteobacteria
Cutibacterium (36.32%)(35.5%), Firmicutes
and unidentified
(13.8%), and Bacteroidetes
Neisseriaceae (10.36%) were (4.8%).
the mostAt the genus
abundant bacterial Cutibacterium
level, genera, followed (36.32%) and unidentified
by Staphylococcus (4.40%)
Neisseriaceae (10.36%) were the most abundant bacterial genera, followed
and Delftia (3.44%). We observed a lower proportion of Actinobacteria, Proteobacteria, by Staphylococcus (4.40%)
and
and Delftia (3.44%).
Bacteroidetes, but aWe observed
higher a lower proportion
proportion of Actinobacteria,
of Firmicutes, on SS compared Proteobacteria, and Bacteroidetes,
to NS. Lactobacillus belonging
but a higher proportion
to Firmicutes of Firmicutes,
was significantly moreonabundant
SS compared on toSSNS. Lactobacillus
(Figure 2a andbelonging to Firmicutes
Table S5). was
In the fungal
significantly more abundant on SS (Figure 2a and Table S5). In the fungal communities,
communities, seven phyla and 112 genera were identified in total. Basidiomycota (83.75%) was the seven phyla
and 112 genera
predominant were identified
phylum, followed in bytotal. Basidiomycota
Ascomycota (8.38%) (83.75%) was the predominant
and Mucoromycota phylum,
(7.57%). Although
followed by Ascomycota (8.38%) and Mucoromycota (7.57%). Although Malassezia
Malassezia (80.38%) of the Basidiomycota phylum was the predominant fungal genus in theofskin (80.38%) the
Basidiomycota
mycobiome of all phylum was theitpredominant
the subjects, fungal
was significantly lessgenus in theon
abundant skin
SSmycobiome of all
(71.61%) than on the
NS subjects,
(91.0%).
it was significantly
Conversely, lessfungal
the Mucor abundant
genus onofSSthe
(71.61%) than on NS
Mucoromycota (91.0%).
phylum wasConversely, the Mucor
more abundant fungal
on SS (Figure
genus of the Mucoromycota
2b and Table S6). phylum was more abundant on SS (Figure 2b and Table S6).
Figure 2. Genus
Genuslevel
leveltaxonomic
taxonomic compositions
compositions of the bacterial
of the andand
bacterial fungal communities
fungal communitieson theonskin.
the
The relative abundances of the (a) top 11 bacteria and (b) top 10 fungi in all the skin
skin. The relative abundances of the (a) top 11 bacteria and (b) top 10 fungi in all the skin samples. samples. (c) The
genera
(c) with significantly
The genera different
with significantly relative
different abundances
relative abundances between
between thethetwo
twoskin
skin groups.
groups. Detailed
information about
about the
therelative
relativeabundances
abundancesand andphylum
phylum levels areare
levels provided
providedin Tables S5 and
in Tables S6. The
S5 and S6.
statistical
The significance
statistical of the
significance differences
of the differencesbetween
between the
theskin
skingroups
groupsisisindicated
indicatedby ns >> 0.05,
by ns 0.05, * p ≤
≤ 0.05,
and *** p ≤≤ 0.001.
0.001.
There were no significant differences
differences in
in the
the ratio of Cutibacterium
ratio of Cutibacterium to Staphylococcus or Malassezia
globosa to Malassezia restricta
restricta between
between the
the two
two skin
skin groups
groups (Figure
(Figure 3a).
3a). At the species level, M. restricta
was much less abundant on SS than on NS, but but Mucor
Mucor racemosus
racemosus belonging to the Mucor genus was
more abundant (Figure
(Figure 3b3b and
and Figure
Figure S2).
S2).Microorganisms 2020, 8, 1032 7 of 12
Microorganisms 2020, 8, x FOR PEER REVIEW 7 of 12
Figure
Figure 3. Proportions of
3. Proportions of the
the major
major bacterial
bacterial genera
genera (Cutibacterium
(Cutibacterium and and Staphylococcus)
Staphylococcus) and
and fungal
fungal
species globosa M. restricta) on the skin. (a) The ratio of Cutibacterium to Staphylococcus
species (M. globosa and M. restricta) on the skin. (a) The ratio of Cutibacterium to Staphylococcus (log
(M. and (log22
scaled
scaled relative
relative abundance)
abundance) and and that of M.
that of M. globosa to M.
globosa to M. restricta
restricta (relative
(relative abundance).
abundance). (b)
(b) Boxplots
Boxplots of
of
the
the relative
relative abundances
abundances of of the
the bacterial genera Cutibacterium
bacterial genera Cutibacterium andand Staphylococcus,
Staphylococcus, and
and fungal
fungal species
species
M.
M. globosa and M.
globosa and M. restricta. The statistical
restricta. The significance of
statistical significance of the
the differences
differences between
between the
the skin
skin groups
groups is
is
indicated by ns > 0.05 and ** p ≤
indicated by ns > 0.05 and ** p ≤ 0.01.0.01.
According to the LEfSe analysis results, 22 and 23 bacterial ASVs were significantly abundant
According to the LEfSe analysis results, 22 and 23 bacterial ASVs were significantly abundant
on SS and NS, respectively (Figure S3). As with the results of the taxonomic composition described
on SS and NS, respectively (Figure S3). As with the results of the taxonomic composition described
above, Firmicutes was significantly more abundant on SS. Deinococcus-Thermus and Verrucomicrobia
above, Firmicutes was significantly more abundant on SS. Deinococcus-Thermus and
phyla were significantly abundant only on SS. In the mycobiome, only the ASVs assigned to Malassezia
Verrucomicrobia phyla were significantly abundant only on SS. In the mycobiome, only the ASVs
spp. were found to be significantly more abundant on NS than on SS. However, the ASVs assigned to
assigned to Malassezia spp. were found to be significantly more abundant on NS than on SS. However,
M. racemosus and Phanerochaete and those assigned to the Pezizales order of the Ascomycota phylum
the ASVs assigned to M. racemosus and Phanerochaete and those assigned to the Pezizales order of the
were more abundant on SS than on NS (Figure S4).
Ascomycota phylum were more abundant on SS than on NS (Figure S4).
3.4. SS-Specific Microbial Network
3.4. SS-Specific Microbial Network
The microbial networks were constructed to identify the bacterial and/or fungal interactions by
The microbial networks were constructed to identify the bacterial and/or fungal interactions by
using the combined dataset pertaining to the microbiome and mycobiome (Figure 4). The overall
using the combined dataset pertaining to the microbiome and mycobiome (Figure 4). The overall
structures of the networks noticeably differed between SS and NS. The edge density (D) of the
structures of the networks noticeably differed between SS and NS. The edge density (D) of the
network was higher in the SS than in the NS group, but the transitivity (T), or clustering coefficient,
network was higher in the SS than in the NS group, but the transitivity (T), or clustering coefficient,
was substantially lower. Whereas most of the nodes in the SS microbial network participated in the
was substantially lower. Whereas most of the nodes in the SS microbial network participated in the
interactions as one massive cluster, the NS microbial network was composed of multiple clusters,
interactions as one massive cluster, the NS microbial network was composed of multiple clusters,
including a complex major cluster.
including a complex major cluster.
We also found that the main microbial interactions were different between the two skin groups
We also found that the main microbial interactions were different between the two skin groups
(Figure 4). On NS, NS-abundant M. restricta (ASV108) was in negative interactions with two Lactobacillus
(Figure 4). On NS, NS-abundant M. restricta (ASV108) was in negative interactions with two
ASVs (ASV974 and ASV280) and the ASV of the Chlorobi phylum (ASV855). However, in the SS group,
Lactobacillus ASVs (ASV974 and ASV280) and the ASV of the Chlorobi phylum (ASV855). However,
Delftia (ASV708), Bacteroides caccae (ASV573), and the ASV of Verrucomicrobia (ASV823) replaced the
in the SS group, Delftia (ASV708), Bacteroides caccae (ASV573), and the ASV of Verrucomicrobia
negative interactions with M. restricta (ASV108). Additionally, on SS, Cutibacterium acnes (ASV86) had
(ASV823) replaced the negative interactions with M. restricta (ASV108). Additionally, on SS,
a negative interaction with Lactobacillus (ASV280).
Cutibacterium acnes (ASV86) had a negative interaction with Lactobacillus (ASV280).Microorganisms 2020, 8, 1032 8 of 12
Microorganisms 2020, 8, x FOR PEER REVIEW 8 of 12
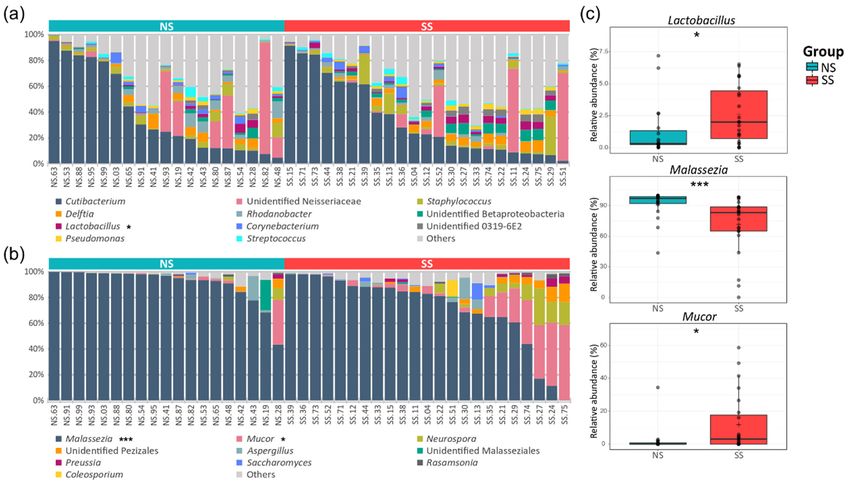
Figure 4. Network analysis of combined bacterial and
Figure 4. and fungal
fungal ASVs
ASVs based
based on
on 50%
50% frequency
frequency inin (a)
(a) NS
NS
and
and (b)
(b)SS
SSgroups.
groups.Each
Eachnode
noderepresents an ASV
represents and and
an ASV is colored according
is colored to bacterial
according phylum
to bacterial or fungal
phylum or
species level. Edge
fungal species color
level. Edgedenotes
color whether
denotes two connected
whether ASVs are in
two connected a positive
ASVs are in or negative or
a positive interaction.
negative
The prominent
interaction. TheASVs and main
prominent ASVsinteractions are shown are
and main interactions enlarged
shownon the plot.
enlarged on D:
thedensity
plot. D:of edge; of
density T:
transitivity (clustering
edge; T: transitivity coefficient).
(clustering coefficient).
3.5. Skin Microbiome and Mycobiome Associated with PS
3.5. Skin Microbiome and Mycobiome Associated with PS
To identify the factors in the subjective information and skin parameters (Table S2) associated
To identify the factors in the subjective information and skin parameters (Table S2) associated
with the structures of the skin microbiome and mycobiome, we fitted all quantitative factors onto
with the structures of the skin microbiome and mycobiome, we fitted all quantitative factors onto the
the ordination space based on unweighted UniFrac via envfit R function. We found that experience
ordination space based on unweighted UniFrac via envfit R function. We found that experience of
of skin allergy, PS, and minimum temperature were significantly related to the bacterial community.
skin allergy, PS, and minimum temperature were significantly related to the bacterial community.
Embarrassment due to skin problems, PS, recognition of any change in skin condition, recognizing
Embarrassment due to skin problems, PS, recognition of any change in skin condition, recognizing
trouble when using cosmetics, skin touch elasticity, and unpleasant sensation on skin were significantly
trouble when using cosmetics, skin touch elasticity, and unpleasant sensation on skin were
related to the fungal community (Figure 5). Except for the factor of minimum temperature in the
significantly related to the fungal community (Figure 5). Except for the factor of minimum
bacterial community, the other eight factors tended to increase toward SS, and such a tendency was more
temperature in the bacterial community, the other eight factors tended to increase toward SS, and
obvious in the fungal community. In particular, PS was the most explanatory variable of community
such a tendency was more obvious in the fungal community. In particular, PS was the most
structure (microbiome, R2 = 0.190, p = 0.016; mycobiome, R2 = 20.320, p = 0.002). Furthermore, the SS
explanatory variable of community structure (microbiome, R = 0.190, p = 0.016; mycobiome, R2 =
samples were distributed along the increasing direction of the PS axis in the PCoA ordination.
0.320, p = 0.002). Furthermore, the SS samples were distributed along the increasing direction of the
We also identified 59 bacterial ASVs (≥50% frequency in all the samples) and 11 fungal ASVs that
PS axis in the PCoA ordination.
were significantly associated with the structures of the skin microbiome and mycobiome, respectively
We also identified 59 bacterial ASVs (≥50% frequency in all the samples) and 11 fungal ASVs
(Figure 5 and Table S7). Regarding the skin microbiome, Lactobacillus (ASV974) and B. caccae (ASV573),
that were significantly associated with the structures of the skin microbiome and mycobiome,
confirmed from LEfSe and network results, were increased toward the SS subjects. Delftia (ASV708)
respectively (Figure 5 and Table S7). Regarding the skin microbiome, Lactobacillus (ASV974) and B.
and Lactobacillus (ASV280), which were found to be more abundant on SS according to the LEfSe result,
caccae (ASV573), confirmed from LEfSe and network results, were increased toward the SS subjects.
were associated with axes of PS and experience of skin allergy. In the skin mycobiome, M. racemosus
Delftia (ASV708) and Lactobacillus (ASV280), which were found to be more abundant on SS according
(ASV09) was found to be more abundant on SS according to the LEfSe result, and its population
to the LEfSe result, were associated with axes of PS and experience of skin allergy. In the skin
increased toward the SS subjects.
mycobiome, M. racemosus (ASV09) was found to be more abundant on SS according to the LEfSe
result, and its population increased toward the SS subjects.respectively (Figure 5 and Table S7). Regarding the skin microbiome, Lactobacillus (ASV974) and B.
caccae (ASV573), confirmed from LEfSe and network results, were increased toward the SS subjects.
Delftia (ASV708) and Lactobacillus (ASV280), which were found to be more abundant on SS according
to the LEfSe result, were associated with axes of PS and experience of skin allergy. In the skin
mycobiome,2020,
Microorganisms M. racemosus
8, 1032 (ASV09) was found to be more abundant on SS according to the LEfSe
9 of 12
result, and its population increased toward the SS subjects.
Figure 5. Correlation of quantitative factors with the structures of the skin (a) microbiome and (b)
mycobiome. The arrows indicated the increasing directions of the quantitative gradients of the factors.
Each text box represents the increasing direction of the corresponding ASV from the origin. The statistics
were calculated using the envfit function of vegan in R. (Allergy, the experience of skin allergy; Temp
min., minimum temperature; PS, perceived skin sensitivity; Embarrassment, embarrassment due to
skin problems; Condition change, recognition of any changes in skin condition; Trouble, recognizing
trouble when using cosmetics; Elasticity, skin touch elasticity; Unpleasant, unpleasant sensation on
the skin).
4. Discussion
In this study, we conducted an in-depth analysis of the skin bacterial and fungal communities
on SS, whereby we revealed that there was a correlation between skin sensitivity and the skin
microbiome/mycobiome. Farage et al. have summarized the research on the sensitive skin syndrome
and reported that the objective physical signs of SS were lower sebum and hydration levels, and a
higher skin temperature than those of NS [26]. In our data, there were no significant differences in
such skin parameters between SS and NS, and there was no correlation between skin parameters and
skin sensitivity (Table 1 and Figure S5). However, we found that the structures of the skin microbiome
and mycobiome varied depending on perceived skin sensitivity (Figure 2). This observation suggests
that the sensitive skin syndrome, which often manifests without objective physical signs, might be
explained by skin microbiome/mycobiome structures.
Despite high inter-individual variability in the skin microbiome [15,27], we observed that the
skin microbiome and mycobiome of SS are distinct from those of NS (Figure 1 and Figure S1).
Healthier people stereotypically have been known to have greater diversity in the skin microbiome
composition [28], but we found that fungal diversity was higher on SS. With the development of
culture-independent sequencing, it has been shown that the Malassezia genus is predominant in the
skin mycobiome of most people [29,30]. Our data support these previous reports, as this genus
accounted for 80% of the mycobiome in all the samples in our study (Figure 2, Table S6). In the SS
group, with decreasing abundance of M. restricta, the composition of the mycobiome became more
varied among the subjects. The same tendency has been observed in other skin disorders [31,32],
which follows the Anna Karenina principle (AKP) hypothesis, suggesting that alterations in the skin
mycobiome contribute to their heterogeneity and are correlated with skin health [33,34].
In addition to Malassezia, Cutibacterium and Staphylococcus are considered as important bacterial
genera in the skin microbiome. However, there were no significant differences in the relative abundances
of Cutibacterium and Staphylococcus between the two skin groups (Figure 3). Hillion et al. have compared
the aerobic culturable bacteria between SS and NS and reported that Staphylococcus is less abundant
in SS patients, which differs from our results [35]. This difference in the results is presumably due
to the differences between the culture-dependent and culture-independent methods used in the
two studies. Interestingly in our study, the Mucor fungal genus was much more abundant on SS
(Figure 2 and Table S6). Among the members of this genus, only one species (M. racemosus) was
found in our data. This species has not received much interest in skin research. M. racemosus inducesMicroorganisms 2020, 8, 1032 10 of 12
IgE-mediated allergic reactions and acts as a mold allergen for asthma and allergic sinusitis sufferers.
M. racemosus has also been used as an allergen in skin-prick and provocation tests, and these sensitized
individuals showed hypersensitivity in both tests [36–38]. Nonetheless, few studies have reported any
involvement of M. racemosus in skin health, and our study suggests a link between this fungal species
and skin sensitivity.
Furthermore, we observed cross-domain interactions in the skin microbiome and mycobiome
and different patterns of these interactions by skin groups (Figure 4). On NS, Lactobacillus maintained
a negative interaction with M. restricta. However, on SS, with the lower abundance of M. restricta,
these negative interactions were shifted to Delftia (ASV708) and Bacteroides caccae (ASV573). We also
observed these ASVs in the results of envfit (Figure 5 and Table S7) and LEfSe analyses (Figure S3).
From the envfit results, we observed that Delftia (ASV708) contributed to PS, while B.caccae (ASV573)
contributed to allergy experience. In particular, ASV280 and ASV974, assigned to the Lactobacillus
genus, were significantly more abundant in the SS group (p = 0.044 and p = 0.008, respectively; data not
shown). This observation is thought to be due to the testing method used in this study to determine the
skin group. Various methods have been designed and used to identify SS, including the first developed
LAST, capsaicin test, and SLS test [9,39,40]. Because some individuals may respond only to a specific
stimulus, multiple testing methods should be used to precisely identify skin sensitivity. Along with
the SLS test, we used the LAST, which classifies subjects with hyperactivity to lactic acid into the SS
group. Lactic acid is an alpha-hydroxy acid (AHA) and has been used as an anti-aging ingredient
to improve the moisture content of the skin, correct hyperpigmentation, and reduce wrinkles by
increasing the production of ceramides and cell turnover rate in the epidermis. However, these acidic
features can irritate the skin, leading to redness or inflammation [41]. The population of Lactobacillus,
which produces lactic acid, might be increased on SS, with hyperactivity to lactic acid.
Our study contributes to the understanding of both the bacterial and fungal communities of
SS and suggests that, in understanding skin sensitivity, the role of mycobiome is as important as
the microbiome that is mainly studied in skin research. This observation may shape the designs of
future studies, revealing the structure and function of the skin microbiome and mycobiome in SS. It is
expected that the understanding of the microbiome/mycobiome of SS will provide the basis for the
development of microbiome-based cosmetics and remedies for SS.
Supplementary Materials: The following are available online at http://www.mdpi.com/2076-2607/8/7/1032/s1,
Figure S1: Bacterial and fungal communities of the two skin groups, Figure S2: Taxonomic composition of
major species on the skin, Figure S3: Result of linear discriminant analysis (LDA) effect size (LEfSe) in the skin
microbiome, Figure S4: Result of linear discriminant analysis (LDA) effect size (LEfSe) in the skin mycobiome,
Figure S5: Correlations among the skin parameters and perceived skin sensitivity, Table S1: The criteria of the
subjects selecting, Table S2: The questions of the sensitivity questionnaire used in this study, Table S3: The number
of sequences reads, Table S4: The distribution of survey data using ANOSIM, Table S5: The relative abundance of
bacterial communities, Table S6: The relative abundance of fungal communities, Table S7: The list of ASVs that
significantly associated with skin microbiome and mycobiome.
Author Contributions: Conceptualization, H.K.; investigation, H.L.K., H.K., H.-J.K., T.P. and S.K.;
writing—original draft preparation, H.L.K.; writing—review and editing, H.L.K., W.J.S. and S.A.; visualization,
H.L.K.; supervision, H.-J.K. and T.P.; project administration, S.A. and W.J.S. All authors have read and agreed to
the published version of the manuscript.
Funding: This research was supported by the AmorePacific Co. R&D Center (Applied Technology & Research
Division) and the Chung-Ang University Research Grants in 2017.
Conflicts of Interest: The authors declare no conflict of interest.
References
1. Misery, L.; Stander, S.; Szepietowski, J.C.; Reich, A.; Wallengren, J.; Evers, A.W.; Takamori, K.; Brenaut, E.;
Le Gall-Ianotto, C.; Fluhr, J.; et al. Definition of Sensitive Skin: An Expert Position Paper from the Special
Interest Group on Sensitive Skin of the International Forum for the Study of Itch. Acta Derm. Venereol. 2017,
97, 4–6. [CrossRef]Microorganisms 2020, 8, 1032 11 of 12
2. Berardesca, E.; Farage, M.; Maibach, H. Sensitive skin: An overview. Int. J. Cosmet. Sci. 2013, 35, 2–8.
[CrossRef]
3. Misery, L.; Loser, K.; Stander, S. Sensitive skin. J. Eur. Acad. Dermatol. Venereol. 2016, 30 (Suppl. 1), 2–8.
[CrossRef] [PubMed]
4. Buhé, V.; Vié, K.; Guéré, C.; Natalizio, A.; Lhéritier, C.; Le Gall-Ianotto, C.; Huet, F.; Talagas, M.; Lebonvallet, N.;
Marcorelles, P. Pathophysiological study of sensitive skin. Acta Derm. Venereol. 2016, 96, 314–319. [CrossRef]
[PubMed]
5. Pons-Guiraud, A. Sensitive skin: A complex and multifactorial syndrome. J. Cosmet. Dermatol. 2004, 3,
145–148. [CrossRef] [PubMed]
6. Misery, L.; Boussetta, S.; Nocera, T.; Perez-Cullell, N.; Taieb, C. Sensitive skin in Europe. J. Eur. Acad Dermatol.
Venereol. 2009, 23, 376–381. [CrossRef] [PubMed]
7. Kamide, R.; Misery, L.; Perez-Cullell, N.; Sibaud, V.; Taieb, C. Sensitive skin evaluation in the Japanese
population. J. Dermatol. 2013, 40, 177–181. [CrossRef]
8. Xu, F.; Yan, S.; Wu, M.; Li, F.; Sun, Q.; Lai, W.; Shen, X.; Rahhali, N.; Taieb, C.; Xu, J. Self-declared sensitive
skin in China: A community-based study in three top metropolises. J. Eur. Acad. Dermatol. Venereol. 2013, 27,
370–375. [CrossRef]
9. Farage, M.A. The Prevalence of Sensitive Skin. Front. Med. 2019, 6, 98. [CrossRef]
10. Chew, A.; Maibach, H. Sensitive skin. In Dry Skin and Moisturizers: Chemistry and Function; Loden, M.,
Maibach, H., Eds.; CRC Press: Boca Raton, FL, USA, 2000; pp. 429–440.
11. Roussaki-Schulze, A.; Zafiriou, E.; Nikoulis, D.; Klimi, E.; Rallis, E.; Zintzaras, E. Objective biophysical
findings in patients with sensitive skin. Drugs Exp. Clin. Res. 2005, 31, 17–24.
12. Richters, R.; Falcone, D.; Uzunbajakava, N.; Verkruysse, W.; van Erp, P.; van De Kerkhof, P. What is sensitive
skin? A systematic literature review of objective measurements. Skin Pharmacol. Physiol. 2015, 28, 75–83.
[CrossRef] [PubMed]
13. Zeeuwen, P.L.; Kleerebezem, M.; Timmerman, H.M.; Schalkwijk, J. Microbiome and skin diseases. Curr.
Opin. Allergy Clin. Immunol. 2013, 13, 514–520. [CrossRef] [PubMed]
14. Findley, K.; Grice, E.A. The skin microbiome: A focus on pathogens and their association with skin disease.
PLoS Path. 2014, 10, e1004436. [CrossRef] [PubMed]
15. Schommer, N.N.; Gallo, R.L. Structure and function of the human skin microbiome. Trends Microbiol. 2013,
21, 660–668. [CrossRef] [PubMed]
16. Seite, S.; Misery, L. Skin sensitivity and skin microbiota: Is there a link? Exp. Dermatol. 2018, 27, 1061–1064.
[CrossRef]
17. Zheng, Y.; Liang, H.; Li, Z.; Tang, M.; Song, L. Skin microbiome in sensitive skin: The decrease of
Staphylococcus epidermidis seems to be related to female lactic acid sting test sensitive skin. J. Dermatol. Sci.
2020, 97, 225–228. [CrossRef]
18. An, S.; Moon, S.; Lee, E.; Lee, H. Method for Diagnosing and Analyzing Sensitive Skin and a System for
Providing Beauty Information Using the Diagnostic and Analytic Method. Korea Patent 10-0418598; filled 24
December 2000, and issued 2 February 2004,
19. Caporaso, J.G.; Kuczynski, J.; Stombaugh, J.; Bittinger, K.; Bushman, F.D.; Costello, E.K.; Fierer, N.; Pena, A.G.;
Goodrich, J.K.; Gordon, J.I. QIIME allows analysis of high-throughput community sequencing data. Nat.
Methods 2010, 7, 335. [CrossRef]
20. Martin, M. Cutadapt removes adapter sequences from high-throughput sequencing reads. EMBnet J. 2011,
17, 10–12. [CrossRef]
21. Rognes, T.; Flouri, T.; Nichols, B.; Quince, C.; Mahé, F. VSEARCH: A versatile open source tool for
metagenomics. PeerJ 2016, 4, e2584. [CrossRef]
22. Bokulich, N.A.; Subramanian, S.; Faith, J.J.; Gevers, D.; Gordon, J.I.; Knight, R.; Mills, D.A.; Caporaso, J.G.
Quality-filtering vastly improves diversity estimates from Illumina amplicon sequencing. Nat. Methods 2013,
10, 57. [CrossRef]
23. Amir, A.; McDonald, D.; Navas-Molina, J.A.; Kopylova, E.; Morton, J.T.; Xu, Z.Z.; Kightley, E.P.;
Thompson, L.R.; Hyde, E.R.; Gonzalez, A. Deblur rapidly resolves single-nucleotide community sequence
patterns. mSystems 2017, 2, e00191-16. [CrossRef] [PubMed]Microorganisms 2020, 8, 1032 12 of 12
24. Bokulich, N.A.; Kaehler, B.D.; Rideout, J.R.; Dillon, M.; Bolyen, E.; Knight, R.; Huttley, G.A.; Caporaso, J.G.
Optimizing taxonomic classification of marker-gene amplicon sequences with QIIME 2’s q2-feature-classifier
plugin. Microbiome 2018, 6, 90. [CrossRef] [PubMed]
25. Rivers, A.R.; Weber, K.C.; Gardner, T.G.; Liu, S.; Armstrong, S.D. ITSxpress: Software to rapidly trim
internally transcribed spacer sequences with quality scores for marker gene analysis. F1000Research 2018, 7,
1418. [CrossRef] [PubMed]
26. Farage, M.A.; Maibach, H. Sensitive skin: Closing in on a physiological cause. Contact Derm. 2010, 62,
137–149. [CrossRef]
27. Oh, J.; Byrd, A.L.; Park, M.; Kong, H.H.; Segre, J.A. Temporal stability of the human skin microbiome. Cell
2016, 165, 854–866. [CrossRef]
28. Prescott, S.L.; Larcombe, D.-L.; Logan, A.C.; West, C.; Burks, W.; Caraballo, L.; Levin, M.; Van Etten, E.;
Horwitz, P.; Kozyrskyj, A. The skin microbiome: Impact of modern environments on skin ecology, barrier
integrity, and systemic immune programming. World Allergy Organ. J. 2017, 10, 29. [CrossRef]
29. Jo, J.-H.; Kennedy, E.A.; Kong, H.H. Topographical and physiological differences of the skin mycobiome in
health and disease. Virulence 2017, 8, 324–333. [CrossRef]
30. Leung, M.H.; Chan, K.C.; Lee, P.K. Skin fungal community and its correlation with bacterial community of
urban Chinese individuals. Microbiome 2016, 4, 46. [CrossRef]
31. Takemoto, A.; Cho, O.; Morohoshi, Y.; Sugita, T.; Muto, M. Molecular characterization of the skin fungal
microbiome in patients with psoriasis. J. Dermatol. 2015, 42, 166–170. [CrossRef]
32. Tanaka, A.; Cho, O.; Saito, M.; Tsuboi, R.; Kurakado, S.; Sugita, T. Molecular characterization of the skin
fungal microbiota in patients with seborrheic dermatitis. J. Clin. Exp. Dermatol Res. 2014, 5, 239.
33. Zaneveld, J.R.; McMinds, R.; Thurber, R.V. Stress and stability: Applying the Anna Karenina principle to
animal microbiome. Nat. Microbiol. 2017, 2, 1–8. [CrossRef] [PubMed]
34. Ma, Z.S. Testing the Anna Karenina principle in human microbiome-associated diseases. iScience 2020, 23,
101007. [CrossRef]
35. Hillion, M.; Mijouin, L.; Jaouen, T.; Barreau, M.; Meunier, P.; Lefeuvre, L.; Lati, E.; Chevalier, S.; Feuilloley, M.
Comparative study of normal and sensitive skin aerobic bacterial populations. Microbiologyopen 2013, 2,
953–961. [CrossRef]
36. Lin, R.; Aziz, M.; Yoo-Bowne, H. Maxillary sinus mycetoma associated with hypersensitivity to Mucor
racemosus. Internet J. Asthma Allergy Immunol. 2006, 5. Available online: http://ispub.com/IJAAI/5/1/12518
(accessed on 10 July 2020).
37. Apold, J.; Havnen, J.; Hvatum, M.; Oseid, S.; Aas, K. The radioallergosorbent test (RAST) in the diagnosis of
reaginic allergy: A comparison between provocation tests, skin tests and RAST employing allergo-sorbents
which were arbitrarily prepared with commercial allergen extracts. Clin. Exp. Allergy 1974, 4, 401–409.
[CrossRef]
38. Taskinen, T.; Laitinen, S.; Hyvärinen, A.; Meklin, T.; Husman, T.; Nevalainen, A.; Korppi, M. Mold-specific
IgE antibodies in relation to exposure and skin test data in schoolchildren. Allergol. Int. 2001, 50, 239–245.
[CrossRef]
39. Frosch, P.J.; Kligman, A.M. A method for appraising the stinging capacity of topically applied substances. J.
Soc. Cosmet. Chem. 1977, 28, 197–209.
40. Lee, C.H.; Maibach, H.I. The sodium lauryl sulfate model: An overview. Contact Derm. 1995, 33, 1–7.
[CrossRef]
41. Smith, W. Comparative effectiveness of α-hydroxy acids on skin properties. Int. J. Cosmet. Sci. 1996, 18,
75–83. [CrossRef]
© 2020 by the authors. Licensee MDPI, Basel, Switzerland. This article is an open access
article distributed under the terms and conditions of the Creative Commons Attribution
(CC BY) license (http://creativecommons.org/licenses/by/4.0/).You can also read