Susceptibility to Ground Motion Amplification from Seismic Waves based on Multichannel Analysis of Surface Waves in the Red Deer Area, Alberta ...
←
→
Page content transcription
If your browser does not render page correctly, please read the page content below
AER/AGS Open File Report 2021-03

 Susceptibility to Ground
 Motion Amplification from
 Seismic Waves based on
 Multichannel Analysis of
 Surface Waves in the Red Deer
 Area, Alberta
AER/AGS Open File Report 2021-03

Susceptibility to Ground Motion Amplification
from Seismic Waves based on Multichannel
Analysis of Surface Waves in the Red Deer Area,
Alberta

J. Yusifbayov, C. Filewich and L.A. Atkinson

Alberta Energy Regulator
Alberta Geological Survey

May 2021
©Her Majesty the Queen in Right of Alberta, 2021
ISBN 978-1-4601-4935-5

The Alberta Energy Regulator / Alberta Geological Survey (AER/AGS), its employees and contractors
make no warranty, guarantee or representation, express or implied, or assume any legal liability regarding
the correctness, accuracy, completeness or reliability of this publication. Any references to proprietary
software and/or any use of proprietary data formats do not constitute endorsement by the AER/AGS of
any manufacturer’s product.

If you use information from this publication in other publications or presentations, please acknowledge
the AER/AGS. We recommend the following reference format:

Yusifbayov, J., Filewich, C. and Atkinson, L.A. (2021): Susceptibility to ground motion amplification
 from seismic waves based on multichannel analysis of surface waves in the Red Deer area, Alberta;
 Alberta Energy Regulator / Alberta Geological Survey, AER/AGS Open File Report 2021-03, 14 p.

Publications in this series have undergone only limited review and are released essentially as submitted
by the author.

Published May 2021 by:
Alberta Energy Regulator
Alberta Geological Survey
4th Floor, Twin Atria Building
4999 – 98th Avenue
Edmonton, AB T6B 2X3
Canada

Tel: 780.638.4491
Fax: 780.422.1459
Email: AGS-Info@aer.ca
Website: www.ags.aer.ca

 AER/AGS Open File Report 2021-03 • iii
Contents
Acknowledgements ....................................................................................................................................... v
Abstract ........................................................................................................................................................ vi
1 Introduction.............................................................................................................................................. 1
2 Ground Motion Amplification and the National Building Code of Canada Classification ..................... 1
3 Geological Summary of the Study Area .................................................................................................. 2
4 Shear-Wave Profiling .............................................................................................................................. 5
5 Shear-Wave Velocity Profiles and Amplification Susceptibility............................................................ 5
6 Discussion ................................................................................................................................................ 9
7 Conclusions............................................................................................................................................ 11
8 References.............................................................................................................................................. 12
Appendix 1 – Frontier Geosciences Inc.’s Multichannel Analysis of Surface Waves Survey Report, Red
 Deer Area, AB........................................................................................................................................ 14

Tables
Table 1. Site classification and susceptibility ratings derived from the average shear-wave velocity of the
 uppermost 30 m of the subsurface............................................................................................... 2
Table 2. Lithologies observed in the study area and their respective interpreted shear-wave velocities ...... 7

Figures
Figure 1. Summary of geological and geophysical knowledge of the study area, including total thickness
 of heterogeneous sediments above bedrock and the epicentres of induced seismic events ........ 3
Figure 2. Supplementary material used in this study to select the sites for the multichannel analysis of
 surface waves surveys ................................................................................................................. 4
Figure 3. a) An example of a shear-wave velocity profile interpreted from a multichannel analysis of
 surface waves survey. b) Lithological units observed at the closest water well. c) Average
 shear-wave velocity as a function of depth calculated from the shear-wave velocity profile ..... 6
Figure 4. Shear-wave velocities for the interbedded shale-sandstone strata, collected from multiple
 multichannel analysis of surface waves surveys ......................................................................... 7
Figure 5. The average shear-wave velocities interpolated for the uppermost 30 m of the subsurface. These
 values represent the best estimate (50th percentile) from a thousand iterations ......................... 8
Figure 6. The average shear-wave velocities interpolated for the uppermost 30 m of the subsurface. These
 values represent a) the low estimate (10th percentile) and b) the high estimate (90th
 percentile).................................................................................................................................... 9
Figure 7. The best estimate of shear-wave velocities (50th percentile, Figure 5) organized by the National
 Earthquake Hazards Reduction Program’s classification. ........................................................ 10

 AER/AGS Open File Report 2021-03 • iv
Acknowledgements
We wish to thank Shilong Mei (Alberta Geological Survey) for providing critical data needed to model
the Paskapoo Formation. Additionally, we wish to thank Laurence Andriashek (Alberta Geological
Survey) and Todd Shipman (Alberta Energy Regulator) whose technical commentaries and editorial
review considerably improved this manuscript.

 AER/AGS Open File Report 2021-03 • v
Abstract
An increase in hydraulic fracturing–related induced seismicity near the city of Red Deer over the recent
years has fueled great scientific interest in the area. Most of the research published thus far has focused on
the mechanics of the recorded seismic events. The objective of this study is to map the potential
susceptibility to ground motion amplification from seismic waves across the study area based on local
changes in geology. To achieve this, seven locations were chosen and velocity profiles were created based
on multichannel analysis of surface waves (MASW) surveys. This newly acquired geophysical data was
incorporated with knowledge of the shallow geology of the Sylvan Lake sub-basin, to assign
susceptibility ratings based on the National Earthquake Hazards Reduction Program’s (NEHRP)
classification. This analysis demonstrates that areas with a thicker unconsolidated sediment layer above
bedrock (areas exhibiting greater depth to top of bedrock) are the most susceptible to the amplification of
the seismic ground motions. Conversely, areas where bedrock is at or near the surface show a much lower
susceptibility to ground motion amplification. In general, the vast majority of the study area was
determined to have a very low or low susceptibility to ground motion amplification (NEHRP Site classes
B and C), though areas exhibiting a thicker sediment layer above bedrock were determined to be
moderately susceptible (NEHRP Site Class D). As this research was conducted on a regional scale, site-
specific evaluations may need to be undertaken to better assess ground motion amplification.

 AER/AGS Open File Report 2021-03 • vi
1 Introduction
In Alberta, some of the most prolific clusters of induced seismicity have occurred near the town of Rocky
Mountain House (Wetmiller, 1986), the town of Fox Creek (Schultz et al., 2018), and, most recently, near
the city of Red Deer (Wang et al., 2020). Following a 4.18 local magnitude (ML) event that occurred on
March 4, 2019, near the city of Red Deer, the Alberta Energy Regulator has developed specific regulatory
requirements (Subsurface Order No. 7, Alberta Energy Regulator, 2019b; Alberta Energy Regulator,
2019a) to limit the impact and potential of induced earthquakes from hydraulic fracturing activities in that
area. As part of the order, operators are required to submit waveform data from passive seismic stations
operating real-time in the area to improve detection thresholds (Introduction of statistical variability to the
magnitude threshold calculations and the effects observed, J. Yusifbayov and R. Schultz, work in
progress, 2021) and to establish spatiotemporal correlations with nearby hydraulic fracturing operations
(Schultz and Wang, 2020). An increase of seismic data in this and other areas of Alberta has fueled
scientific interest to better understand (Schultz et al., 2016; Galloway et al., 2018) and model (Pawley et
al., 2018) regions that are susceptible to induced seismicity. Fundamentally, the nature of seismic waves
at the surface depends not only on the mechanism and depth of an event, but also the path the waves
travelled from the seismic source to the surface. An observed event at the surface, in terms of the duration
and intensity of ground motion, is highly dependent on local site conditions. As observed in the 1985
Mexico City earthquake (Anderson et al., 1986), the characteristics of near-surface sediments can play a
key role in the amplification and attenuation of the incoming seismic waves (Finn et al., 2004). Given the
potential for ground motion amplification to inflict damage to infrastructure, understanding the
susceptibility to ground motion amplification is key in the assessment of seismic hazard.

2 Ground Motion Amplification and the National Building Code of
 Canada Classification
Ground motion amplification is a complex phenomenon, but the causes of it are well understood. The
susceptibility for ground motion amplification is defined by the characteristics of the subsurface geology
through which the waves travel as they near the surface. Amplification commonly occurs where loosely
packed unconsolidated sediments overlie more tightly packed unconsolidated sediments or bedrock strata.
Specifically, as shear waves travel from a denser material to a softer material, a reduction in velocity and
corresponding shortening of the wavelengths causes an increase in the shear-wave amplitudes over a wide
variety of the frequency bands (Shearer and Orcutt, 1987). Shear waves can be further subjected to
amplification when i) a thin sediment layer above the bedrock traps and in turn amplifies seismic energy
due to resonance of the waves between the surface and the sediment-bedrock interface (Kramer, 1996);
ii) depressions formed at the sediment-bedrock interface focus amplification at a specific point on the
surface (Bard and Bouchan, 1985); and iii) there is a superposition of the surface waves that are generated
from the shear wave conversion near the edges of the depressions at the sediment-bedrock interface
(Lomnitz, 1999). These effects were not directly considered as part of this study, as a three-dimensional
near-surface geological model was unavailable at the scale necessary to conduct this work with
confidence. Rather, this study focused strictly on modelling average shear-wave velocities in the
uppermost 30 m of the subsurface, referred to herein as VS30 (Finn et al., 2004). Based on the VS30, the
National Earthquake Hazards Reduction Program (NEHRP) in the United States defined five site classes
(Building Seismic Safety Council, 1994), which were later adopted by the National Research Council of
Canada for the National Building Code of Canada (NBCC; Table 1; National Research Council, 2010),
with the expectation that earthquakes within the same site class will experience similar amplification.
Taking into account that amplification occurs when the shear-wave velocities decrease, amplification is
more likely to happen at Site classes D and E, where the observed velocities are the slowest.

 AER/AGS Open File Report 2021-03 • 1
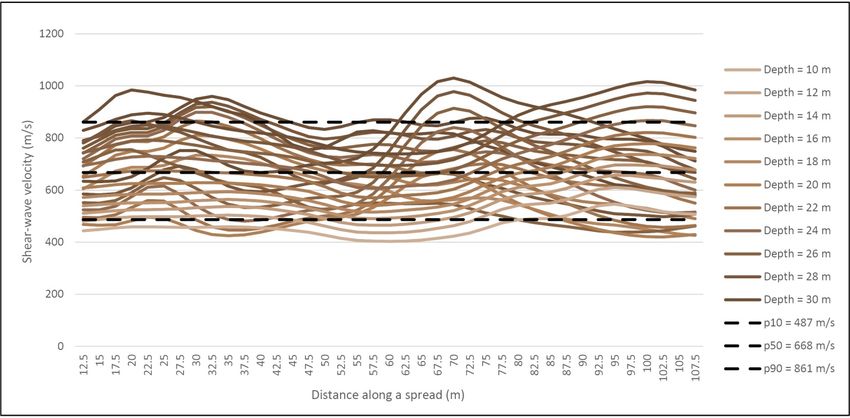
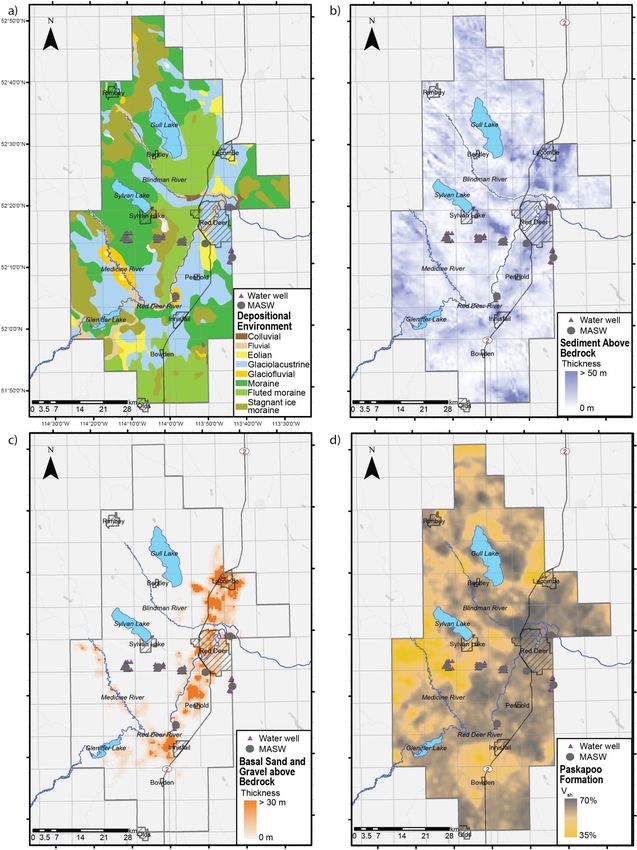
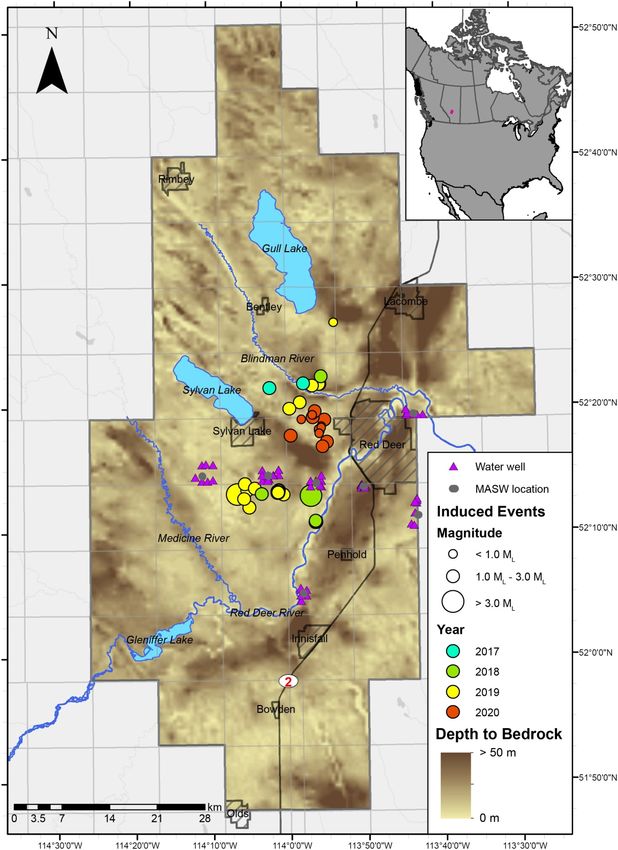
Table 1. Site classification and susceptibility ratings derived from the average shear-wave velocity
of the uppermost 30 m of the subsurface (National Research Council, 2010).
Site Class General Description Velocity Range (m/s) Susceptibility Rating
 A Hard rock 1500 < VS30 None
 B Rock 760 < VS30 < 1500 Very low
 C Soft rock and dense soils 360 < VS30 < 760 Low
 D Stiff soils 180 < VS30 < 360 Moderate
 E Soft soils VS30 < 180 High

3 Geological Summary of the Study Area
The study area is located in central Alberta, near the city of Red Deer and includes NTS map areas 82O,
P, 83A, and B. This area was specifically chosen to encompass seismic events from anthropogenic
activity starting in mid-2017 (Figure 1; Schultz and Wang, 2020; Wang et al., 2020). It lies within the
area of the newly established Subsurface Order No. 7 (Alberta Energy Regulator, 2019b), and it
encompasses geological conditions that differ significantly across the study area; principally, the
uppermost unconsolidated layer of heterogeneous sediments deposited during the Neogene–Quaternary
periods, which overlie consolidated bedrock (Figure 2a; Riddell et al., 2009; Fenton et al., 2013). The
above-bedrock Neogene–Quaternary sedimentary succession consists of four main units divided as part of
the Sylvan Lake hydrostratigraphic model by Atkinson and Glombick (2015). The most important
component of the model for this study is the preglacial fluvial and lacustrine deposits, mainly sand and
gravel resting on bedrock and constrained to the Red Deer paleovalley (informally referred to as HSU S1
in Atkinson and Glombick, 2015). Deposits overlying the preglacial deposits in the Red Deer paleovalley
and resting on bedrock outside of the Red Deer paleovalley are discontinuous sediments of
glaciolacustrine and glaciofluvial origin, as well as moraine (till) and postglacial sediments (collectively
referred to herein as undifferentiated sediments above bedrock). These deposits range in thickness
significantly, from 0 m to as much as 45 m in places (Figure 2b; Atkinson and Glombick, 2015). The
sediment on the floor of the Red Deer paleovalley mainly consists of preglacial sand and gravel, which
reaches a thickness of more than 30 m and trends through the city of Red Deer in a northeast direction
(Figure 2c; Atkinson and Glombick, 2015). As the thickness considered in this study only includes the
uppermost 30 m of the subsurface, most of the studied interval is dominated by the combined thickness of
undifferentiated sediments above bedrock and a basal sand and gravel above bedrock unit in the Red Deer
paleovalley (Figure 1). The basal sand and gravel unit was differentiated from the rest of the sediments
above bedrock primarily because the depositional nature of the deposits makes it easier to map, but also
because it was expected to exhibit much higher shear-wave velocities than the undifferentiated sediments
above it. In areas where the combined thickness of these sediment units is less than 30 m, the
investigation included the topmost part of the underlying bedrock. In the study area, the Paskapoo
Formation constitutes the top of the bedrock and consists of an eastward-thinning succession of
Paleogene nonmarine clastic sedimentary rocks (Figure 2d; Lyster and Andriashek, 2012; Atkinson and
Glombick, 2015; Mei, 2019).

 AER/AGS Open File Report 2021-03 • 2
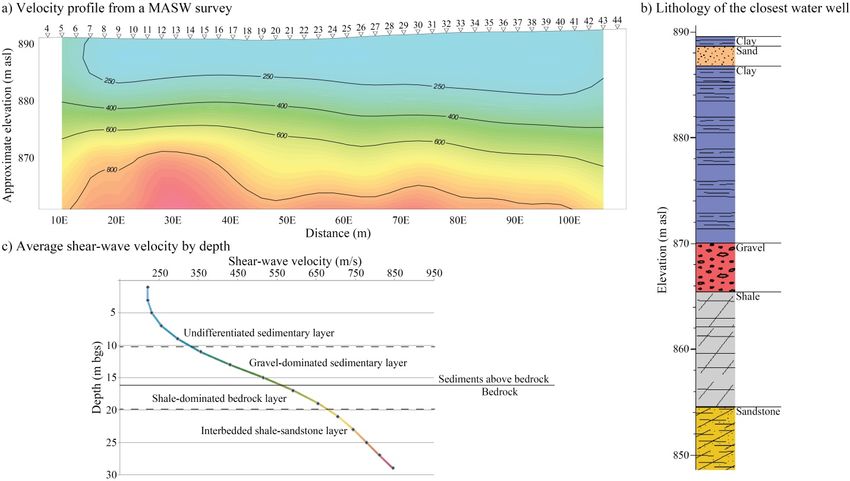
Figure 1. Summary of geological and geophysical knowledge of the study area (Red Deer area,
Alberta), including total thickness of heterogeneous sediments above bedrock (Atkinson et al.,
2020) and the epicentres of induced seismic events. Seismic events are indicated as circles sized
and colour-coded based on the magnitude and year of the event, respectively. Locations of the
multichannel analysis of surface waves (MASW) surveys are indicated in grey and selected water
wells surrounding the surveyed areas are shown as purple triangles. The earthquake data was
retrieved from the Alberta Geological Survey Earthquake Dashboard (https://ags-
aer.shinyapps.io/Seismicity_waveform_app). Abbreviation: ML, local magnitude.

 AER/AGS Open File Report 2021-03 • 3
Figure 2. Supplementary material used in this study to select the sites for the multichannel
analysis of surface waves (MASW) surveys (Red Deer area, Alberta). Criteria considered were
a) surficial geology (Fenton et al., 2013), b) thickness of the undifferentiated sediments above
bedrock unit (Atkinson and Glombick, 2015), c) thickness of the basal sand and gravel above
bedrock unit (Atkinson and Glombick, 2015), and d) volume of shale (Vsh) for the topmost 30 m of
the Paskapoo Formation (Mei, 2019).

 AER/AGS Open File Report 2021-03 • 4
4 Shear-Wave Profiling
There are various techniques developed to investigate local site conditions and susceptibility for ground
motion amplification. Most can be divided into intrusive seismic techniques, such as sonic logging,
seismic cone penetration testing (SCPT), and borehole logging techniques. Others can be classified as
nonintrusive methods and include shear-wave refraction techniques, spectral analysis of surface waves
(SASW), and multichannel analysis of surface waves (MASW). Readers interested in these techniques are
referred to Hunter and Crow (2012) for an in-depth review. In summary, most of the intrusive methods
are more difficult to implement in the field, as they require costly drilling and/or prolonged collection
campaigns, but typically the results are less subject to interpretation, as measurements are more direct and
of higher resolution. Conversely, nonintrusive methods measure seismic surface and body waves, which
are less costly to acquire but require more rigorous interpretation.
This study used a MASW technique, first proposed in Park et al. (1999), to indirectly measure shear-wave
velocities as a function of depth. This technique uses a spread of 48 geophones with a spacing of 2.5 m
between each geophone to measure the velocities of the Rayleigh waves along an approximately 100 m
spread to a depth of 30 m. The surface waves are produced by a sledgehammer striking a steel plate
placed between every other geophone. Produced waves propagate cylindrically from the source near the
surface and are reliably detected by the geophones. This method allows for redundant stacking of the
phase arrivals and can be checked in the field to ensure the best quality of data collected. Later, the
dispersion curves are generated from the combined waveform data collected from the individual
geophones and inverse modelled to create a high-quality shear-wave velocity profile of the surveyed area.
This approach was conducted by the Alberta Geological Survey with the assistance of Frontier
Geosciences Inc. A detailed report on the field campaign, interpretive procedure, and the results can be
found in Appendix 1.
A key criterion in acquiring accurate velocity profiles is in the selection of appropriate sites for the
survey. As such, seven locations (Figure 1) were carefully chosen to best leverage knowledge of the
surficial and near-surface geology. As mentioned in the previous section, the geology of the study area is
quite varied, in both thickness of mappable units and their composition. This can play a significant role in
the recorded shear-wave velocities as greater compaction of a material due to greater depth of burial can
increase the velocity within a unit. Porosity, permeability, and weathering can also further increase
velocity variability and impact the strata’s ability to transfer seismic energy. Overall, capturing and
understanding the variability between different and similar formations can yield a more accurate velocity
profile of the surveyed area. Lithological descriptions from boreholes proximal to the survey sites and
across the study area were used to capture and map this variability of the geological units, offering a form
of ground-truthing of the interpretations derived from the MASW surveys. This integration of geological
and seismological data can yield an accurate assessment of the VS30 profiles used to map the susceptibility
to ground motion amplification.

5 Shear-Wave Velocity Profiles and Amplification Susceptibility
The NBCC and the NEHRP classifications are based on the VS30 profiles and can be calculated using the
following equation:
 h
 30 = Σt (1)
where h is the thickness of the medium and Σt is the time it takes for a shear wave to travel through that
medium. The numerator of the equation is simple and remains constant at 30 m for this study. However,
the denominator is trickier to define, as the wave travel time is dependent on the thickness and the strata
below the surface, but it can be calculated using the following equation:

 = (2)

 AER/AGS Open File Report 2021-03 • 5
As such, it is important to determine the velocities at which waveforms propagate through different
geological units ( ) in the study area. This is achieved by comparing the velocity profiles collected
from the field with the lithology observed at the nearest boreholes. To start, three major units were
considered in this study: an undifferentiated sediments above bedrock unit, a basal sand and gravel above
bedrock unit, and a bedrock unit. The bedrock unit, composed of the Paskapoo Formation, was then
divided into three lithostratigraphic subdivisions (following Demchuk and Hills, 1991) based on the
volume of shale (Vsh; Mei, 2019). With this approach, areas with Vsh less than 45% were categorized as
sandstone rich, volumes over 60% were categorized as shale rich, and volumes in-between were
categorized as interbedded shale-sandstone. These cutoffs were chosen as they best correlate with the
lithology observed in the water well logs and the velocity profiles collected from the MASW surveys.
These five stratigraphic units were used in this study.
As shown in Figure 3, the thickness and the velocity for individual strata can be extrapolated from a
velocity profile collected from the MASW surveys, where a sudden change in velocity usually indicates a
phase change (Appendix 1, Figure 9). Contrary to that, a gradual change in velocity can be observed with
depth, where compaction due to gravity increases density of a formation (Appendix 1, Figure 3).
Similarly, a gradational change in velocity develops where thinly interbedded lithologies, such as those
within the Paskapoo Formation, have a tendency to mute the seismic response. As such, exact velocities
per strata were substituted with a bell curve of possible values (Figure 4) resulting in an interpreted
velocity for the 10th (p10), 50th (p50), and 90th (p90) percentile of the velocities for each lithology
(Table 2).

Figure 3. a) An example of a shear-wave velocity profile interpreted from a multichannel analysis
of surface waves (MASW) survey. b) Lithological units observed at the closest water well.
c) Average shear-wave velocity as a function of depth calculated from the shear-wave velocity
profile. Solid and dashed black lines represent the interpreted unit boundaries, generalized for
that survey's point location. All three components were needed to determine the average shear-
wave velocity in the uppermost 30 m of the subsurface (VS30). Abbreviations: bgs, below ground
surface; E, to the east.

 AER/AGS Open File Report 2021-03 • 6
Figure 4. Shear-wave velocities for the interbedded shale-sandstone strata, collected from
multiple multichannel analysis of surface waves (MASW) surveys, Red Deer area, Alberta.
Common trait exhibited is an increase of the velocities with depth, however, variation was also
observed within the same depth at a single survey site. As such, a bell curve of possible velocities
is generated and used for five stratigraphic units used in this study. Abbreviation: p, percentile.

Table 2. Lithologies observed in the study area (Red Deer area, Alberta) and their respective
interpreted shear-wave velocities. Abbreviation: p, percentile.
 p10 p50 p90
 Lithology
 (m/s) (m/s) (m/s)
Sediments above bedrock, undifferentiated 224 327 397
Sediments above bedrock, basal sand and gravel 347 501 732
Bedrock, shale 391 476 589
Bedrock, interbedded shale-sandstone 487 668 861
Bedrock, sandstone 898 1143 1382

Cognizant of the , location-dependent is easy to calculate. To do this, a digital stratigraphic
model was reconstructed, with a cell density of 0.5 by 0.5 km, of the five units: undifferentiated
sediments above bedrock, basal sand and gravel above bedrock (both units from an updated version of the
Sylvan Lake sub-basin hydrostratigraphic model; Atkinson and Glombick, 2015), and the three
subdivisions of the Paskapoo Formation (from a three-dimensional Vsh property model; Mei, 2019). Every
cell was evaluated to ensure that the 30 m depth was maintained and the timing of the waveform going
through each formation was calculated using Equation 2. The total time per cell is then used in
Equation 1, to calculate a shear-wave velocity for the uppermost 30 m of the succession. To account for
the variability in , a random velocity percentile per strata was assigned and calculated for
individual formations, and the final result was averaged from a thousand iterations (Figure 5). This
method captures an amplification that is dependent on the strata and the velocity at which shear waves
propagate through it. This approach was later modified, and a constant value for the was used to
find the amplification caused by the likely lowest (p10; Figure 6a) and highest (p90; Figure 6b)
theoretical velocities. The information shown in Figure 5 was recompiled with the NBCC site
classification to best illustrate areas that have the highest susceptibility to ground motion amplification
(Figure 7).

 AER/AGS Open File Report 2021-03 • 7
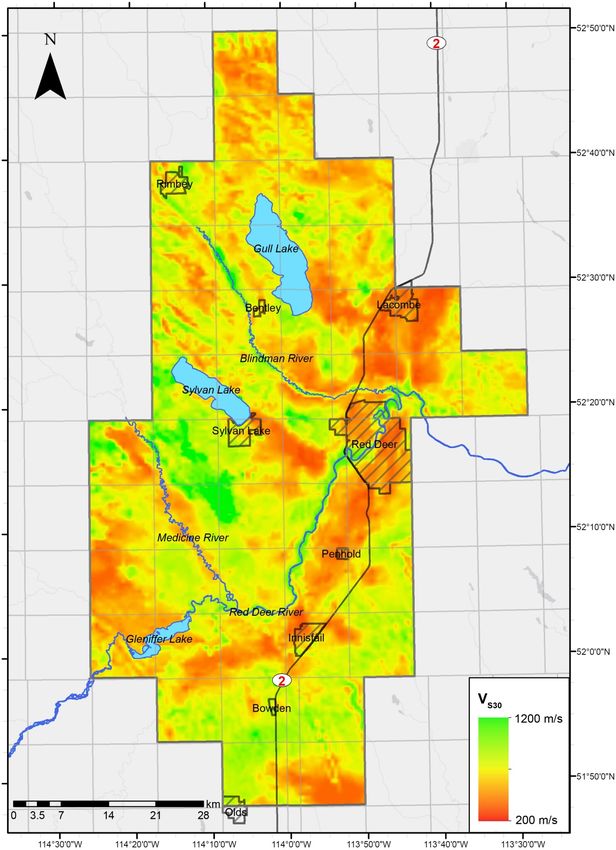
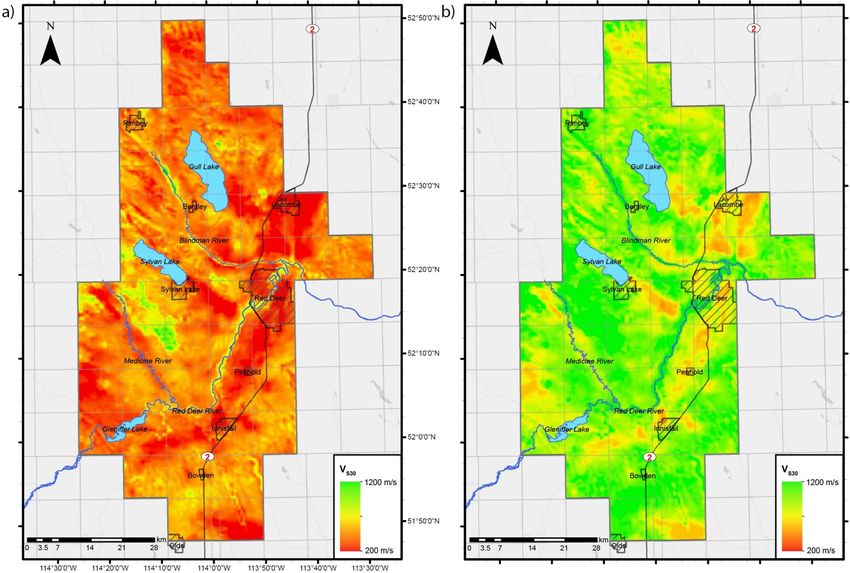
Figure 5. The average shear-wave velocities interpolated for the uppermost 30 m of the
subsurface (VS30), Red Deer area, Alberta. These values represent the best estimate (50th
percentile) from a thousand iterations, where shear-wave velocity per unit was randomly assigned
from a bell curve of possibilities.

 AER/AGS Open File Report 2021-03 • 8
Figure 6. The average shear-wave velocities interpolated for the uppermost 30 m of the
subsurface (VS30), Red Deer area, Alberta. These values represent a) the low estimate (10th
percentile) and b) the high estimate (90th percentile).

6 Discussion
The data collected, and subsequent interpretations made from the MASW surveys, support previously
expected outcomes, i.e., stiffer soils have the highest propagating velocities. In this study area, the stiffest
soils were encountered where the sandstone-rich areas of the Paskapoo Formation are at or near the
surface, east of the town of Sylvan Lake (Figure 2d). The shale and the interbedded shale-sandstone
encountered in other parts of the Paskapoo Formation have progressively lower velocities. The basal sand
and gravel above bedrock unit of the Red Deer paleovalley and the undifferentiated sediments above
bedrock unit have distinctly lower velocities than the bedrock.
Overall, amplification susceptibility in the study area is deemed to be low, with most of the area classified
in Site Class C according to the NEHRP and NBCC classifications, with few areas in Site Class D, and
even less in Site Class B. The findings of this study show that a key factor in the susceptibility to
amplification of seismic ground motions is the presence of an over-thickened sediment unit above the
bedrock. However, other factors such as the paleotopography at the bedrock unconformity can further
affect ground motion by focusing incoming seismic waves. Areas with a thinner sediment unit above
bedrock could also experience some amplification due to resonance, if the site period matches that of the
short period ground motion. As such, findings presented in this research should only be used as a broad
assessment of the regional susceptibility. Site-specific evaluations, including site-specific seismic surveys
and lithological interpretations, and consideration of the potential for natural and induced seismic activity
should be used to inform site-specific hazard assessments.

 AER/AGS Open File Report 2021-03 • 9
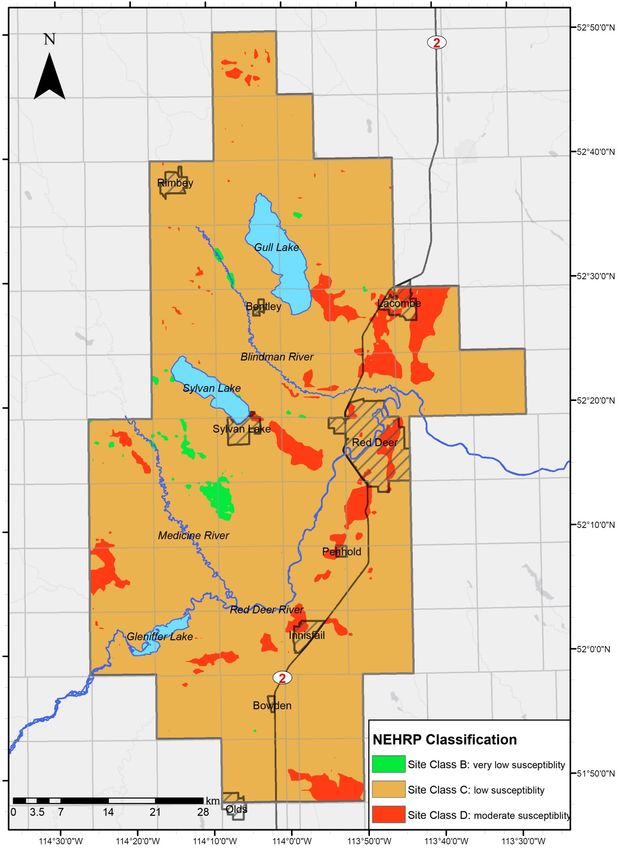
Figure 7. The best estimate of shear-wave velocities (50th percentile, Figure 5) organized by the
National Earthquake Hazards Reduction Program’s (NEHRP) classification (Building Seismic
Safety Council, 1994). Based on these findings, the susceptibility of amplification in the study area
is directly related to the thickness of the unconsolidated sediments above the bedrock.

 AER/AGS Open File Report 2021-03 • 10
7 Conclusions
This study focused on the regional susceptibility to the ground motion amplification from seismic waves
near Red Deer. Such analysis is useful in the planning phases of major infrastructure projects, as it can
identify areas where more detailed site-specific studies should be considered to evaluate the seismic
hazard. In the study area, estimated susceptibility is generally low, but increases in areas with an
increasing thickness of the sediment layer above bedrock. This research was conducted on a regional
scale and therefore should not be used to assess site-specific susceptibility to ground motion
amplification. Instead, it highlights areas where site-specific evaluations may need to be undertaken to
better identify and mitigate potential risks from ground motion amplification.

 AER/AGS Open File Report 2021-03 • 11
8 References
Alberta Energy Regulator (2019a): Recommendations around hydraulic fracturing in the Red Deer area;
 Alberta Energy Regulator, AER Bulletin 2019-07, 2 p., URL
 .
Alberta Energy Regulator (2019b): Subsurface Order No. 7; Alberta Energy Regulator, 4 p., URL
 .
Anderson, J.G., Bodin, P., Brune, J.N., Prince, J., Singh, S.K., Quass, R. and Onate, M. (1986): Strong
 motion from the Michoacan, Mexico, earthquake; Science, v. 233, p. 1043–1049.
Atkinson, L.A. and Glombick, P.M. (2015): Three-dimensional hydrostratigraphic modelling of the
 Sylvan Lake sub-basin in the Edmonton-Calgary Corridor, central Alberta; Alberta Energy
 Regulator, AER/AGS Open File Report 2014-10, 58 p., URL
 .
Atkinson, L.A., Pawley, S.M., Andriashek, L.D., Hartman, G.M.D., Utting, D.J. and Atkinson, N. (2020):
 Sediment thickness of Alberta, version 2; Alberta Energy Regulator / Alberta Geological Survey,
 AER/AGS Map 611, URL .
Bard, P. Y. and Bouchon, M. (1985): The two-dimensional resonance of sediment-filled valleys; Bulletin
 of the Seismological Society of America, v. 75, p. 519–541.
Building Seismic Safety Council (1994): NEHRP recommended provisions for seismic regulations of
 new buildings: part 1, provisions; Publication FEMA 222A, prepared for Federal Emergency
 Management Agency, 290 p.
Demchuk, T.D. and Hills, L. (1991): A re-examination of the Paskapoo Formation in the central Alberta
 Plains: the designation of three new members; Canadian Society of Petroleum Geologists Bulletin,
 v. 39, no. 3, p. 270–282.
Fenton, M.M., Waters, E.J., Pawley, S.M., Atkinson, N., Utting, D.J. and Mckay, K. (2013): Surficial
 geology of Alberta; Alberta Energy Regulator, AER/AGS Map 601, URL
 .
Finn, W.D.L., Onur, T. and Ventura, C.E. (2004): Microzonation: developments and applications;
 Chapter 1 in Recent Advances in Earthquake Geotechnical Engineering and Microzonation, A. Ansal
 (ed.), Kluwer Academic Publishers, Dordrecht, Boston and London, p. 3–26.
Galloway, E., Hauck, T., Corlett, H., Pană, D. and Schultz, R. (2018): Faults and associated karst collapse
 suggest conduits for fluid flow that influence hydraulic fracturing-induced seismicity; Proceedings of
 the National Academy of Sciences, v. 115, no. 43, p. E10003–E10012,
 doi:10.1073/pnas.1807549115
Hunter, J.A. and Crow, H.L., ed. (2012): Shear wave velocity measurement guidelines for Canadian
 seismic site characterization in soil and rock; Geological Survey of Canada, Open File 7078, 226 p.,
 doi:10.4095/291767
Kramer, S.L. (1996): Geotechnical Earthquake Engineering; Prentice Hall, 653 p.
Lomnitz, C. (1999): The end of earthquake hazard; Seismological Research Letters, v. 70, p. 387–388.
Lyster, S. and Andriashek, L.D. (2012): Geostatistical rendering of the architecture of hydrostratigraphic
 units within the Paskapoo Formation, central Alberta; Energy Resources Conservation Board,
 ERCB/AGS Bulletin 66, 103 p., URL .

 AER/AGS Open File Report 2021-03 • 12
Mei, S. (2019): Three-dimensional property modelling of the Scollard, Paskapoo and Porcupine Hills
 formations in southwest Alberta; Alberta Energy Regulator / Alberta Geological Survey, AER/AGS
 Open File Report 2019-05, 42 p., URL .
National Research Council (2010): National Building Code of Canada 2010; National Research Council,
 Volume 2, Division B, Part 4.
Park, C.B., Miller, R.D. and Xia, J. (1999): Multichannel analysis of surface waves (MASW);
 Geophysics, v. 64, p. 800–808.
Pawley, S., Schultz, R., Playter, T., Corlett, H., Shipman, T., Lyster, S. and Hauck, T. (2018): The
 geological susceptibility of induced earthquakes in the Duvernay play; Geophysical Research
 Letters, v. 45, issue 4, p. 1786–1793, doi:10.1002/2017GL076100
Riddell, J.T.F., Andriashek, L.D., Jean, G. and Slattery, S. (2009): Preliminary results of sediment coring
 in the Edmonton-Calgary Corridor, central Alberta; Energy Resources Conservation Board, ERCB/
 AGS Open File Report 2009-17, 81 p., URL
 .
Schultz, R. and Wang, R. (2020): Newly emerging cases of hydraulic fracturing induced seismicity in the
 Duvernay East Shale Basin; Tectonophysics, v. 779, art. 228393, doi:10.1016/j.tecto.2020.228393
Schultz, R., Corlett, H., Haug, K., Kocon, K., MacCormack, K., Stern, V. and Shipman, T. (2016):
 Linking fossil reefs with earthquakes: geologic insight to where induced seismicity occurs in
 Alberta; Geophysical Research Letters, v. 43, issue 6, p. 2534–2542, doi:10.1002/2015GL067514
Schultz, R., Atkinson, G., Eaton, D.W., Gu, Y.J. and Kao, H. (2018): Hydraulic fracturing volume is
 associated with induced earthquake productivity in the Duvernay play; Science, v. 359, issue 6373,
 p. 304–308, doi:10.1126/science.aao0159
Shearer, P.M. and Orcutt, J.A. (1987): Surface and near-surface effects on seismic waves - theory and
 borehole seismometer results; Bulletin of the Seismological Society of America, v. 77, p. 1168–
 1196.
Wang, J., Li, T., Gu, Y.J., Schultz, R., Yusifbayov, J. and Zhang, M. (2020): Sequential fault reactivation
 and secondary triggering in the March 2019 Red Deer induced earthquake swarm; Geophysical
 Research Letters, v. 47, doi:10.1029/2020GL090219
Wetmiller, R.J. (1986): Earthquakes near Rocky Mountain House, Alberta, and their relationship to gas
 production facilities; Canadian Journal of Earth Sciences, v. 23, no. 2, p. 172–181, doi:10.1139/e86-
 020

 AER/AGS Open File Report 2021-03 • 13
Appendix 1 – Frontier Geosciences Inc.’s Multichannel Analysis of
Surface Waves Survey Report, Red Deer Area, AB

 AER/AGS Open File Report 2021-03 • 14
Frontier Geosciences Inc.

 MULTICHANNEL ANALYSIS OF SURFACE WAVES

 SURVEY REPORT

 RED DEER AREA, AB

 Submitted to:
 Alberta Energy Regulator
 November 8, 2019

 Authors:
 Owen Jones, GIT
 Beth Galambos, P.Geo.

 Project: FGI-1637

237 St. Georges Ave.
North Vancouver, B.C.
V7L 4T4

604 987 3037
Frontier Geosciences Inc.

 Table of Contents

1. Introduction 1

2. Seismic Refraction and Multichannel Analysis of Surface Waves (MASW) 2

 2.1 Survey Equipment 2

 2.2 Survey Procedure 2

 2.3 MASW Interpretive Method 3

4. Geophysical Results 4

 4.1 General 4

 4.2 Discussion 4

5. Limitations 7

 Illustrations

 Location
Figure 1 Survey Location Plan Appendix
Figure 2 SL19-1 Site Plan Appendix
Figure 3 Interpreted MASW Section SL19-1 Appendix
Figure 4 SL19-2 Site Plan Appendix
Figure 5 Interpreted MASW Section SL19-2 Appendix
Figure 6 SL19-3 Site Plan Appendix
Figure 7 Interpreted MASW Section SL19-3 Appendix
Figure 8 SL19-4 Site Plan Appendix
Figure 9 Interpreted MASW Section SL19-4 Appendix
Figure 10 SL19-5 Site Plan Appendix
Figure 11 Interpreted MASW Section SL19-5 Appendix
Figure 12 SL19-6 Site Plan Appendix
Figure 13 Interpreted MASW Section SL19-6 Appendix
Figure 14 SL19-7 Site Plan Appendix
Figure 15 Interpreted MASW Section SL19-7 Appendix

September, 2019 i Project No. 1637
Frontier Geosciences Inc.

1. Introduction

During the period of September 10 and September 11, 2019, Frontier Geosciences Inc. carried out a

multichannel analysis of surface waves (MASW) investigation for Alberta Energy Regulator in Red Deer, AB.

A Survey Location Plan of the area is shown at a scale of 1:300,000 in Figure 1.

The purpose of the geophysical survey was to determine shear wave velocity information of subsurface

materials across multiple sites in the Red Deer Area. Approximately 820 metres of detailed seismic MASW

data was collected along seven lines, at seven separate locations. Site Plans of individual sites showing the

line locations are presented at a scale of 1:1,500 in Figures 2, 4, 6, 8, 10, 12 and 14 in the Appendix.

September, 2019 1 Project No. 1637
Frontier Geosciences Inc.

2. Seismic Refraction and Multichannel Analysis of Surface Waves (MASW)

2.1 Survey Equipment

The MASW investigation was carried out using two Geometric Geode, 24 channel, signal enhancement

seismographs and Oyo Geospace 10 Hz geophones. Geophone intervals along the multicored seismic

cable were maintained at 2.5 metres in order to ensure high resolution data on subsurface layering.

Seismic energy was provided from a sledgehammer striking a steel plate, with shot initiation or zero time

was established by metal to metal contact of the hammer striking the plate.

2.2 Survey Procedure

Field procedure entailed setting out two 24 channel geophone cables in a straight line and implanting the

geophones. The line was traversed with the sledgehammer source, moving progressively down the array of

geophones. The seismic source was operated at each individual shotpoint and up to 48 channels of data

were recorded digitally with the seismograph. The record lengths were planned to be sufficiently long to

capture the full surface wave train. For quality assurance, field inspection of raw data after each shot was

carried out, with additional shots recorded if first arrivals were unclear. Data recorded during field

surveying operations was generally of good to excellent quality.

Throughout the survey, notes were recorded regarding seismic line positions in relation to topographic

and geological features. Relative elevations along the seismic lines were recorded by chain and

inclinometer.

September, 2019 2 Project No. 1637
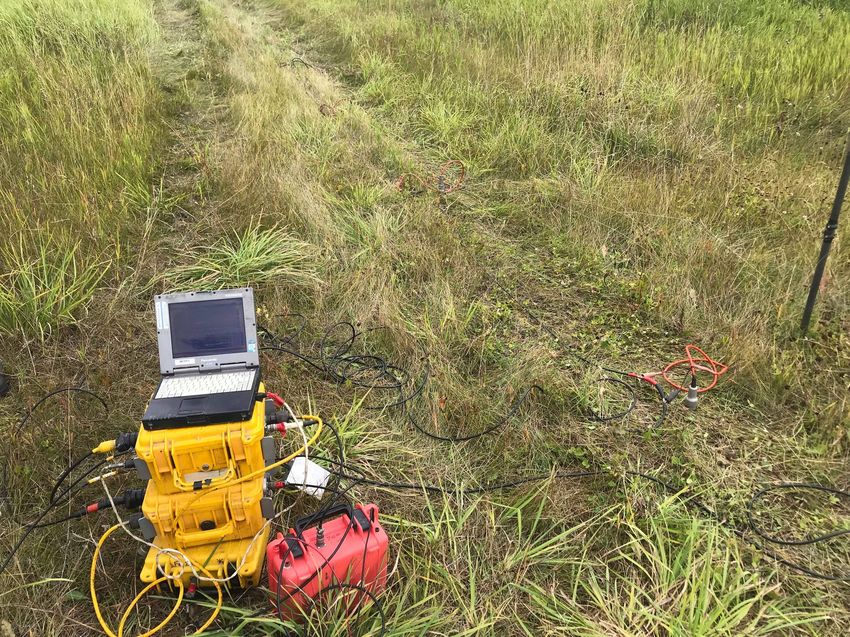
Frontier Geosciences Inc.

2.3 MASW Interpretive Method

Interpretation of the MASW data involves a wavefield transformation of the seismogram record. This

converts the seismogram from a multichannel shot gather to a dispersion curve that shows the phase

velocity of the signal as a function of frequency. The fundamental event is picked on the dispersion curve

and this data is inputted into the ParkSeis modelling program for inversion. The resulting model reveals

the shear wave layer velocity structure, and is plotted at the centre of picked geophone array. The

individual models produced are then gridded together to produce a shear wave velocity depth section

along the survey lines.

 Survey Set Up at SL-5

September, 2019 3 Project No. 1637
Frontier Geosciences Inc.

4. Geophysical Results

4.1 General

The interpreted results of the MASW lines SL19-1 to SL19-7 are illustrated in Figures 3, 5, 7, 9, 11, 13, and

15 at a scale of 1:500, in the Appendix. Corresponding individual site plans for each location are displayed

at a scale of 1:1,500 in Figures 2, 4, 6, 8, 10, 12, and 14. The shear wave velocity data are displayed as colour

contours on the profile, with cool colours indicating lower values and warm colours indicating higher

values.

4.2 Discussion

Line SL19-1 is located just northeast of Red Deer. The line runs west to east on the western side Range

Road 265, 500 metres north of Township Road 390. The interpreted MASW results for line SL19-1 is

presented in Figure 3. The shear wave velocities gradually increase with depth, displaying a range from

200 m/s at surface to 600 m/s at approximately 30 metres depth. The interpreted MASW profile displays

the 400 m/s shear wave velocity contour occurring a depth of approximately 15 metres. These velocities

are indicative of soft to stiff clays, sands and gravels, with higher velocities at depth likely corresponding to

an increase in stiffness and/or compaction.

Figure 5 displays the interpreted results of the MASW data along SL19-2. Line SL19-2 is located in south
Red Deer, running west to east parallel to Wedgewood Lane. The shear wave velocities continuously

increase with depth from approximately 220 m/s at surface, to reaching a maximum velocity of 950 m/s at

30 m depth near STN 30E. Shear wave velocities in the range of approximately 220 m/s to 600 m/s

correspond to clays, silts, sands, sands & gravels.. Higher shear wave velocities over 800 m/s are

encountered at around 25 metres depth, indicating possible clay till or the onset of shale or sandstone

bedrock.

September, 2019 4 Project No. 1637
Frontier Geosciences Inc.

Line SL19-3 is located approximately eight kilometres north of Innisfail, running south to north at the

western end of Range Road 362. Figure 7 displays the interpreted results of the MASW data along SL19-3.

The shear wave velocity profile shows the most gradual increase of all the profiles, with interpreted shear

wave velocities of 250 m/s at surface to the 400 m/s contour at an average depth of 20 metres. These

velocities are indicative sandy clays, sands, and sandy clay encountered in nearby water wells. Beneath this

contour, velocities are increase to above 700 m/s, consistent with a general increase in compaction and/or

density of soils.

Line SL19-4 is located at Gablehouse Farm & Gardens, approximately 13 kilometres southwest of Sylvan

Lake. The line runs south to north on the eastern side of the clearing east of the house. Figure 9 displays

the interpreted results of the MASW data along SL19-4. The shear wave velocity profile displays a wide

range of values from 350 m/s at surface to 1250 m/s at 30 metres below surface. Velocities increase from

around 350 m/s at surface to the 600 m/s contour at a depth of approximately 10 metres. Below this

velocities increase, much more significantly in the north of the sections, with the transition into 1000 m/s

shear velocity occurring at a depth of 29 metres at STN 10N, rising to a depth of 8 metres at STN 100N.

Figure 11 shows the interpreted results of the MASW data along SL19-5. Line SL19-5 is located

approximately 10 kilometres southeast of Sylvan Lake. The line runs south to north, south of the property

at the corner of Highway 596 and Range Road 12. The results illustrate a thick surficial layer with very

homogeneous shear wave velocities averaging approximately 350 m/s. This layer extends to an average

depth of 20 m and is consistent with stiff soils, such as clay or clay till. Beneath this layer velocities increase

quickly, reaching close to 1000 m/s at the south end of the line.

Figure 13 displays the interpreted results of the MASW data along SL19-6. Line SL19-6 is located

approximately 17 kilometres west of Red Deer. The line runs south to north, 300 metres east of the

intersection at Township Road 380 and Range Road 283. Similar to line SL19-5, the results illustrate a thick

surficial layer with velocities averaging approximately 400 m/s. This layer extends to an average depth of

25 m and is consistent with stiff to dense soils, such as clay. A minor velocity inversion is observed over the

southwestern half of the profile at approximately 15 m depth. This inversion may be due to a geological

thin layer change. A shear wave velocity high is present at depth at STN 65NE, with velocities increasing to

over 1000 m/s this may correspond to the top of sedimentary bedrock in the area.

September, 2019 5 Project No. 1637
Frontier Geosciences Inc.

Line SL19-7 is located just southeast of Red Deer. The line runs west to east on the eastern edge of Range

Road 270, halfway between Township Road 374 and 372. Figure 15 shows the interpreted results of the

MASW data along SL19-7. The shear wave velocities increase consistently with depth, ranging from 250 m/s

at surface to 1000 m/s at 30 metres depth. Velocities within this zone are consistent with stiff to hard clay,

with higher velocities indicating possible clay till, or sedimentary bedrock. The velocity layers displayed are

closely parallel to surface, with a small depression in contours observed at STN 60E. Velocities change at a

relatively uniform rate with depth. The gradual change suggests a more homogeneous lithology with an

increase in compaction, rather than a distinct compositional change.

September, 2019 6 Project No. 1637
Frontier Geosciences Inc.

5. Limitations

The multichannel analysis of surface waves (MASW) method is carried out in the Active or Passive mode

with the Active mode generally the most accurate for evaluation of shallow, shear wave velocities. For this

survey the Active mode was utilized. Limitations include reflection and scattering of surface and body

waves due to extreme surface topography and in-homogeneous conditions in the subsurface such as

boulder concentrations or isolated soil lenses with contrasting properties. The method is generally

accepted as an effective means of determining shear wave velocities of geological units.

The information in this report is based upon geophysical measurements and field procedures and our

interpretation of the data. The results are interpretive in nature and are considered to be a reasonably

accurate representation of existing subsurface conditions within the limitations of the seismic refraction

and MASW methods.

For: Frontier Geosciences Inc.

Owen Jones, GIT

Beth Galambos, P.Geo.

September, 2019 7 Project No. 1637
Frontier Geosciences Inc.

 APPENDIX
5820000N

 Lacombe

5815000N

5810000N

 Sy Blackfalds
 lv
 an
 La
5805000N ke

 SL19-1
5800000N
 Sylvan Lake

5795000N
 SL19-4 Red Deer
 SL19-5
 SL19-6
 SL19-2
5790000N

 SL19-7
5785000N

5780000N Penhold

5775000N SL19-3

5770000N

 Innisfail

5765000N

 275000E 280000E 285000E 290000E 295000E 300000E 305000E 310000E 315000E 320000E 325000E

 ALBERTA ENERGY REGULATOR
 RED DEER AREA, AB
 MASW SURVEY
 0 3 6 9 12

 KILOMETRES SURVEY LOCATION PLAN

 FRONTIER GEOSCIENCES INC.
 DATE: SEPT. 2019 SCALE 1:300,000 FIG. 1
5800580N

5800560N

5800540N

5800520N

5800500N

5800480N

5800460N

 SL19-1
5800440N

5800420N

5800400N

5800380N

5800360N

5800340N

5800320N

 314220E 314240E 314260E 314280E 314300E 314320E 314340E 314360E 314380E 314400E 314420E 314440E

 ALBERTA ENERGY REGULATOR
 RED DEER AREA, AB
 0 15 30 45 60 MASW SURVEY
 METRES
 SL19-1 SITE PLAN

 FRONTIER GEOSCIENCES INC.
 DATE: SEPT. 2019 SCALE 1:1,500 FIG. 2
910

 4 5 6 7 8 9 10 11 12 13 14 15 16 17 18 19 20 21 22 23 24 25 26 27 28 29 30 31 32 33 34 35 36 37 38 39 40 41 42 43 44
 900
APPROXIMATE ELEVATION (m)

 250 250

 890 250

 400
 400

 400
 880

 600
 600
 870
 10E 20E 30E 40E 50E 60E 70E 80E 90E 100E
 DISTANCE (m)

 100 325 550 782 1500
 SHEAR WAVE VELOCITY (m/s) ALBERTA ENERGY REGULATOR
 RED DEER AREA, AB
 MASW SURVEY

 0 5 10 15 20
 INTERPRETED MASW SECTION
 SL19-1
 METRES
 FRONTIER GEOSCIENCES INC.
 DATE: SEPT. 2019 SCALE 1:500 FIG. 3
5790140N

5790120N

5790100N

5790080N

5790060N

5790040N

5790020N SL19-2

5790000N

5789980N

5789960N

5789940N

5789920N

5789900N

5789880N
 306280E 306300E 306320E 306340E 306360E 306380E 306400E 306420E 306440E 306460E 306480E 306500E

 ALBERTA ENERGY REGULATOR
 RED DEER AREA, AB
 0 15 30 45 60 MASW SURVEY
 METRES
 SL19-2 SITE PLAN

 FRONTIER GEOSCIENCES INC.
 DATE: SEPT. 2019 SCALE 1:1,500 FIG. 4
900

 35 36 37 38 39 40 41 42 43 44
 250 28 29 30 31 32 33 34
 4 5 6 7 8 9 10 24 25 26 27
 11 12 13 14 15 16 17 18 19 20 21 22 23
APPROXIMATE ELEVATION (m)

 890

 250
 250
 250

 880
 400 400
 400

 600
 600
 600

 870
 800

 800

 10E 20E 30E 40E 50E 60E 70E 80E 90E 100E
 DISTANCE (m)

 100 325 550 782 1500
 SHEAR WAVE VELOCITY (m/s) ALBERTA ENERGY REGULATOR
 RED DEER AREA, AB
 MASW SURVEY

 0 5 10 15 20
 INTERPRETED MASW SECTION
 SL19-2
 METRES
 FRONTIER GEOSCIENCES INC.
 DATE: SEPT. 2019 SCALE 1:500 FIG. 5
5774760N

5774740N

5774720N

5774700N

5774680N

5774660N

5774640N
 SL19-3

5774620N

5774600N

5774580N

5774560N

5774540N

5774520N

5774500N
 296500E 296520E 296540E 296560E 296580E 296600E 296620E 296640E 296660E 296680E 296700E 296720E

 ALBERTA ENERGY REGULATOR
 RED DEER AREA, AB
 0 15 30 45 60 MASW SURVEY
 METRES
 SL19-3 SITE PLAN

 FRONTIER GEOSCIENCES INC.
 DATE: SEPT. 2019 SCALE 1:1,500 FIG. 6
950

 8 9 10 11 12 13 14 15 16 17 18 19 20 21 22 23 24 25 26 27 28 29 30 31 32 33 34 35 36 37 38 39 40 41 42 43
 4 5 6 7 44
APPROXIMATE ELEVATION (m)

 250 250
 940
 250

 930
 400

 400
 400

 600
 920

 800

 10N 20N 30N 40N 50N 60N 70N 80N 90N 100N
 DISTANCE (m)

 100 325 550 782 1500
 SHEAR WAVE VELOCITY (m/s) ALBERTA ENERGY REGULATOR
 RED DEER AREA, AB
 MASW SURVEY

 0 5 10 15 20
 INTERPRETED MASW SECTION
 SL19-3
 METRES
 FRONTIER GEOSCIENCES INC.
 DATE: SEPT. 2019 SCALE 1:500 FIG. 7
5791860N

5791840N

5791820N

5791800N

5791780N

5791760N

5791740N SL19-4

5791720N

5791700N

5791680N

5791660N

5791640N

5791620N

5791600N
 692060E 692080E 692100E 692120E 692140E 692160E 692180E 692200E 692220E 692240E 692260E

 ALBERTA ENERGY REGULATOR
 RED DEER AREA, AB
 0 15 30 45 60 MASW SURVEY
 METRES
 SL19-4 SITE PLAN

 FRONTIER GEOSCIENCES INC.
 DATE: SEPT. 2019 SCALE 1:1,500 FIG. 8
990
 4 5 6 7 8 9 10 11 12 13 14 15 16 17 18 19 20 21 22 37 38 39 40 41 42 43 44
 23 24 25 26 27 28 29 30 31 32 33 34 35 36
APPROXIMATE ELEVATION (m)

 400 400
 600
 980 600 800
 600
 800 1000

 800

 970
 1000
 00
 10

 960

 10N 20N 30N 40N 50N 60N 70N 80N 90N 100N
 DISTANCE (m)

 100 325 550 782 1500
 SHEAR WAVE VELOCITY (m/s) ALBERTA ENERGY REGULATOR
 RED DEER AREA, AB
 MASW SURVEY

 0 5 10 15 20
 INTERPRETED MASW SECTION
 SL19-4
 METRES
 FRONTIER GEOSCIENCES INC.
 DATE: SEPT. 2019 SCALE 1:500 FIG. 9
5792240N

5792220N

5792200N

5792180N

5792160N

5792140N

5792120N SL19-5

5792100N

5792080N

5792060N

5792040N

5792020N

5792000N

5791980N
 701880E 701900E 701920E 701940E 701960E 701980E 702000E 702020E 702040E 702060E 702080E

 ALBERTA ENERGY REGULATOR
 RED DEER AREA, AB
 0 15 30 45 60 MASW SURVEY
 METRES
 SL19-5 SITE PLAN

 FRONTIER GEOSCIENCES INC.
 DATE: SEPT. 2019 SCALE 1:1,500 FIG. 10
950
 35 36 37 38 39 40 41 42 43 44
 7 8 9 10 11 12 13 14 15 16 17 18 19 20 21 22 23 24 25 26 27 28 29 30 31 32 33 34
 4 5 6
APPROXIMATE ELEVATION (m)

 940

 930
 400

 400
 600 400

 920 600
 800

 800

 10N 20N 30N 40N 50N 60N 70N 80N 90N 100N
 DISTANCE (m)

 100 325 550 782 1500
 SHEAR WAVE VELOCITY (m/s) ALBERTA ENERGY REGULATOR
 RED DEER AREA, AB
 MASW SURVEY

 0 5 10 15 20
 INTERPRETED MASW SECTION
 SL19-5
 METRES
 FRONTIER GEOSCIENCES INC.
 DATE: SEPT. 2019 SCALE 1:500 FIG. 11
5791020N

5791000N

5790980N

5790960N

5790940N

5790920N

 -6
5790900N
 SL19

5790880N

5790860N

5790840N

5790820N

5790800N

5790780N

5790760N

 299280E 299300E 299320E 299340E 299360E 299380E 299400E 299420E 299440E 299460E 299480E 299500E

 ALBERTA ENERGY REGULATOR
 RED DEER AREA, AB
 0 15 30 45 60 MASW SURVEY
 METRES
 SL19-6 SITE PLAN

 FRONTIER GEOSCIENCES INC.
 DATE: SEPT. 2019 SCALE 1:1,500 FIG. 12
4 5 6 7 8 9 10 11 12 13 14 15 16 17 18 19 20 21 22 23 24 25 26 27 28 29 30 31 32 33 34 35 36 37 38 39 40 41 42 43 44
 940
 400
APPROXIMATE ELEVATION (m)

 930 400

 400
 400

 920

 600

 0
 600

 60
 800

 910 1000

 10NE 20NE 30NE 40NE 50NE 60NE 70NE 80NE 90NE 100NE
 DISTANCE (m)

 100 325 550 782 1500
 SHEAR WAVE VELOCITY (m/s) ALBERTA ENERGY REGULATOR
 RED DEER AREA, AB
 MASW SURVEY

 0 5 10 15 20
 INTERPRETED MASW SECTION
 SL19-6
 METRES
 FRONTIER GEOSCIENCES INC.
 DATE: SEPT. 2019 SCALE 1:500 FIG. 13
5785460N

5785440N

5785420N

5785400N

5785380N

5785360N

 SL19-7
5785340N

5785320N

5785300N

5785280N

5785260N

5785240N

5785220N

5785200N
 314120E 314140E 314160E 314180E 314200E 314220E 314240E 314260E 314280E 314300E 314320E 314340E

 ALBERTA ENERGY REGULATOR
 RED DEER AREA, AB
 0 15 30 45 60 MASW SURVEY
 METRES
 SL19-7 SITE PLAN

 FRONTIER GEOSCIENCES INC.
 DATE: SEPT. 2019 SCALE 1:1,500 FIG. 14
4 5 6 7 8 9 10 11 12 13 14 15 16 17 18 19 20 21 22 23 24 25 26 27 28 29 30 31 32 33 34 35 36 37 38 39 40 41 42 43 44
 930
APPROXIMATE ELEVATION (m)

 400
 400 400

 920

 0
 600 60

 910 60
 0

 800
 800

 1000
 900

 10E 20E 30E 40E 50E 60E 70E 80E 90E 100E
 DISTANCE (m)

 100 325 550 782 1500
 SHEAR WAVE VELOCITY (m/s) ALBERTA ENERGY REGULATOR
 RED DEER AREA, AB
 MASW SURVEY

 0 5 10 15 20
 INTERPRETED MASW SECTION
 SL19-7
 METRES
 FRONTIER GEOSCIENCES INC.
 DATE: SEPT. 2019 SCALE 1:500 FIG. 15
You can also read