Crystallographic texture dependent bulk anisotropic elastic response of additively manufactured Ti6Al4V
←
→
Page content transcription
If your browser does not render page correctly, please read the page content below
www.nature.com/scientificreports
OPEN Crystallographic texture dependent
bulk anisotropic elastic response
of additively manufactured Ti6Al4V
Mangesh V. Pantawane1,3, Teng Yang2,3, Yuqi Jin2, Sameehan S. Joshi1,3, Sriswaroop Dasari1,
Abhishek Sharma1, Arkadii Krokhin2, Srivilliputhur G. Srinivasan1, Rajarshi Banerjee1,3,
Arup Neogi2,3 & Narendra B. Dahotre1,3*
Rapid thermokinetics associated with laser-based additive manufacturing produces strong bulk
crystallographic texture in the printed component. The present study identifies such a bulk texture
effect on elastic anisotropy in laser powder bed fused Ti6Al4V by employing an effective bulk modulus
elastography technique coupled with ultrasound shear wave velocity measurement at a frequency
of 20 MHz inside the material. The combined technique identified significant attenuation of shear
velocity from 3322 ± 20.12 to 3240 ± 21.01 m/s at 45◦ and 90◦ orientations of shear wave plane
with respect to the build plane of printed block of Ti6Al4V. Correspondingly, the reduction in shear
modulus from 48.46 ± 0.82 to 46.40 ± 0.88 GPa was obtained at these orientations. Such attenuation is
rationalized based on the orientations of α ′ crystallographic variants within prior columnar β grains in
additively manufactured Ti6Al4V.
Although various additive manufacturing (AM) techniques associated with distinct physical phenomena have
emerged, the laser powder bed fusion (LPBF) based AM is widely explored as it offers significant control over
the geometric tolerance of the printed c omponent1–4. Additionally, in LPBF-AM, a broad spectrum of process
parameters allows monitoring the set of properties of the printed part5–7. LPBF-AM, by its principle nature,
yields smaller melt pool dimensions (∼ 30–100 µm in depth and ∼ 80–400 µm in width) in a significantly large
volume of powder, which in turn leads to a rapid cooling rates (105–107 K/s) and steeper thermal gradients (105
–107 K/m)3,7. Such rapid thermokinetics often result in microstructural anisotropy (texture) and heterogeneity,
impacting the macroscopic physical p roperties8. These effects are mitigated by adjusting process parameters as
well as by post-processing treatments. However, evaluating these aspects at every step is often carried out via
X-ray diffraction, neutron diffraction, and electron backscattered diffraction (EBSD), where the sample prepara-
tion needs machining and polishing that can potentially modify the intrinsic structure produced during A M9,10.
Moreover, the measurements via these techniques are limited to the surface/subsurface region and not representa-
tive of the entire component. Especially, these issues remain valid for evaluation of average static elastic constants
that involves destructive and quasi-destructive t estings11. Furthermore, the elastic constants evaluated using
additively-printed tensile specimens may not represent the actual properties of the AM-component of different
geometry when printed with the same set of process parameters. This is a likelihood as the spatial heterogeneity
and anisotropy in the resultant microstructure are produced in the additively-printed tensile specimen. In addi-
tion, determination of the static elastic constants may not be a reliable choice for the components undergoing
rapidly-varying and dynamic loading conditions during their applications.
Accounting the above-mentioned scenario, the non-destructive techniques (NDT) such as ultrasound tech-
nique is imperative to recognize bulk dynamic and anisotropic responses of the AM component. The ultra-
sound technique involves propagation of waves through the material to be evaluated either with longitudinal
or transverse polarization to provide a non-destructive mechanical stimulus to the material whose response is
aves12,13. These responses include changing the attenuation coefficient,
reflected as a characteristic change of w
amplitude, and velocity of the ultrasonic wave, primarily due to scattering. These characteristics are influenced
by the directionally varying crystallographic arrangements and the multidimensional defects, including vacan-
cies, dislocations, coherent and incoherent phase/grain boundaries, and process-induced defects such as cracks
and porosity12. So far, the bulk anisotropy has been explored using the ultrasound technique for single crys-
tals, textured materials processed via thermomechanical treatments, and w eldments14–17. Experimentally, the
1
Department of Materials Science and Engineering, University of North Texas, Denton, TX 76207,
USA. 2Department of Physics, University of North Texas, Denton, TX 76203, USA. 3Center for Agile and Adaptive
Additive Manufacturing, University of North Texas, Denton, TX 76207, USA. *email: narendra.dahotre@unt.edu
Scientific Reports | (2021) 11:633 | https://doi.org/10.1038/s41598-020-80710-6 1
Vol.:(0123456789)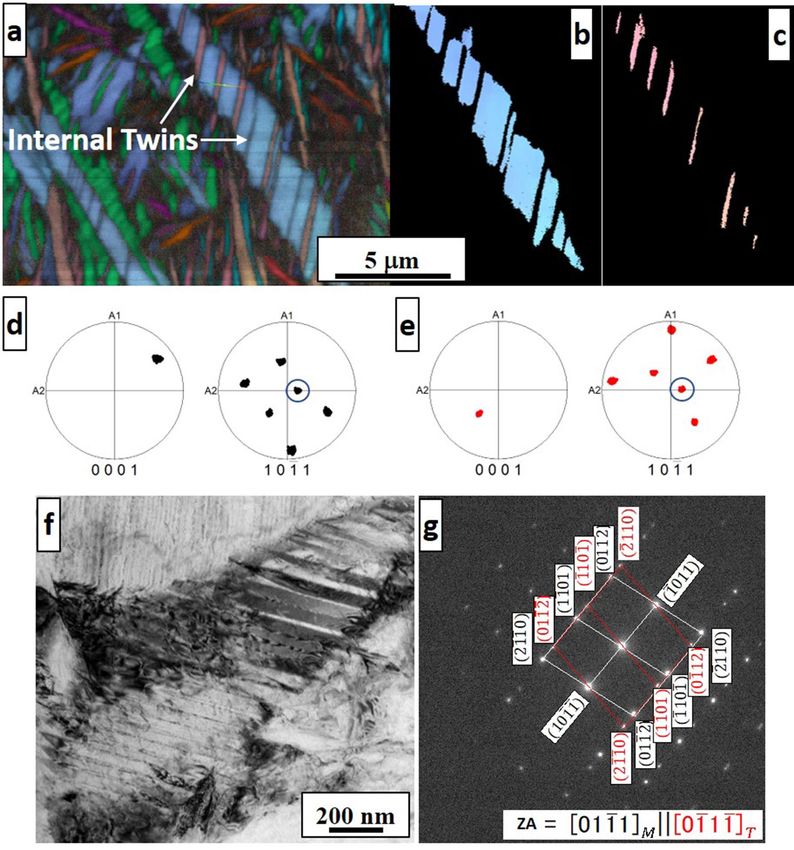
www.nature.com/scientificreports/
characteristics of ultrasound waves propagating through the material are monitored by varying the orientation
of either longitudinal or shear ultrasound waves16. This technique is also useful in determining the grain size
along with the crystallographic texture of the material, for which primarily the change in wave velocity, ampli-
tude, and attenuation coefficient have been a nalyzed17,18. The use of ultrasound waves has been further evolved
as the general convolution approach for validation of its capability to capture the bulk crystallographic texture
information19–21. These studies have consistently reported qualitative comparison of ultrasound technique in
line with EBSD and neutron diffraction outcome. Moreau et al.22 quantitatively indicated the accuracies within 2
degrees for the crystallographic orientation measured by ultrasound techniques when compared to EBSD. In the
LPBF-AM technique, the thermokinetically-induced crystallographic texture is prominent, which also unveils
various crystallographic traits pertaining to distinct directions. In light of this, the present paper focuses on the
bulk crystallographic texture and associated elastic anisotropy effect in the laser powder bed fused additively
manufactured (LPBF-AM) Ti6Al4V alloy. These efforts are accomplished with the aid of recently developed
effective bulk modulus elastography (EBME) technique coupled with ultrasonic shear wave propagation in
LPBF-AM Ti6Al4V alloy23,24. The investigation further correlates the effect of crystallographic variant on the
microstructural morphology and the elastic anisotropy of LPBF-AM Ti6Al4V alloy.
Methods and materials
LPBF printing of a cubical block (38 mm3 ) of Ti6Al4V was carried out in AconityMIDI AM system ( a continu-
ous wave Nd:YAG laser, Gaussian energy distribution, wavelength of 1070 nm, beam diameter of 85 µm (D4σ ))
using unimodal, and ultra-low interstitial grade 23, Ti6Al4V alloy powder (average particle size of 15–45 µm
and composition of Al5.5–6.5; V3.5–4.5; O ≤ 0.13; C ≤ 0.08; H ≤ 0.012; Fe ≤ 0.25; N ≤ 0.05; and Ti Balance,
all in weight %) obtained from Carpenter Technology. The build chamber was maintained under ultra pure Ar
atmosphere (O2 < 50 ppm) throughout LPBF-AM process. The laser power and the scanning speed were kept
constant at 150 W and 800 mm/s respectively. The laser scanning direction was reversed after each laser track
(bidirectional) and this scan pattern was rotated by 90◦ between subsequent layers (Fig. 1a). The center to center
distance (hatch spacing) between the adjacent laser tracks was 120 µm. Combination of these laser processing
parameters generated laser energy density of 52.08 J/mm3 on the sample surface. Further details about the LPBF-
AM process can be located in previous publication by the a uthors3,4. In order to conduct post LPBF-AM process,
NDT and microstructural characterization/analysis, the AM printed Ti6Al4V cubical block was separated from
the circular build plate using electrode discharge machining.
The elastic properties of LPBF-AM Ti6Al4V samples were analyzed in a non destructive manner by coupling
two types ultrasonic techniques: 1. Effective Bulk Modulus Elastography (EBME) using longitudinal waves and
2. Shear wave propagation in the material (Fig. 1b,c). EBME was performed using a 20 MHz immersion based
Olympus Panametrics V312 transducer of 3mm diameter (Fig. 1b) whereas shear wave velocity was measured
using Olympus Panametrics V211 0.125-in. diameter 20 MHz defocused shear transducer (Fig. 1c). All the
scans were performed on the cube faces (YZ and XZ planes) parallel to the LPBF build direction (Z). In case
of EBME, a JSR Ultrasonic DPR 300 Pulse/ Receiver operated the pulse source and time trigger. The data was
collected by a Tektronix MDO 3024b oscilloscope. The scanning rate was 512 signals per 20 seconds. On the
other hand, shear wave velocity was scanned at multiple location (6 × 3 locations on YZ plane of the cube at an
interval of 3.5 mm). At each location, polarized plane of shear wave was rotated around X-axis in the range of
0–90◦ with an interval of 22.5◦ with respect to the build plane (XY) as depicted in Fig. 1c. The angular resolution
of the equipment was 0.5◦.
With EBME technique23,24, the average bulk density ρ and dynamic bulk modulus Kd were calculated at
different locations of the cube face (YZ) by probing its acoustic impedance (Z) and using the classical speed of
sound theory: Kd = Zc and ρ = Z/c, where c is the velocity of sound in the material (Fig. 1b). The ambient deion-
ized water provides stable values of impedance while probing. The emitted pulse envelope by the transducer is
separated into two echoes at the front and rear interfaces of the block due to an impedance contrast between the
sample material and the deionized water. The sample acoustic impedance ( Z1) can be calculated by the known
acoustic impedance Z0 (Pa.s/m) of deionized water and the ratio of the second echo and the difference between
the emitted wave with the first echo as given in Eq. (1)
√
Z1 −1 − α − 4α + 1
= (1)
Z0 α−2
where α = Pe −(Z1 −Z0 )|P0 | is the experimental factor calculated using Pe , which is the sound pressure of the emis-
P1
sion source, and P0 and P1 are experimentally measured sound pressures (Pa) of the first and second reflection
from the front and rear surface of the block.
The temporal delay of the two reflected envelopes and the longitudinal speed of sound CL (m/s) allows cal-
culating Kd (Pa) and ρ (kg/m3 ) using Eqs. (2) and (3), respectively.
√
−1 − α − 4α + 1
Kd =CL Z0 (2)
α−2
√
Z0 −1 − α − 4α + 1
ρ= (3)
CL α−2
With this bulk density ρ (kg/m3 ) and the shear wave velocity CT (m/s) measured at a given location with different
orientations of polarized shear wave plane, the dynamic shear modulus can be obtained as follows:
Scientific Reports | (2021) 11:633 | https://doi.org/10.1038/s41598-020-80710-6 2
Vol:.(1234567890)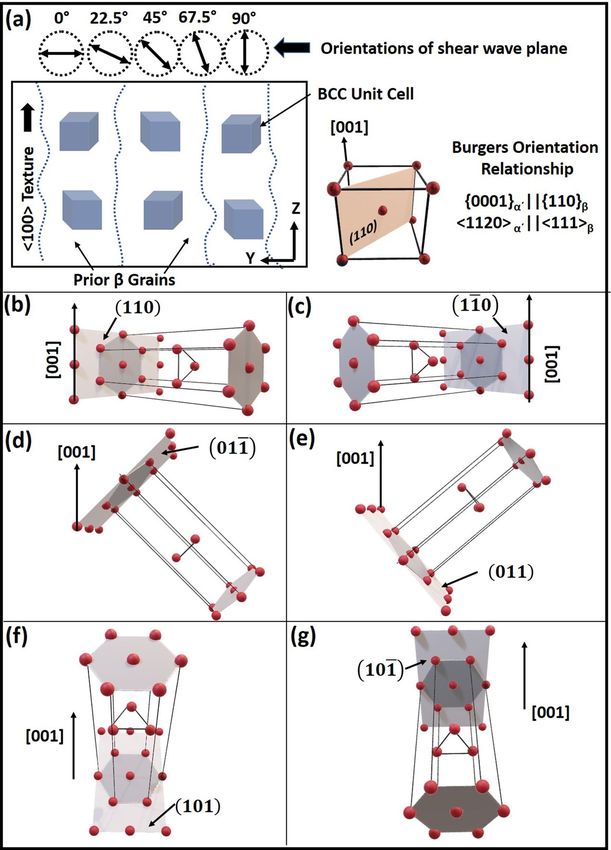
www.nature.com/scientificreports/
Figure 1. Set of schematics illustrating (a) the process of laser powder bed fusion, (b) setup for performing
elastic bulk modulus elastography, and (c) experimental arrangement for measuring velocity of sound using
shear waves.
Gd = ρCT 2 (4)
Similarly for comparison purpose, ultrasonic measurements were also carried out on the reference wrought
Ti6Al4V plate. Here it should be noted that the as received wrought Ti6Al4V was in an annealed condition, and
it possessed equiaxed grain texture.
To get insights into microstructure and crystallographic texture and interpret the data from ultrasonic meas-
urements, the LPBF-AM samples were sectioned in XZ plane using an oil cooled slow speed diamond laced wheel
saw. The sectioned samples were placed in epoxy mounts and prepared using protocol described in previous
paper by the authors3. The microstructure was observed in FEI Nova NanoSEM 230 equipped with a Hikari
super electron backscatter diffraction (EBSD) detector operated at 20 kV and spot size of 6. The sample was
mounted on 70◦ pre-tilted holder and kept at a working distance of 12 mm. The EBSD analysis was performed
using scanning step size of 0.5 µm. The inverse pole figure maps and pole figures were generated from the EBSD
data with the aid of TSL OIM Analysis 8.0 software. A numerical reconstruction of the parent phase structure
and corresponding pole figure were determined by using MTEX (version 5.5), an opensource Matlab toolbox25.
The reconstruction was mainly based on the Burgers orientation relationship between the parent and the product
phase. Transmission Electron Microscopy (TEM) was carried out using 200kV FEI Tecnai G2 TF20. The sample
preparation for TEM was done by using the FEI Nova 200 dual-beam focused ion beam (FIB).
Scientific Reports | (2021) 11:633 | https://doi.org/10.1038/s41598-020-80710-6 3
Vol.:(0123456789)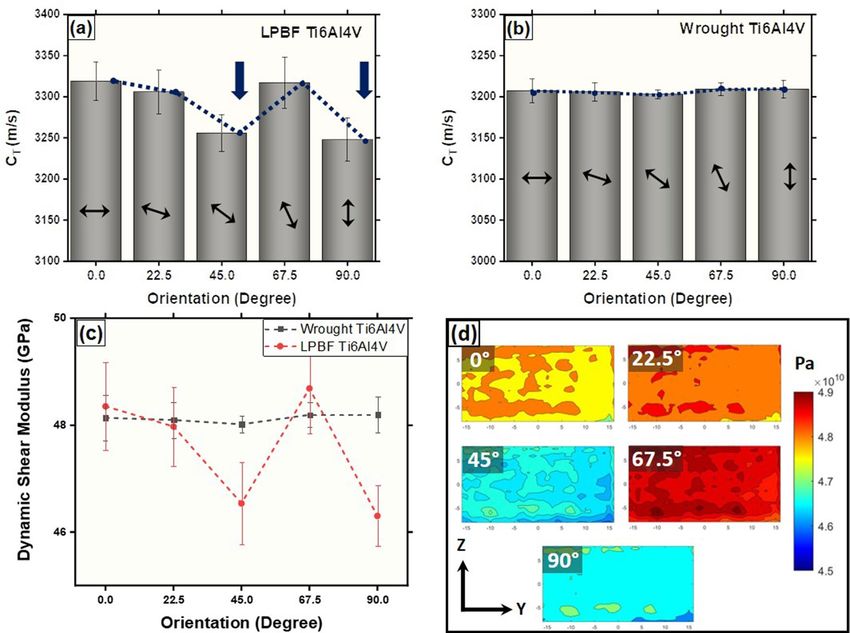
www.nature.com/scientificreports/
Figure 2. Variation in velocity of shear waves as a function of shear wave plane orientation with respect to build
plane normal for (a) LPBF-AM Ti6Al4V and (b) wrought reference Ti6Al4V sample and (c) corresponding
shear modulii of wrought and LPBF-AM Ti6Al4V. (d) Shear modulus contour maps on YZ plane of LPBF-AM
Ti6Al4V cube at different shear wave plane orientations.
Results and discussion
The preliminary results on phase evolution in LPBF-AM Ti6Al4V examined using X-ray diffraction, transmission
electron microscopy, and atom probe tomography have been reported in previous publications by the a uthors3,4.
These findings indicated the predominant presence of hierarchical hcp α ′ martensite laths under rapid cooling
rates (2.56 × 10⁷ – 4.82 × 10⁴ K/s). Moreover, the results indicated the evolution of anisotropic crystallographic
texture due to steeper thermal gradients (1.48 × 10⁶– 1.58 × 10⁷ K/m) in the AM process. In order to understand
the orientation-dependent elastic behavior, the printed block was subjected to ultrasonic scanning on four faces
in the sets of XZ and YZ planes and compared against the reference wrought Ti6Al4V sample. The shear wave
velocity (CT ) remained nearly same (3322 ± 20.12 m/s) for the wave plane (plane of vibration and direction of
wave propagation) oriented at angles of 0 ◦ and 22.5◦ with respect to the build plane (XY) (Fig. 2a). Interestingly,
there was a marked drop in the shear wave velocity (3245 ± 22.16 m/s) when the wave plane was aligned at 45◦
(Fig. 2a). At the wave plane orientation of 67.5◦ , the shear wave velocity increased (3330 ± 19.45 m/s) back to
nearly similar values as that at 0 ◦ and 22.5◦ orientations. Subsequently, again a drop in the velocity (3240 ±
21.01 m/s) nearly equal to that at 45◦ was measured at 90◦ orientation (Fig. 2a).
Contrary to the above measurements, the shear wave velocity nearly remained constant (3206 ± 10.12 m/s)
for all the angular orientations in the reference wrought Ti6Al4V sample (Fig. 2b). As the density measure-
ment via the EBME technique (ρ = Z/c) marginally varied (LPBF-AM Ti6Al4V-4390 ± 60 kg/m 3 and Wrought
Ti6Al4V-4680 ± 30 kg/m3 ), the dynamic shear modulus calculated using Eq. (3) followed the trend similar to
shear wave velocity as function of angular orientation in both LPBF-AM and wrought Ti6Al4V samples (Fig. 2c).
Additional shear modulus contour maps corresponding to different shear wave plane orientation scanning on YZ
plane of the LPBF-AM Ti6Al4V are presented in Fig. 2d. Based on the color legend, the significant variation in
shear modulus can be noticed at 45◦ and 90◦ orientations of shear wave plane. Here it is noteworthy that under
the set of LPBF-AM processing parameters employed in the present work, apparently, the three-dimensional
defects such as cracks and porosity were not generated as they were neither detected by EBME technique nor by
electron microscopy observations thereby indicating a marginal variation in the average density 4390 ± 60 kg/
m3 . The dynamic bulk modulus, Kd (Kd = Zc) was estimated using the data generated through EBME tests. With
these orientation-dependent dynamic shear modulus and the dynamic bulk modulus, other elastic constants
such as dynamic Young’s modulus and dynamic Poisson’s ratio for LPBF-AM Ti6Al4V were calculated using
elastic constants relations and are presented in Table 1. These observations suggested that there was a preferential
crystallographic arrangement with respect to the build direction, causing a characteristic variation in the shear
Scientific Reports | (2021) 11:633 | https://doi.org/10.1038/s41598-020-80710-6 4
Vol:.(1234567890)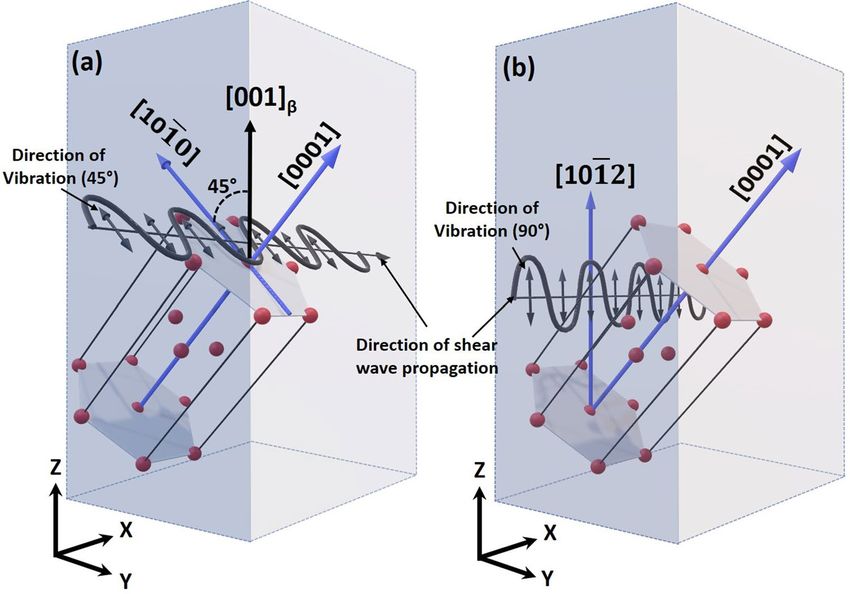
www.nature.com/scientificreports/
Dynamic Shear modulus Dynamic Youngs modulus Dynamic Bulk modulus
Orientation (°) (GPa) (GPa) Dynamic Poissons ratio (GPa)
0 48.46 ± 0.82 124.96 ± 1.84 0.302 ± 0.002 102.44 ± 0.68
22.5 48.08 ± 0.74 124.71 ± 1.66 0.304 ± 0.001 102.44 ± 0.68
45 46.64 ± 0.76 120.84 ± 1.73 0.309 ± 0.001 102.44 ± 0.68
67.5 48.80 ± 0.98 123.99 ± 1.99 0.305 ± 0.003 102.44 ± 0.68
90 46.40 ± 0.88 120.31 ± 1.95 0.310 ± 0.002 102.44 ± 0.68
Table 1. Orientation dependent dynamic elastic moduli of LPBF-AM Ti6Al4V.
Figure 3. (a) SEM and (b) EBSD IPF map of LPBF-AM Ti6Al4V cube from YZ-plane and (c) corresponding
and (d) additional 0001 pole figure texture plots from YZ-plane. (e) Numerically reconstructed prior β inverse
pole figure map using Mtex toolbox 5.525 and (f) corresponding 001 pole figure.
wave velocity within a LPBF-AM Ti6Al4V. It has been reported that shear waves transmitted through the sam-
ples can attenuate due to the presence of lattice discontinuities such as grain and phase boundaries12. Moreover,
crystallographic texture can have a strong influence on the shear wave velocity depending on the orientation
of crystallographic planes with respect to direction of wave propagation and vibration. With this perspective,
the LPBF-AM Ti6Al4V samples were sectioned along with the faces (YZ and XZ) for microscopy observations
using SEM/EBSD techniques.
As the laser beam scanning pattern was rotated through 90◦ in each subsequent layer, the microstructure
and crystallographic texture in average remained consistent on the side face (XZ and YZ) of the cubical block.
The representative SEM micrograph captured from the YZ plane of LPBF-AM Ti6Al4V cube is presented in
Fig. 3a, which revealed the martensitic laths ( α ′ ) within a prior columnar β grains oriented along the build
direction Z. The high magnification SEM micrograph as an inset of Fig. 3a indicates that these martensitic laths
are extensively internally twinned. Also, the EBSD inverse pole figure (IPF) map generated from the same YZ
plane of LPBF-AM Ti6Al4V cube consistently revealed the columnar prior β grains laden with martensitic laths
(Fig. 3b). Corresponding and additional 0001 pole figure texture plots generated from the other region of the
YZ plane of LPBF-AM Ti6Al4V cube are presented in Fig. 3c and 3d. The reconstructed prior β grain structure
mainly revealed the columnar grain morphology with major fraction of texture as presented in Fig. 3e,f.
The length of the martensitic laths as measured from the IPF maps varied in the range of 20–60 µm while their
width remained between 1–4 µm range. In addition, the physical orientation of martensitic laths was consist-
ently at ∼ 45◦ or 90◦ to the prior β boundaries (Fig. 3a,b). The pole figure texture plots corresponding to the
HCP martensitic phase (α ′ ) indicated predominant orientation along , , and directions in
different regions of YZ plane of LPBF-AM Ti6Al4V cube (Fig. 3c,d) suggesting that basal plane {0001}, primary
{101̄0} and secondary prismatic {112̄0} planes are primarily parallel to the YZ plane of the LPBF-AM Ti6Al4V
Scientific Reports | (2021) 11:633 | https://doi.org/10.1038/s41598-020-80710-6 5
Vol.:(0123456789)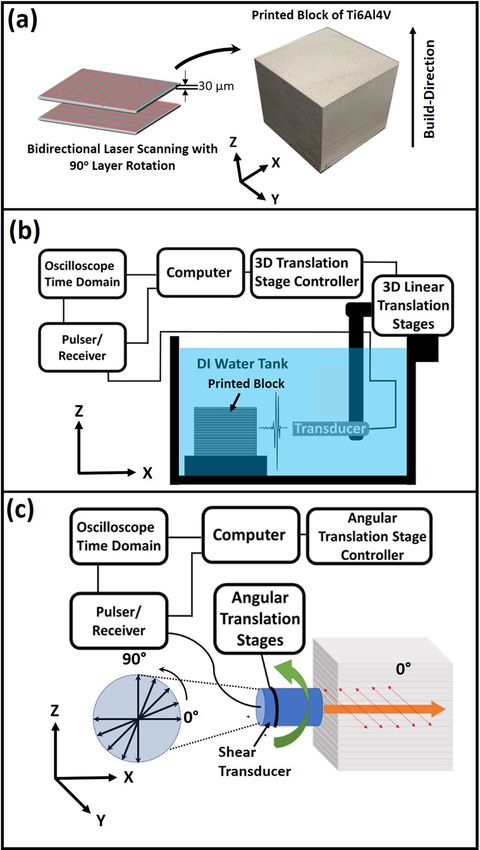
www.nature.com/scientificreports/
Figure 4. High resolution SEM-EBSD analysis of internally twinned martensite plates in the LPBF-AM
Ti6Al4V sample. (a) Shows an inverse pole figure map with multiple internally twinned martensite plates. (b, c)
Show IPF maps of a single plate with the matrix region and twinned region, respectively. Corresponding pole
figures showing the {0001} and {101̄1} poles of the matrix region of the plate (d), and the twinned region of
same plate (e), exhibit a common {101̄1} pole (marked with open circles). (f) Bright-field TEM image showing
a high density of twins within a single martensite plate (g) Corresponding electron diffraction pattern recorded
along a common [101̄1] type zone axis for both the matrix and the twin orientations.
cube. In addition, the nature of internal twins within the martensite was investigated with high resolution
SEM-EBSD and TEM analyses as presented in Fig. 4. The inverse pole figure map of single internally twinned
martensite (Fig. 4a) was selectively analyzed for its matrix (Fig. 4b) and twinned region (Fig. 4c). Corresponding
pole figures along {0001} (Fig. 4d) and {101̄1} (Fig. 4e) exhibited common {101̄1} pole (marked by open circles)
in the twinned and the matrix region of the same martensite plate. Further analysis using TEM also confirmed
the presence of internal twins as presented in the bright-field TEM image of Fig. 4f and corresponding electron
diffraction pattern recorded a common [101̄1] type zone for both twin and matrix orientation (Fig. 4g). These
commonly found 101̄1 type of twins in the LPBF-AM Ti6Al4V can be related to the transformation induced twins
to accommodate the invariant plane strain due to the extremely rapid thermokinetic associated with LPBF-AM
technique3,4. However, as the severe thermal stresses are also likely to be generated during subsequent multiple
thermal cycles due to multi-track and multi-layer LPBF AM process, there is also a reasonable possibility of
evolution of thermal deformation induced twins. A detailed investigation of the nature and evolution of such
Scientific Reports | (2021) 11:633 | https://doi.org/10.1038/s41598-020-80710-6 6
Vol:.(1234567890)www.nature.com/scientificreports/
twins in LPBF-AM Ti6Al4V under multiple thermal cycles is undergoing and will be separately reported in due
course of time.
The average elastic stiffnesses in different orientations (along and perpendicular to the build directions) were
estimated from the polycrystalline IPF maps using the TSL-OIM analysis 8.0 software, which considers the single
crystal data. Using multiple plot of IPF maps (5), the average elastic stiffness obtained for uniaxial tension along
the build direction (Z) was 81.56 ± 10.62 GPa, whereas the average elastic elastic stiffness perpendicular (Y) to
the build direction was 102.91 ± 8.01 GPa. These estimations follow the trend similar to that of experimentally
observed variation in shear modulus (Fig. 2c), where the shear modulus drops at 90◦ orientation (Z) of shear wave
plane to the build plane. With these observations, attempts are made to further analyze and propose rationale
for the observed bulk elastic anisotropy in LPBF-AM Ti6Al4V.
The extent of scattering of the ultrasound shear wave is dependent on the grain size of the material, suggesting
how far the crystallographic defects are spaced compared to its wavelength. In LPBF-AM Ti6Al4V, the width of
columnar prior β grains varied in the range of 30–80 µm, while the martensitic laths possessed the dimensions
of 1–4 µm (width) and 20–60 µm (length) (Fig. 3a,b). These final dimensions of the martensitic laths observed in
the microstructure are the result of multiple thermal cycle experienced by each region of the printed component
due to the multi-track and multi-layer nature of LBPF-AM technique. The multiple thermal cycle experienced
by each region in LPBF-AM Ti6Al4V may have coarsen the martensite dimensions in each of the subsequent
thermal cycles. In addition, internal twins with coherent boundaries within the martensitic laths are spaced at
nanoscale dimensions (Figs. 3a, 4)4. Thus, an ultrasound shear wave of wavelength of ∼170 µm (estimated based
on the velocity of the shear wave in Ti6Al4V) is likely to undergo multiple types of scatterings as it encounters
these crystallographic defects at different intervals. These scatterings may involve Rayleigh scattering (occurs
when grain size), stochastic scattering (occurs when ∼ grain size), and diffusive scattering (occurs when <
grain size)15. Furthermore, reportedly high LPBF-AM process-inherent defect density4 is likely to scatter the
shear wave and attenuate its velocity. However, as these defects are ubiquitous in the LPBF-AM material, they
are unlikely to have directional effect in the attenuation of shear wave velocity. Therefore, the attenuation at 45◦
and 90◦ is likely to be a cause of crystallographic bulk texture.
During fabrication of Ti6Al4V block via LPBF-AM technique, rapid thermokinetics yield steeper thermal
gradients in the range of 1.48 × 10⁶ K/m to 1.58 × 10⁷ K/m along the build direction, which were computationally
predicted in the earlier reports of authors3,4. Under such steeper thermal gradients, the β grains heterogeneously
nucleate from the substrate or previously printed layer and competitively grow along , which wields high
thermal conductivity in cubic systems producing a strong 001 texture (Fig. 3e,f). This has also been confirmed
in several studies, which have traced the prior β texture based on the Burgers orientation relationship of β and α ′
26–28
. The schematic of such prior β grains depicting BCC unit cell orientation along directions is presented
in Fig. 5a. Here, we have assumed that BCC unit cell in a given β grain is directed along [001] direction parallel
to build direction (Z). When the martensitic start temperature is reached, the BCC unit cell of β transforms to
martensitic (α ′) HCP unit cell. During this displacive transformation, a single BCC unit cell can select one of the
12 possible variants of α ′ as per Burgers orientation relationship of {0001}α′ ||{110}β ; < 1120 >α′ || < 111 >β
28,29
. These twelve (6×2) possible equivalent orientation variants of α ′ are allowed as there are 6 possible {110}β
planes and two distinct combinations of parallel directions < 1120 >α′ || < 111 >β on (0001)α′ basal plane.
Considering BCC unit cell oriented along [001] || build direction (Z), its possible 6 {110}β planes forming basal
{0001}α′ plane and giving rise to HCP unit cell are depicted in Fig. 5b–g. Here, it can be noticed that α ′ variants
formed along (110) and (11̄0) planes have [0001] direction perpendicular to prior β [001] direction (Fig. 5b,c).
On the contrary, other variants of α ′ formed on (011̄), (011), (101), and (1̄01) planes have their [0001] direction
at ± 45◦ to prior β [001] direction (Fig. 5d–g). Therefore, out of 12 variant possibilities, 8 variants of α ′ HCP have
their c-axis inclined at ± 45◦ to the build direction, and the remaining 4 variants have their c-axis perpendicular
to the build direction. This rationalizes the morphology of martensite laths within the prior β grains oriented
specifically at ∼ 45◦ or 90◦ to the columnar boundaries. The 0001 pole figure texture plots pointed earlier also
supports the Burgers orientation relationship with 12 variants, which allows primary and secondary prismatic
planes, and basal planes of HCP to align parallel to the YZ plane of the Ti6Al4V cube (Figs. 3c,d, 5b–g).
In HCP Ti, the lowest elastic stiffness modulus corresponds to C 44 (46.5 GPa), which is equivalent to the
shear modulus corresponding to the several shear plane and direction systems in HCP crystal30,31. These systems
involve primary prismatic planes {011̄0} with directions, secondary prismatic planes {121̄0} with directions and the basal plane {0001} sheared along directions30,31. The directions are usually referred
as elastically soft direction which have low linear atomic density along them, whereas high linear atomic density
directions are elastically hard directions. In Titanium, due to c/a ratio of 1.58, is a hard (G = 46.5
GPa) directions while < 011̄0 > directions are soft (G = 39.9 GPa) directions30. Soft directions due to low
atomic density tend to attenuate the shear vibrations relayed to the neighboring atoms, thereby reducing the
resultant shear velocity and, in turn, shear modulus. In the present study, the direction of shear wave propagation
was unchanged along X-axis (Fig. 1c), whereas the direction of shear wave vibration was changed (by rotation),
thereby changing the shear wave plane. At the 45◦ orientation of the shear wave plane, the direction of shear
vibration coincides with < 101̄0 > directions for the α ′ variants corresponding to (011̄), (011), (101), and (101̄)
planes of prior β phase (Fig. 5d–g). Hence, the velocity of shear wave is likely to reduce while vibrating along
these directions. When the shear wave plane is oriented at 90◦ to the build plane, the direction of vibration
nearly coincides with < 101̄2 > directions of α ′ variants corresponding to (011̄), (011), (101), and (101̄) planes
of prior β phase, which is another soft direction (G = 41.7 GPa) in HCP-Ti30. In addition, for these variants
(Fig. 5d–g), it can be noticed that < 101̄2 > corresponds to the < 001 >β , which is lowest linear atomic density
and thereby elastically soft direction in BCC. The schematic visualization of shear wave plane coinciding with
the elastically soft directions is depicted in Fig. 6a,b. At 45◦ orientation of the shear wave plane with respect to
the build plane (XY), the direction of shear vibration coincides with [011̄0] for the α ′ variant transformed on
Scientific Reports | (2021) 11:633 | https://doi.org/10.1038/s41598-020-80710-6 7
Vol.:(0123456789)www.nature.com/scientificreports/
Figure 5. Schematics of (a) prior β grains and (b) BCC unit cell with (c–g) possible variants of α ′ martensite
HCP unit cell.
(011)β plane (Fig. 6a). Similarly, the rest of α ′ variants having their c axis aligned at ± 45◦ to the prior [001]β
direction are likely to have the shear wave plane (with 45◦ orientation) coinciding on < 011̄0 > direction. Along
the same lines, with 90◦ orientation of the shear wave plane with respect to the build plane (XY), the vibrating
direction coincides with < 101̄2 > directions (Fig. 6b). Therefore, in spite of 12 different possibilities of variants
of α ′ formed within the strongly textured prior β matrix, the family of elastically soft directions has maximum
probability to coincide with the direction of shear vibration at 45◦ and 90◦ orientations passing through the
bulk of the printed component. This reflects the bulk crystallographic texture and corresponding orientation
dependence of dynamic elastic moduli of LPBF-AM Ti6Al4V.
Scientific Reports | (2021) 11:633 | https://doi.org/10.1038/s41598-020-80710-6 8
Vol:.(1234567890)www.nature.com/scientificreports/
Figure 6. Schematic visualization of shear wave plane coinciding with the elastically soft direction at (a) 45◦ ,
(b) 90◦ orientations.
Conclusion
In the current study, texture driven elastic response of additively manufactured Ti6Al4V alloy using laser powder
bed fusion technique was investigated using integrated EBME and shear wave velocity measurement approach.
Change in the bulk elastic stiffness at shear wave plane oriented at 45◦ and 90◦ with respect to the plane normal to
the build direction was recognized due to a drop in the shear wave velocity at these orientations. SEM microstruc-
tures and EBSD IPF maps revealed the physical morphology of martensite laths oriented at 45◦ and 90◦ to the
columnar β grain boundary. The 0001 pole figures identified the texture mainly in < 0001 >, < 112̄0 >, < 101̄0 >
directions in different regions of YZ plane of LPBF-AM Ti6Al4V cube. This assisted the proposed rationale based
on the orientation variants of the product martensite phase with respect to the parent β phase, which increases
the probability of aligning the soft directions to the shear vibration direction.
Received: 16 October 2020; Accepted: 21 December 2020
References
1. Olakanmi, E. O., Cochrane, R. & Dalgarno, K. A review on selective laser sintering/melting (SLS/SLM) of aluminium alloy powders:
processing, microstructure, and properties. Prog. Mater. Sci. 74, 401–477 (2015).
2. Ngo, T. D., Kashani, A., Imbalzano, G., Nguyen, K. T. & Hui, D. Additive manufacturing (3D printing): a review of materials,
methods, applications and challenges. Compos. B Eng. 143, 172–196 (2018).
3. Pantawane, M. V., Ho, Y.-H., Joshi, S. S. & Dahotre, N. B. computational assessment of thermokinetics and associated microstruc-
tural evolution in laser powder bed fusion manufacturing of Ti6Al4V alloy. Sci. Rep. 10, 1–14 (2020).
4. Pantawane, M. V., Dasari, S., SrinivasAditya, M., Banerjee, R. & Dahotre, N. B. Rapid thermokinetics driven nanoscale vanadium
clustering within martensite laths in laser powder bed fused additively manufactured Ti6Al4V. Mater. Res. Lett. 8, 383–389 (2020).
5. Brown, C. U. et al. The effects of laser powder bed fusion process parameters on material hardness and density for nickel alloy 625 (US
Department of Commerce, National Institute of Standards and Technology, 2018).
6. Dadbakhsh, S. et al. Effect of SLM parameters on transformation temperatures of shape memory nickel titanium parts. Adv. Eng.
Mater. 16, 1140–1146 (2014).
7. King, W. E. et al. Laser powder bed fusion additive manufacturing of metals; physics, computational, and materials challenges.
Appl. Phys. Rev. 2, 041304 (2015).
8. Kunze, K., Etter, T., Grässlin, J. & Shklover, V. Texture, anisotropy in microstructure and mechanical properties of IN738LC alloy
processed by selective laser melting (SLM). Mater. Sci. Eng. A 620, 213–222 (2015).
9. Dodd, B. & Bai, Y. Adiabatic Shear Localization: Frontiers and Advances (Elsevier, Amsterdam, 2012).
10. Grzesik, W. Advanced Machining Processes of Metallic Materials: Theory, Modelling and Applications (Elsevier, Amsterdam, 2008).
11. Schindler, H.-J. On quasi-non-destructive strength and toughness testing of elastic-plastic materials. Int. J. Solids Struct. 42, 717–725
(2005).
12. Bond, L. J. In Nondestructive Evaluation of Materials (ASM International, 2018). ISBN: 978-1-62708-190-0.
13. Gennisson, J.-L., Deffieux, T., Fink, M. & Tanter, M. Ultrasound elastography: principles and techniques. Diagn. Interv. Imaging
94, 487–495 (2013).
14. Capobianco, T. E., Young, G. A. Jr., Pyle, J. M. & Khan, F. N. Effects of microstructure and texture on ultrasonic inspection of
austenitic weld metals. AIP Conf. Proc. 1430, 1203–1210 (2012).
Scientific Reports | (2021) 11:633 | https://doi.org/10.1038/s41598-020-80710-6 9
Vol.:(0123456789)www.nature.com/scientificreports/
15. Juva, A. & Lenkkeri, J. The effect of anisotropy on the propagation of ultrasonic waves in austenitic stainless steel. Technical Report
(1980).
16. Gray, B., Hudgell, R. & Seed, H. Longitudinal wave ultrasonic inspection of austenitic weldments. Technical Report (1980).
17. Palanichamy, P., Joseph, A., Jayakumar, T. & Raj, B. Ultrasonic velocity measurements for estimation of grain size in austenitic
stainless steel. NDT E Int. 28, 179–185 (1995).
18. Bouda, A. B., Lebaili, S. & Benchaala, A. Grain size influence on ultrasonic velocities and attenuation. Ndt E Int. 36, 1–5 (2003).
19. Lan, B., Lowe, M. J. & Dunne, F. P. A generalized spherical harmonic deconvolution to obtain texture of cubic materials from
ultrasonic wave speed. J. Mech. Phys. Solids 83, 221–242 (2015).
20. Lan, B., Lowe, M. J. & Dunne, F. P. A spherical harmonic approach for the determination of HCP texture from ultrasound: a solu-
tion to the inverse problem. J. Mech. Phys. Solids 83, 179–198 (2015).
21. Lan, B. et al. Direct volumetric measurement of crystallographic texture using acoustic waves. Acta Mater. 159, 384–394 (2018).
22. Moreau, A. et al. Evaluation of macrozone dimensions by ultrasound and EBSD techniques. Mater. Charact. 75, 115–128 (2013).
23. Jin, Y. et al. Enhanced instantaneous elastography in tissues and hard materials using bulk modulus and density determined without
externally applied material deformation. IEEE Trans. Ultrason. Ferroelectr. Freq. Control 67(3), 624–634 (2019).
24. Jin, Y. et al. Nondestructive ultrasonic evaluation of fused deposition modeling based additively manufactured 3D-printed struc-
tures. Smart Mater. Struct. 29, 045020 (2020).
25. Bachmann, F., Hielscher, R. & Schaeben, H. Texture analysis with MTEX-free and open source software toolbox. In Solid State
Phenomena Vol. 160, 63–68 (2010).
26. De Formanoir, C., Suard, M., Dendievel, R., Martin, G. & Godet, S. Improving the mechanical efficiency of electron beam melted
titanium lattice structures by chemical etching. Addit. Manuf. 11, 71–76 (2016).
27. Karami, K. et al. Continuous and pulsed selective laser melting of Ti6Al4V lattice structures: effect of post-processing on micro-
structural anisotropy and fatigue behaviour. Addit. Manuf. 36, 101433 (2020).
28. Simonelli, M., Tse, Y. Y. & Tuck, C. On the texture formation of selective laser melted Ti–6Al–4V. Metall. Mater. Trans. A 45,
2863–2872 (2014).
29. Banerjee, D. & Williams, J. Perspectives on titanium science and technology. Acta Mater. 61, 844–879 (2013).
30. Tromans, D. Elastic anisotropy of HCP metal crystals and polycrystals. Int. J. Res. Rev. Appl. Sci 6, 462–483 (2011).
31. Fisher, E. & Renken, C. Single-crystal elastic moduli and the hcp → bcc transformation in Ti, Zr, and Hf. Phys. Rev. 135, A482
(1964).
Acknowledgements
The authors acknowledge the infrastructure and support of Center for Agile and Adaptive and Additive Manufac-
turing (CAAAM) funded through State of Texas Appropriation #190405-105-805008-220 and Materials Research
Facility (MRF) at the University of North Texas. AN, AK, YJ acknowledges the support of the National Science
Foundation—Emerging Frontiers in Research and Innovation (EFRI) Grant (#1741677).
Author contributions
M.V.P., and N.B.D. conceived the research idea. M.V.P., T.Y., and Y.J. performed the experiments. M.V.P., Y.J.,
and T.Y performed the experimental characterization. M.V.P., S.S.J., and T.Y. wrote the main manuscript text
and prepared the figures. S.D. and A.S. performed additional high resolution electron microscopy, N.B.D, R.B.,
S.G.S., A.K., and A.N. reviewed and edited the manuscript.
Competing Interests
The authors declare no competing interests.
Additional information
Correspondence and requests for materials should be addressed to N.B.D.
Reprints and permissions information is available at www.nature.com/reprints.
Publisher’s note Springer Nature remains neutral with regard to jurisdictional claims in published maps and
institutional affiliations.
Open Access This article is licensed under a Creative Commons Attribution 4.0 International
License, which permits use, sharing, adaptation, distribution and reproduction in any medium or
format, as long as you give appropriate credit to the original author(s) and the source, provide a link to the
Creative Commons licence, and indicate if changes were made. The images or other third party material in this
article are included in the article’s Creative Commons licence, unless indicated otherwise in a credit line to the
material. If material is not included in the article’s Creative Commons licence and your intended use is not
permitted by statutory regulation or exceeds the permitted use, you will need to obtain permission directly from
the copyright holder. To view a copy of this licence, visit http://creativecommons.org/licenses/by/4.0/.
© The Author(s) 2021
Scientific Reports | (2021) 11:633 | https://doi.org/10.1038/s41598-020-80710-6 10
Vol:.(1234567890)You can also read