Impact of a Northern European Enclosure Dam on North Atlantic Climate - OceanRep
←
→
Page content transcription
If your browser does not render page correctly, please read the page content below
Impact of a Northern European Enclosure
    Dam on North Atlantic Climate

                   Bachelor Thesis
          B. Sc. Physics of the Earth System:
        Meteorology, Oceanography, Geophysics

         Christian-Albrechts-Universität zu Kiel
     GEOMAR Helmholtz Center for Ocean Research

                     Corinna Buder
            Matriculation Number: 1103961

         First Supervisor: Dr. Joakim Kjellsson
        Second Supervisor: Dr. Thomas Martin

                   Kiel, October 2020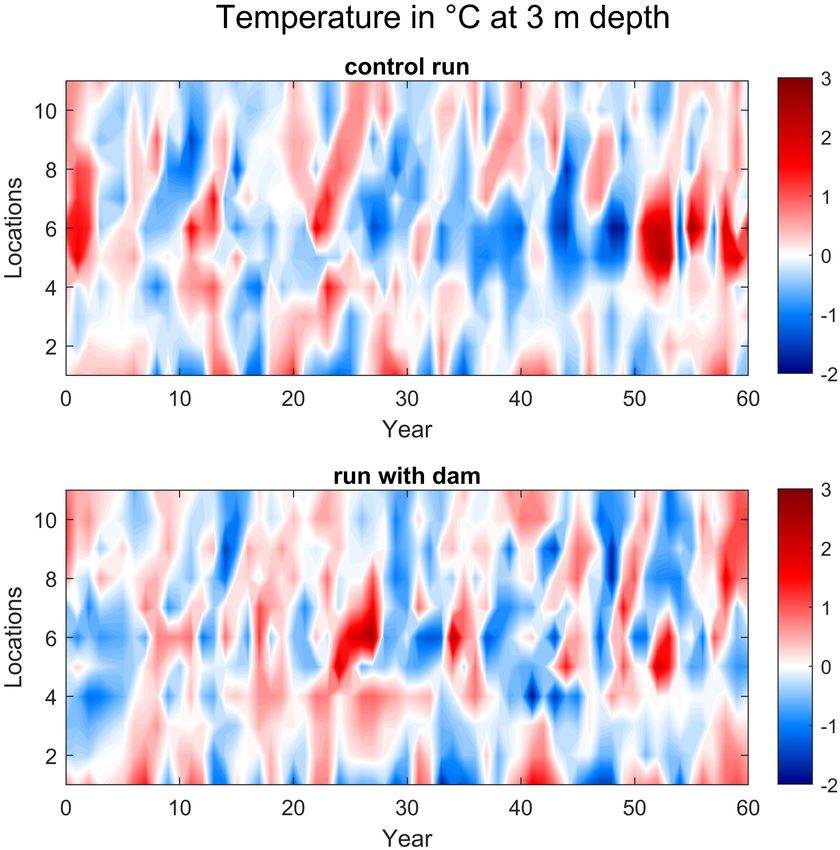
1
Zusammenfassung
Der Klimawandel stellt die Menschheit nicht nur mit den steigenden Temperaturen vor
die Aufgabe, mit den Veränderungen umzugehen. Momentan liegt die globale Mittel-
temperatur etwa 1 ◦ C über dem vorindustriellen Niveau während der Meeresspiegel seit
1880 mehr als 21 cm gestiegen ist. Wenn der Klimawandel nicht abgeschwächt wird, wer-
den alternative Schutzmaßnahmen nötig sein. In ihrer design fiction schlagen Groeskamp
und Kjellsson die Konstruktion des Northern European Enclosure Dam (NEED) vor, um
Nordeuropa vor dem zukünftigen Meeresspiegelanstieg zu schützen. Dieser würde zwi-
schen Frankreich, Großbritannien und Norwegen verlaufen und 15 Länder an Nord- und
Ostsee schützen. Der Bau von NEED könnte die tragfähigste Lösung sein, hätte aber
diverse Auswirkungen auf die Gesellschaft, die Ozeane und das Klima.
In dieser Arbeit liegt der Fokus auf den von NEED verursachten Veränderungen in Nord-
und Ostsee sowie im Nordatlantik. Dafür wurden zwei Durchläufe von je 60 Jahren eines
Modells verglichen, ein Kontrolllauf und ein Lauf mit dem Damm. Das Modell Flexible
Ocean and Climate Infrastructure (FOCI) ist mit dem Atmosphären-Modell OpenIFS,
einer Version des Integrated Forecast System (IFS) gekoppelt.
Da NEED die Nordsee einschließt, werden hier wesentliche Veränderungen erwartet. Die
Modellberechnungen zeigen eine Abkühlung und Abnahme des Salzgehaltes im Lauf mit
dem Damm, da der Austausch mit dem salzigeren und wärmeren Wasser des Atlantiks
nicht möglich ist. In der Zeitspanne von 100 Jahren nimmt der Salzgehalt in der Nord-
see von 34 PSU auf 13,6 PSU ab. Diese Abnahme des Salzgehalts würde das gesamte
Ökosystem der Nordsee verändern. In der Ostsee hat das Modell Schwierigkeiten, die
beobachtete Schichtung nachzubilden, denn es zeigt kältere und salzärmere Schichten in
der Tiefe als in den Schichten darüber anstatt eines Salzgradienten von der Oberfläche
zum Meeresboden, bei dem das Salzwasser am Meeresboden verbleibt. Im Nordatlantik
und auch im Pazifik ist eine großräumige Erwärmung zu sehen. Diese entsteht durch die
unterschiedliche Variabilität der Modelläufe, da die Laufzeit des Modells von 60 Jahren
nicht ausreicht, um ein klimatisches Gleichgewicht zu erreichen und über mehrere Zyklen
der multidekadischen Variabilität im Ozean und der Atmosphäre zu mitteln. Die starke
Erwärmung vor der norwegischen Küste ist eine Folge von NEED, da dieser die Strömung
durch die Nordsee abschneidet und damit dort das Abkühlen und Absinken des Salzgehalts
beim Austausch von Nordsee und Atlantik verhindert. Die Veränderungen durch NEED
in der Zirkulation des Nordmeeres erstrecken sich jedoch meist nicht bis zur Labradorsee.
Um eine eindeutige Aussage über den Einfluss von NEED auf die globale Ozeanzirkulation
treffen zu können, sind jedoch weitere Daten oder längere Modelldurchläufe nötig.
Abstract
As the climate changes the rising temperatures will not be the only change our society has
to cope with now and in the future. Currently the global mean temperature is about 1 ◦ C
above pre-industrial levels and the global mean sea level has risen over 21 cm since 1880.
If climate change is left unmitigated, alternative protection measures will be needed. In
their design fiction, Groeskamp and Kjellsson propose the construction of the Northern
European Enclosure Dam (NEED) to protect Northern Europe against the future sea
level rise. It would stretch between France, the United Kingdom and Norway and protect
15 countries lying at the North or Baltic Seas. The construction of NEED might be the
most viable solution but it would also have various impacts on the society, the oceans and
the climate.
This work focuses on the changes NEED might cause in the North and Baltic Seas and
the North Atlantic. Therefore we look at two 60 year long simulation runs, a control run
and a run with NEED of the model Flexible Ocean and Climate Infrastructure (FOCI)
coupled with the atmosphere model OpenIFS, a version of the Integrated Forecast System
(IFS) model.
As NEED would enclose the North Sea major changes are expected here. The model
shows that the North Sea gets colder and fresher in the run with the dam as no exchange
with the warm and saline water from the Atlantic is possible. After 100 years in the
model the salinity has decreased from 34 PSU to 13,6 PSU. This freshening would change
the hole ecosystem of the North Sea. In the Baltic Sea the model struggles to reproduce
the observed stratification as we find colder and less saline waters in the bottom layers
than in the upper layers instead of a salinity gradient from top to bottom, with most of
the saltwater remaining at depth. In the North Atlantic as well as in the Pacific the data
show a widespread warming at the surface. This warming is mainly the result of different
variability between the two runs. The time period of 60 years is not long enough for the
model to reach a steady climate state nor to average over several cycles of multi-decadal
variability in the ocean and atmosphere. The strong warming seen along the Norwegian
coast is an effect of NEED as it cuts off the circulation through the North Sea and thereby
blocks the cooling and freshening effect of the exchange between the North Atlantic and
North Sea waters. Most anomalies in the circulation in the Nordic Sea do not extend to
the Labrador Sea. Yet more or longer data are needed to prove if building NEED has an
impact on the global circulation of the oceans.
Contents
1 Introduction                                                                                1

2 Data and methods                                                                            3
  2.1   Data . . . . . . . . . . . . . . . . . . . . . . . . . . . . . . . . . . . . . . .    3
  2.2   Methods . . . . . . . . . . . . . . . . . . . . . . . . . . . . . . . . . . . . .     5
        2.2.1   Plots over time . . . . . . . . . . . . . . . . . . . . . . . . . . . . .     5
        2.2.2   Plots over areas . . . . . . . . . . . . . . . . . . . . . . . . . . . . .    6
        2.2.3   Significance and Correlation Coefficient . . . . . . . . . . . . . . . .      6

3 Results                                                                                     6
  3.1   North Sea . . . . . . . . . . . . . . . . . . . . . . . . . . . . . . . . . . . .     6
  3.2   Baltic Sea . . . . . . . . . . . . . . . . . . . . . . . . . . . . . . . . . . . .    8
  3.3   North Atlantic . . . . . . . . . . . . . . . . . . . . . . . . . . . . . . . . . .    8

4 Discussion                                                                                 12

5 References                                                                                 15

6 Appendix                                                                                   17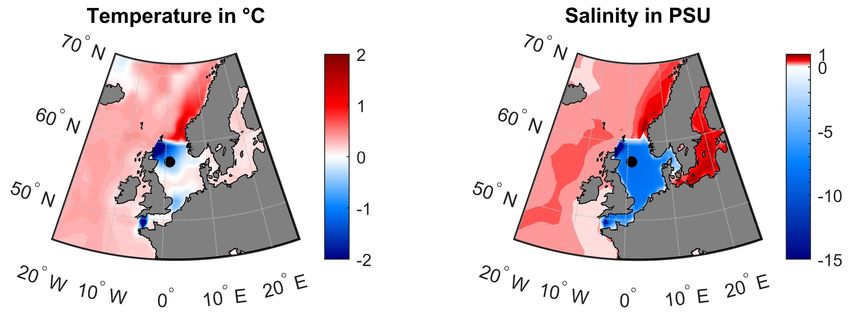
Corinna Buder

1     Introduction
With ‘Fridays for Future’ the young generation tries to draw attention to the various
problems that come along with the climate change. The rising temperatures will not be
the only change our society has to cope with now and in the future. Among other effects,
the increasing temperatures are accompanied also by rising sea levels which endanger
coastlines all over the world. Currently the global mean temperature is about 1 ◦ C above
pre-industrial levels (Haustein et al. 2017). The global mean sea level has risen over 21 cm
since 1880 (Church & White 2011). We expect that the rate of sea level rise will very likely
exceed the currently observed rate of 2,0 [1,7-2,3] mm/yr, up to 8 to 16 mm/yr for RCP8.5
(Representative Concentration Pathway) during 2081-2100 (IPCC, 2014). The sea level
rise will not be uniform across regions but by the end of the 21st century, it is very likely
that more than ∼ 95 % of the ocean area will experience sea-level rise. With ‘climate
engineering’ the society tries to slow down the climate change using technologies which
reduce the concentration of CO2 in the atmosphere or to directly influence the Earth’s
radiation budget with a view to mitigating or offsetting anthropogenic climate change.
Carbon dioxide removal technologies utilize biological, chemical or physical processes to
cause the ocean or the terrestrial biosphere to absorb atmospheric CO2 or directly store it
geologically. Radiation management technologies directly influence either shortwave solar
radiation or long-wave thermal radiation (Rickels et al., 2011).
If climate change is left unmitigated and the efforts of climate engineering fail, alternative
protection measures will be needed. In their design fiction, Groeskamp and Kjellsson
(2020) propose the construction of the Northern European Enclosure Dam (NEED) to
protect Northern Europe against the future sea level rise. It would stretch between France,
the United Kingdom and Norway as shown in Figure 1 and protect 15 countries lying at
the North or Baltic Seas. They state, that the construction of NEED might be the most
viable solution if climate change is left unmitigated. They point out problems or impacts
NEED would cause such as effects on the Maritime Industry and the impact on ocean
dynamics and the environment. The financial feasibility of NEED, the social and cultural
implications and political considerations are also discussed. Yet more discussion and facts
about the possible effects of NEED are needed. Therefore, this thesis shows the impact
NEED would have on the North Atlantic Climate by analysing model runs. As NEED
would separate the North Sea of the Atlantic Ocean, changes in temperature and salinity
as well as currents are expected. Groeskamp and Kjellsson (2020) already explained the
freshening of the North Sea due to the river inflows and the lack of mixing with saline
Atlantic water and calculated the time to reduce the salinity in the North Sea by a factor

Impact of a Northern European Enclosure
Dam on North Atlantic Climate                                                         Page 1
Corinna Buder

  Figure 1: Position of the Northern European Enclosure Dam (NEED) proposed by
    Groeskamp and Kjellsson (2020), here added to the ocean model bathymetry.

10 to be about 100 years. Atlantic water of the North Atlantic Current (NAC) enters
the North Sea through the English Channel and the northern boundary. Winter and
Johannessen (2006) used a numerical model of the North Atlantic to study the exchanges
between the North Sea and the North Atlantic. They found a total mean inflow of 2,22 Sv
at the northern boundary of the North Sea but also a large variability. They estimate the
inflow through the English Channel to be 0,16 Sv and an outflow trough the Norwegian
Trench of 2,33 Sv. The general circulation pattern in the North Sea is mainly cyclonic
and influenced by the topography. Reaching the area between Denmark, Norway and
Sweden the Atlantic water mixes with the brackish water from the Baltic. Following the
Norwegian coast, it becomes part of the Norwegian Coastal Current and leaves the North
Sea through the Norwegian Trench. The Norwegian Coastal Current mixes with the NAC
and flows northward towards Norwegian and Barents Seas (Winter & Johannessen, 2006).
The NAC is part of the upper limb of the meridional overturning circulation (Chafik et
al., 2015). The Atlantic meridional overturning circulation (AMOC) can be characterized

Impact of a Northern European Enclosure
Dam on North Atlantic Climate                                                     Page 2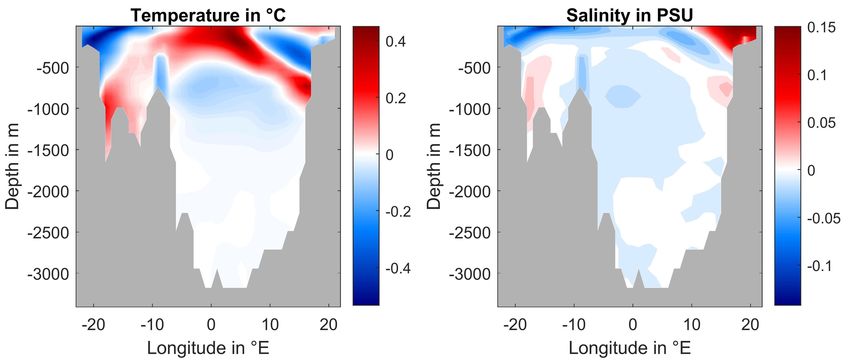
Corinna Buder

as a vertical and north-south circulation cell with cold, dense water moving southward
at depth and warm, light waters moving northward near the surface (Perez et al., 2015).
Warm water enters the Atlantic at its southern boundary and flows northward crossing
the equator. As it moves through the Caribbean and Gulf of Mexico, it is becoming
recognizable as the Gulf Stream. It passes the Straits of Florida and separates from
the North American coast. The flow, known now as the North Atlantic Current at this
point, turns eastward towards Europe, where it flows across the Greenland-Scotland Ridge
(GSR). North of the GSR cold, deep waters are formed which flow back southward across
the GSR. In the deep convection regions of the Labrador Sea additional deep water is
generated. The southward deep flow is not a continuous current along the boundary but
it is identifiable from the North Atlantic to the southern boundary of the South Atlantic
(McCarthy et al., 2019).
Building NEED would cut off the circulation into the North Sea, where temperature,
salinity and the current pattern will change. As no water can flow into the North Sea
changes in the NAC are expected. Clearly visible is the lack of fresh, cold water of the
North Sea. Chafik et al. (2015) determined a lagged response of the NAC to anomalous
positive barotropic flow in the region of the northern boundary of the North Sea. As a
response to the increase in the transport they found a temperature anomaly propagating
towards the Fram Strait, where it is still predominantly located after one year. With
NEED we expect a change in the temperature and salinity in the NAC compared to the
exchange of the NAC with the open North Sea.
The best way to see if and what changes NEED might cause is a model simulation. The
focus of this study lies on the effects on the North and Baltic Seas as well as on the North
Atlantic. We discuss if the changes in the exchange between the North Atlantic and the
North Sea lead to changes in the NAC and if these could propagate around the Nordic
Sea and impact the AMOC.

2     Data and methods

2.1    Data
The analysed model output is based on the model Flexible Ocean and Climate Infras-
tructure (FOCI) (Matthes et al., 2020), developed at GEOMAR. The atmosphere model
is OpenIFS, a version of the Integrated Forecast System (IFS) model of the European
Centre for Medium-Range Weather Forecasts (ECMWF) to use outside ECMWF (Cari-
olle & Teyssèdre, 2007; Temperton et al., 2001). The ocean/sea-ice model is the Nucleus

Impact of a Northern European Enclosure
Dam on North Atlantic Climate                                                        Page 3
Corinna Buder

for European Modelling of the Ocean (NEMO; Madec, 2014) and Louvain-la-Neuve sea
Ice Model (LIM; Fichefet & Maqueda, 1997). The OASIS coupler (Craig et al., 2017)
performs the exchange of momentum, sea-ice properties and heat and freshwater fluxes
between the components of the ocean and the atmosphere. River runoff is calculated by
the HTESSEL land surface model embedded in OpenIFS and passed to the ocean as a
freshwater flux by the coupler at the nearest ocean grid cell (Matthes et al., 2020). Atmo-
sphere resolution is 125 km with 91 vertical levels, ocean resolution is 0.5◦ with 46 levels
and coupling between the two is done every three hours. Table 1 shows some technical
details of the model components and further information may also be found in Matthes
et al. (2020).

                            Table 1: Used model components

          OpenIFS (Atmosphere)            Resolution of 1,125◦ x 1,125◦
          (Cariolle & Teyssèdre, 2007;   91 levels
          Temperton et al., 2001)         four seasons of averages over 50 years
          NEMO (Ocean)                    Resolution 0,5◦ x 0,5◦
          (Madec, 2014)                   46 layers
                                          four seasons of averages over 50 years
                                          And
                                          Resolution of 1◦ x 1◦
                                          46 layers
                                          Annual means
          LIM (Ice)                       Resolution 0,5◦ x 0,5◦
          (Fichefet & Maqueda, 1997)      46 layers
                                          four seasons of averages over 50 years
          OASIS (Coupling)                coupling frequency: every 3 hours
          (Craig et al., 2017)

The model was run for 100 years with pre-industrial external forcing from year 1850 for
the control run. After the first 40 years of the control run the walls of NEED were put
in and a second run was started. The control run has data of 100 years in total, the run
with the walls has data of 60 years in total. The analysis of these two runs was made for
the last 50 years of both runs mainly. Most data of each run are an average of the last 50
years split in the four seasons (Table 1). They are winter with December, January and
February (DJF), spring with March, April and May (MAM), summer with June, July
and August (JJA) and autumn with September, October and November (SON). Some
data are annual means for the whole time of each run. All data are netCDF (Network
Common Data Format) files.

Impact of a Northern European Enclosure
Dam on North Atlantic Climate                                                        Page 4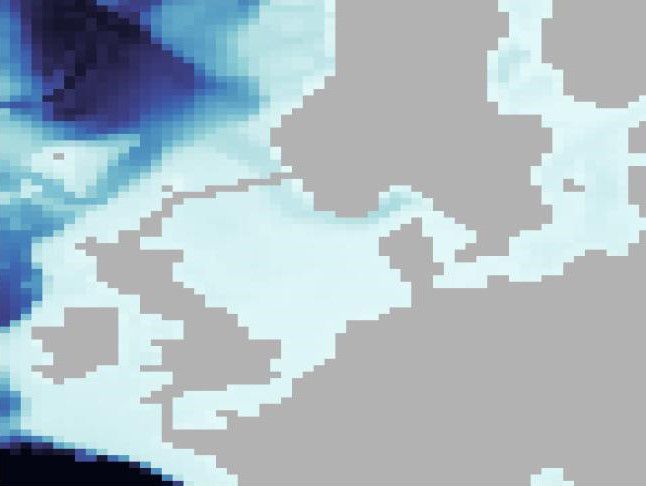
Corinna Buder
2.2 Methods
To analyse and plot the data the program Matlab (R2019b) was used. The data are
for climate-model simulation with a dam (FOCI-NEED) and for the control simulation
(FOCI-CTRL).
2.2.1 Plots over time
For plots over time we use the data of annual means for the period of 100 years for FOCI-
CTRL and 60 years for FOCI-NEED. Time series are therefore made out of the annual
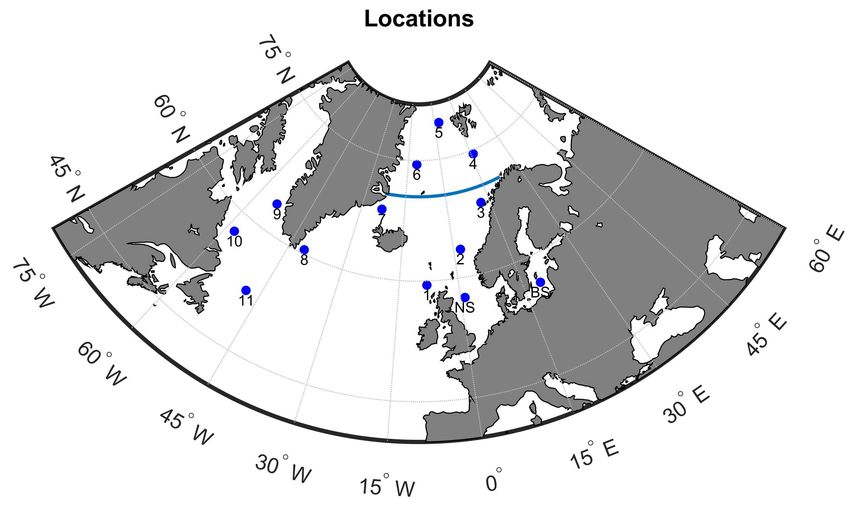
means always using the same period of time to have comparable data. We used eleven
different locations in the North Atlantic (numbers 1 to 11 in Fig. 2), one in the North Sea
(labeled NS in Fig. 2) and one in the Baltic Sea (labeled BS in Fig. 2) for time series and
Hovmöller diagrams. The cross section is positioned at 70,5◦ N between Norway (22◦ E)
and Greenland (23◦ W) (Fig. 2).
Figure 2: Locations used for the different plots. NS stands for North Sea and BS for
Baltic Sea. The locations 1 to 11 are used in the Hovmöller diagrams. The line indicates
the cross section.
For the Hovmöller diagrams the eleven locations displayed in Figure 2 are used. For each
location and depth the trend was removed separately, then the time mean of each location
was calculated and removed from the detrended data.
Impact of a Northern European Enclosure
Dam on North Atlantic Climate Page 5Corinna Buder
2.2.2 Plots over areas
The data used mainly for plots over areas are means over the last 50 years of both runs
separately for the four seasons. Two plots (Fig. 3 and Fig. 6) use means over the 60 years
of annual means. All plots over areas are the difference of FOCI-NEED and FOCI-CTRL.
Before comparing FOCI-NEED and FOCI-CTRL the area-weighted temporal mean over
the North Atlantic (90◦ W to 30◦ E and 30,5◦ N to 80,5◦ N) is removed. Then the mean
over the 60 years of the area weighted data is calculated. By removing the differences in
the mean state the differences in the spatial patterns and variability become clearer.
2.2.3 Significance and Correlation Coefficient
Significance of relationships between the time series of the same variable (temperature
and salinity) at the locations 1 and 2 (Fig. 2) are tested using a null hypothesis that there
is no correlation and a 95 % confidence interval. To calculate the Correlation Coefficient
first the trend of each location was removed from the data. Then the mean over time of
each location was calculated and also removed. The correlation coefficient was calculated
with
Σ(xi − x̄ )(yi − ȳ)
r=p ,
Σ(xi − x̄ )2 Σ(yi − ȳ)2
where r is the correlation coefficient, xi and yi are the two time series with time index i
and x and y are time averages. The correlations of scatter plots between two time series
are tested using a t-test with the null hypothesis that there is no correlation. For the
t-test the formula √
r n −2
t= ,
1 − r2
where n is the length of the time series was used. The critical value for a two-tailed
significance test at the 95 % level is 1,96 with n > 30 (Kanji, 1999).
3 Results
3.1 North Sea
As NEED separates the North Sea from the Atlantic Ocean we expect differences in
temperature, salinity and currents between our climate-model simulation with a dam
(FOCI-NEED) and the control simulation (FOCI-CTRL). The temperature mean over
the 60 years of annual means of the North Sea is colder and less saline in FOCI-NEED
than in FOCI-CTRL (Fig. 3). It is overall colder in FOCI-NEED compared to FOCI-
Impact of a Northern European Enclosure
Dam on North Atlantic Climate Page 6Corinna Buder
Figure 3: The difference of the temperature in ◦ C (left) and salinity in PSU (right) of
the run with the dam and the control run. The data are means over the 60 years of
annual means at 16 m depth. The black point is the location NS used in Figure 4.
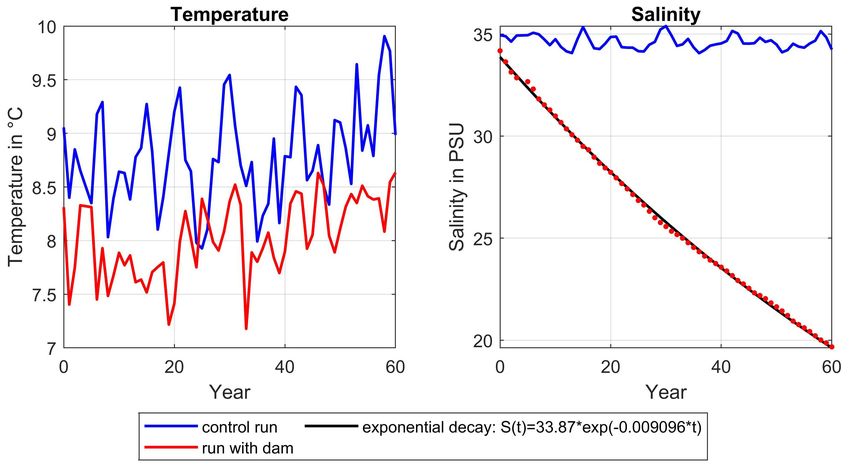
CTRL (Fig. 4). The North Sea gradually becomes fresher in FOCI-NEED compared
to FOCI-CTRL which is due to the freshwater input from rivers and the lack of mixing
with Atlantic waters (Fig. 4). The value for the salinity in FOCI-CTRL only shows
small variability over the time of 60 years. FOCI-NEED instead shows a very significant
freshening from 34 PSU in the first year to nearly 20 PSU after 60 years. The exponential
Figure 4: Temperature in ◦ C (left) and salinity in PSU (right) over time as annual
means at the location NS at 16 m depth.
decay of S (t) = 33, 87 ∗ exp(−0, 009096 ∗ t) fits the values of the salinity in the North Sea.
100 years after building NEED in the simulation the salinity has decreased to 13,6 PSU.
Impact of a Northern European Enclosure
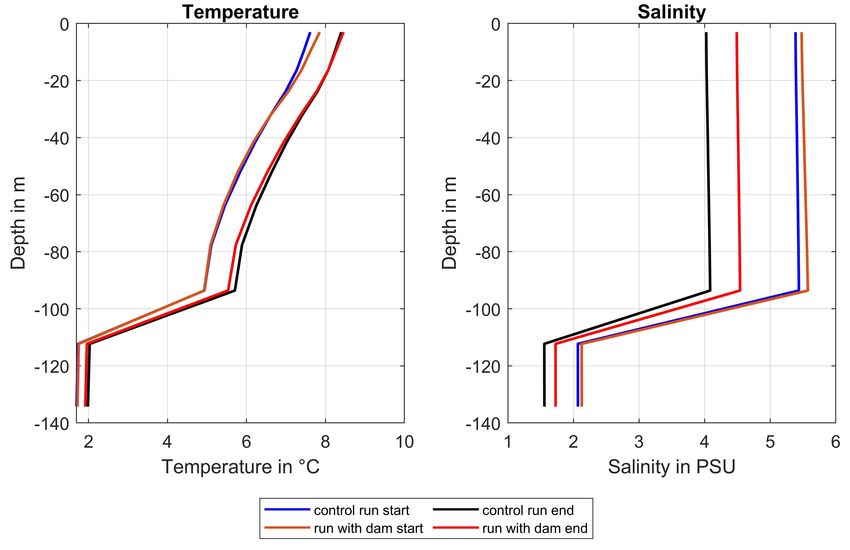
Dam on North Atlantic Climate Page 7Corinna Buder Following the fitted exponential decay it would take 252 years to reduce the salinity by a factor 10 and 387 years to reach 1 PSU which is the salinity of fresh water. 3.2 Baltic Sea In the Baltic Sea the salinity in FOCI-NEED is higher than in FOCI-CTRL (Fig. 3). The bottom layers are less saline and colder than the upper layers for both runs (Fig. 5). In reality there is a salinity gradient from top to bottom, with most of the saltwater remaining at depth. Figure 5: Temperature in ◦ C (left) and salinity in PSU (right) as means over the first (start) and last (end) 10 years of the 60 years of annual means at location BS (Fig. 2). 3.3 North Atlantic At three meters depth a widespread warming can be seen in the Atlantic as well as in the Pacific Ocean for FOCI-NEED in comparison to FOCI-CTRL (Fig. 6). Along the coast of Norway a strong warming can be found in FOCI-NEED with values about three times higher than the highest values in the widespread warming. The salinity is higher at the Norwegian Coast as well. The seasonal cycle shows that the coastal warming is highest Impact of a Northern European Enclosure Dam on North Atlantic Climate Page 8
Corinna Buder
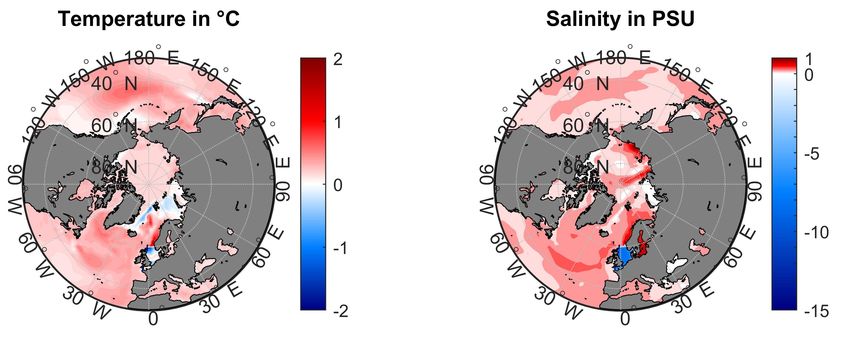
Figure 6: The difference of the temperature in ◦ C (left) and salinity in PSU (right) of
the run with the dam and the control run. The data are means over the 60 years of
annual means at 3 m depth.
in DJF and lowest in JJA (Fig. A.1). The warming reaches to the depth of about 150 m
to 200 m whereas the salinity reaches 200 m at the southern part of the Norwegian coast
and about 300 m to 400 m at 70◦ N north of Lotofen (Fig. 7). In the northern Barents Sea
and along the coast of Greenland between Spitsbergen and Iceland FOCI-NEED is colder
and fresher than FOCI-CTRL (Fig. 7). The mean ice coverage (not shown) is higher at
these areas for FOCI-NEED in all four seasons. In the central Nordic Sea a warming of
about 0,4 ◦ C difference of FOCI-NEED and FOCI-CTRL reaches to a depth of 500 m.
Below 1500 m depth neither temperature nor salinity show major differences.
We can’t exclude the possibility that the differences in the two runs are due to a model drift
or differences in the variability of the two runs. 60 years is not long enough for the model to
reach a steady climate state nor to average over several cycles of multi-decadal variability
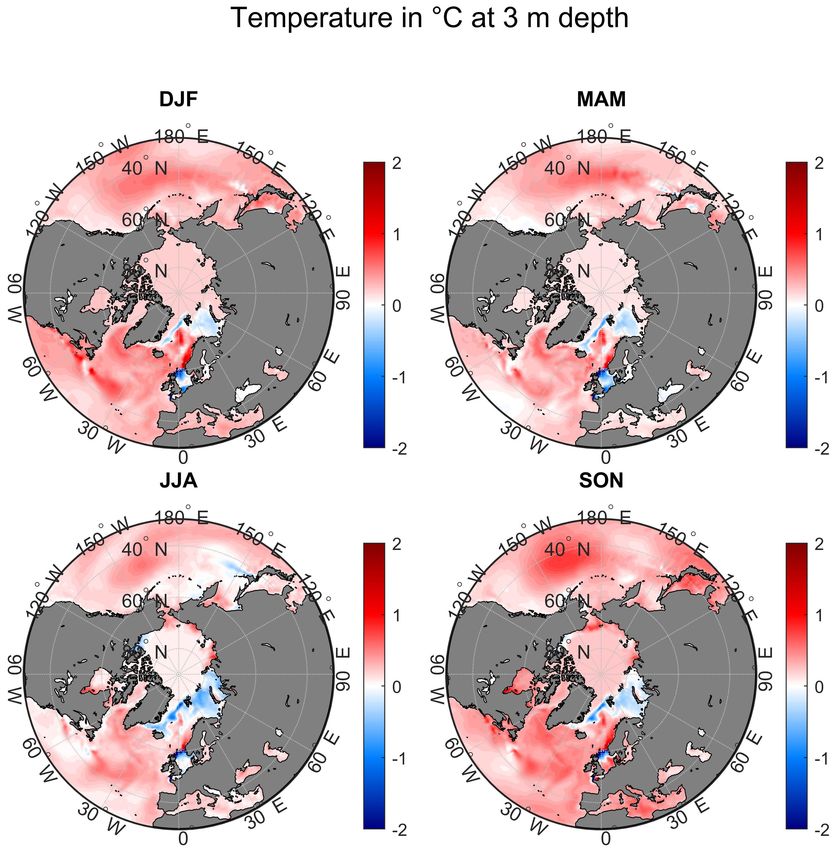
in the ocean and atmosphere. In the Hovmöller diagrams we study the connectivity of
spatial variations by detrending and removing the mean of the temperature and salinity
at eleven locations (Fig. 2) around the rim of the North Atlantic. Near the surface at 3
m depth both runs show no pattern of events connecting all locations (Fig. A.2). Most of
the events at location 1 spread to location 2 in FOCI-CTRL. Between the years 35 to 50
the locations 5 to 7 in FOCI-CTRL are mainly cold followed by warm events from year 50
to year 60. Most of the anomalies at location 6 propagate to location 11. In FOCI-NEED
most events propagate from location 1 to location 3. Some of the anomalies at location
6 reach location 11. Water masses at the surface are not only influenced by advection
but also by interactions with the atmosphere and sea ice while advection plays a much
larger role for water masses below the mixed layer. That explains the fast changes in
Impact of a Northern European Enclosure
Dam on North Atlantic Climate Page 9Corinna Buder
Figure 7: Cross section of the difference of the temperature in ◦ C (left) and salinity in
PSU (right) of the run with the dam and the control run. The data are means over the
60 years of annual means. The cross section is bounded by Greenland (23◦ W) and
Norway (22◦ E) at 70,5◦ N (Fig. 2).
temperature and the lack of propagating events in the Hovmöller diagram at 3 m depth.
At 534 m depth in FOCI-CTRL two warm anomalies start at location 1 in the years 17
and 32 and spread to location 11 in about eleven years (Fig. 8). Locations 8 to 11 are
mainly cold, except for the first two years and the mentioned events. Various warm events
starting between the years 15 and 35 in location 1 propagate with time to location 7 in
FOCI-NEED. Only the first and last event in that row spread to location 11 and thereby
propagating around the Nordic Sea and reaching Labrador Sea. The Hovmöller diagram
at 534 m is very similar to the Hovmöller diagram at 322 m (not shown). At the depth of
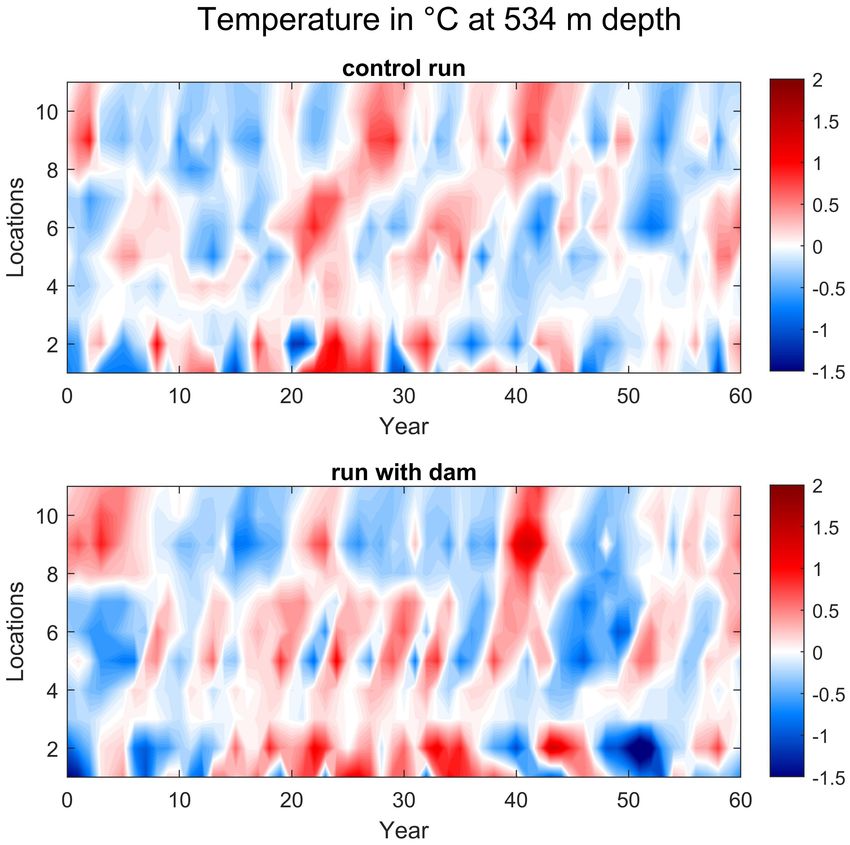
989 m FOCI-CTRL has negative temperature values for the first 20 and the last 10 years
for nearly all 11 locations (Fig. A.3). In the 30 years between them the values are mainly
positive but there are no anomalies propagating as these would be shaped as diagonal
stripes. FOCI-NEED instead has various alternating warm and cool events from location
4 to 7.
In the Hovmöller diagrams we see a connection in the propagating temperatures between
location 1 and 2 which can be found as well in the time series (Fig. A.4). Therefore we
calculate the correlation between these two locations for a zero, one and two year lag for
the temperature (Table 2) and the salinity (Table 3) each for three depths. The scatter
plots to the correlation coefficients support the results (Fig. A.6 to Fig. A.11).
We only find statistically significant correlations for zero and one year lags and at all
depths. The temperature is correlated with significant correlation coefficients for a zero-
Impact of a Northern European Enclosure
Dam on North Atlantic Climate Page 10Corinna Buder
Figure 8: Hovmöller diagram for the ocean temperature in ◦ C at 534 m depth with the
locations 1 to 11 in the North Atlantic (Fig. 2).
lag and a one year lag in both runs at 3 m and 322 m depth with a better correlation for a
zero-lag. The correlation coefficients of the temperature are higher for FOCI-NEED than
for FOCI-CTRL, the correlation is higher for salinity than temperature at 3 m depth but
the other way around for 322 m depth. The values are similar for both runs. In 134 m
depth FOCI-CTRL shows the only significant value in the temperature for a one year
lag, which is the lowest significant correlation coefficient with r = −0, 29. The salinity
instead is correlated with significant values for both runs for a zero-lag and a one year lag.
The salinity at 134 m varies with similar time periods for the two locations on both runs,
whereas the temperature instead shows very different variability for the two locations (Fig.
A.5). The slopes of the linear regression of most scatter plots are higher for FOCI-NEED
than for FOCI-CTRL.
Impact of a Northern European Enclosure
Dam on North Atlantic Climate Page 11Corinna Buder
zero lag one year lag two year lag
at 3 m depth 0,70 0,31 -0,21
0,73 0,36 -0,05
at 134 m depth -0,23 -0,29 -0,16
0,01 -0,14 -0,15
at 322 m depth 0,72 0,61 0,15
0,72 0,65 0,06
Table 2: Correlation Coefficient of the temperature between locations 1 and 2 (Fig. 2).
Values of FOCI-CTRL are at the top, values of FOCI-NEED at the bottom. Significant
values at the 95 % level are bold.
zero lag one year lag two year lag
at 3 m depth 0,84 0,7 -0,02
0,87 0,68 0,03
at 134 m depth 0,86 0,51 -0,05
0,8 0,58 0,03
at 322 m depth 0,7 0,59 0,2
0,58 0,63 0,06
Table 3: Correlation Coefficient of the salinity between locations 1 and 2 (Fig. 2).
Values of FOCI-CTRL are at the top, values of FOCI-NEED at the bottom. Significant
values at the 95 % level are bold.
As the outflow from the North Sea enters the NAC between the locations 1 and 2 a
difference between FOCI-NEED and FOCI-CTRL in the correlation could be caused by
NEED. The correlation coefficients don’t show a uniform difference. Yet most values of
the slopes of the linear regression in the scatter plots are higher for FOCI-NEED which
indicates that anomalies arrive stronger at location 2 with NEED than without.
4 Discussion
As NEED would enclose the North Sea major changes are expected here. The model shows
that the North Sea gets colder and fresher in the run with the dam. As the Atlantic is
cut off, no exchange with the warm and saline water from the NAC is possible. The
model shows a freshening of about 14 PSU in 60 years. Groeskamp and Kjellsson (2020)
calculated the time it takes to reduce the salinity in the North Sea by a factor 10 to be
about 100 years. In our simulation it takes 252 years to reduce the salinity by a factor
10. By the time of 100 years the salinity has decreased to 13,6 PSU. Extrapolating the
exponential fit it would take 387 years to reach 1 PSU which is the salinity of fresh water.
The freshening of the North Sea would change the whole ecosystem and species that need
Impact of a Northern European Enclosure
Dam on North Atlantic Climate Page 12Corinna Buder saline water might not be able to cope with these new circumstances. Those species migrating from fresh water to the ocean or the other way around might become extinct regionally inside NEED as the North Sea gets fresher and the way out is cut off. For all marine life NEED would represent a unbreachable barrier in the ocean what might limit the genetic pool of species and block migration in and out of the North Sea. That will also have a huge impact on the fishing industry in Northern Europe. Other industries like the shipping industry are also endangered as NEED lock away international ship movements from the harbours. The model struggles to reproduce the observed stratification of the Baltic Sea. The Baltic Sea is connected to the North Sea only by the small area between Denmark and Sweden, where the resolution of the data might cause problems as the connection between North Sea and Baltic Sea is only one grid cell in the model. The model probably does not make a realistic exchange of water with the North Sea and with that the parameters are not reliable to give a statement on the changes NEED might cause. Therefore we can not present clear results to the changes that NEED would cause in the Baltic Sea. In the North Atlantic and North Pacific we find a widespread warming which we did not expect. With the short period of 60 years we can’t exclude different long-term internal variability in the two runs. In the Hovmöller diagram at 989 m depth NEED-CTRL shows periods of cold temperatures at the beginning and end of the 60 years with a period of about 30 years of warm temperatures in between. This cycle can’t be found in FOCI-NEED. The different variabilities in the two simulations make it difficult to distinguish whether the differences between the runs are caused by NEED or if they are due to the internal variability of each run. The warming along the Norwegian Coast can be due to NEED as it would cut off the cool and fresh water coming out of the North Sea. In FOCI-CTRL we expect a difference in temperature from location 1 to location 2 as between these locations some of the water enters the North Sea and gets colder and fresher as it leaves the North Sea and passes location 2. In FOCI-NEED the water can’t circulate through the North Sea and reaches location 2 without cooling or freshening. The correlation coefficients are not able to confirm this hypothesis overall. In the temperature the correlation coefficients are higher for FOCI-NEED at the depths of 3 m and 322 m which supports the hypothesis. At 134 m the correlation coefficients are not significant what we were not able to explain reasonably. The values for the slope of the linear regression in the scatter plots for FOCI-NEED are higher and therefore indicate that the warming along the Norwegian coast is at least partly due to NEED. A propagation of anomalies from location 1 all the way to location 11 would mean a direct impact of Impact of a Northern European Enclosure Dam on North Atlantic Climate Page 13
Corinna Buder

NEED on the circulation in the Nordic Sea and possibly on the AMOC. In our simulation
of 60 years we see two warm events in each run at 534 m depth that propagate from the
Scottish coast to the Labrador Sea. As the events occur in both runs and the frequency of
the events is low, it is not proven that building NEED has an influence on the propagation
of temperature anomalies around the Nordic Sea into the Labrador Sea. Yet more and
longer data are needed to give evidence if the changes caused by NEED have an impact
on the global circulation of the oceans.
The exchange of water between the North Sea and the North Atlantic at the northern
boundary of the North Sea has an amount of 2,22 Sv towards the North Sea and of 2,33 Sv
towards the North Atlantic from which 1,46 Sv have a salinity below 35 PSU (Winter &
Johannessen, 2006). The correlation of the salinity shows no uniform difference between
the two runs. The exchange leads to an inflow of warm and saline water into the North
Sea whereas the outflow brings colder and fresher water into NAC and therefore at the
Norwegian Coast. The lack of this exchange in FOCI-NEED apparently has a major effect
on the North Sea and leads to a warming of the upper 200 m along the Norwegian coast.
The warming would change the coastal climate in Norway. In winter the warmer ocean
releases heat into the atmosphere and thereby warms up the land, in summer less heat of
the land masses can be absorbed by the ocean as it is already warmer with NEED.
In our simulation the North Sea reacts to NEED in the expected way but the Baltic Sea
is not reproduced well. To get more convincing results for the Baltic and North Seas a
regional model with higher resolution is to prefer. The simulation reproduces the oceans
consistent, yet it showed differences between the two runs in the southern hemisphere
that can not be explained by NEED. These have to be due to different variability in the
two simulation runs, why we recommend a simulation with longer time periods to reach
a stable climate state before implementing NEED into the model. Additionally longer
runs with and without NEED exclude internal variability of atmosphere and ocean and
reduce the differences between the runs to those caused by NEED. As the currents in the
oceans take a long time to adapt to a change in the circulation longer simulations reflect
the long term effects of NEED on the global circulation.
We agree with Groeskamp and Kjellsson (2020) that we “emphasize that the conclusions
[...] advocate for immediate action to intensify and further climate mitigation efforts,
so that solutions with a scale and impact such as NEED are not going to be required”
(Groeskamp & Kjellsson, 2020, p. 4).

Impact of a Northern European Enclosure
Dam on North Atlantic Climate                                                     Page 14
Corinna Buder

5    References
Cariolle, D., Teyssèdre, H. (2007): A revised linear ozone photochemistry parameter-
ization for use in transport and general circulation models: multi-annual simulations.
Atmospheric Chemistry and Physics, 7, 2183-2196. doi:10.5194/acp-7-2183-2007,
http://www.atmos-chem-phys.net/7/2183/2007/

Chafik, L., Nilsson, J., Skagseth, Ø., Lundberg, P. (2015): On the flow of Atlantic water
and temperature anomalies in the Nordic Seas toward the Arctic Ocean. Journal of Geo-
physical Research Oceans, 120, 7897-7918. doi:10.1002/2015JC011012

Church, J. A., White, N. J. (2011): Sea-Level Rise from the Late 19th to the Early 21st
Century. Surveys in Geophysics, 32, 585-602. doi:10.1007/s10712-011-9119-1

Craig, A., Valcke, S., Coquart, L. (2017): Development and performance of a new version
of the OASIS coupler, OASIS3-MCT 3.0. Geoscientific Model Development, 10, 3297-
3308. doi:10.5194/gmd-10-3297-2017, https://www.geosci-model-dev.net/10/3297/2017/

Fichefet, T., Maqueda, M. A. M. (1997): Sensitivity of a global sea ice model to the treat-
ment of ice thermodynamics and dynamics. Journal of Geophysical Research: Oceans, 102
(C6), 12609-12646. doi:10.1029/97JC00480, http://doi.wiley.com/10.1029/97JC00480

Groeskamp, S., Kjellsson J. (2020): NEED The Northern European Enclosure Dam
for if climate change mitigation fails. Bulletin of the American Meteorological Society.
doi:10.1175/BAMS-D-19-0145.1

Haustein, K., Allen, M. R., Forster, P. M., Otto, F. E. L., Mitchell, D. M., Matthews, H.
D., Frame, D. J. (2017): A real-time Global Warming Index. Scientific Reports, 7, 15417.
doi: 10.1038/s41598-017-14828-5

IPCC (2014): Climate Change 2014: Synthesis Report. Contribution of Working Groups
I, II and III to the Fifth Assessment Report of the Intergovernmental Panel on Climate
Change [Core Writing Team, R.K. Pachauri and L.A. Meyer (eds.)]. IPCC, Geneva,
Switzerland

Kanji, G. K. (1999): 100 statistical tests, SAGE Publications Ltd, London

Impact of a Northern European Enclosure
Dam on North Atlantic Climate                                                     Page 15
Corinna Buder

Madec, G. (2014): NEMO ocean engine (Draft edition r5171). Tech. rep., Institut Pierre-
Simon Laplace (IPSL), France

Matthes, K., Biastoch, A., Wahl, S., Harlaß, J., Martin, T., Brücher, T., Drews, A.,
Ehlert, D., Getzlaff, K., Krüger, F., Rath, W., Scheinert, M., Schwarzkopf, F. U., Bayr,
T., Schmidt, H., Park, W. (2020): The Flexible Ocean and Climate Infrastructure Version
1 (FOCI1): mean state and variability. Geoscientific Model Development, 13, 2533-2568.
doi:10.5194/gmd-13-2533-2020

McCarthy, G. D., Brown, P. J., Flagg, C. N., Goni, G., Houpert, L., Hughes, C. W.,
Hummels, R., Inall, M., Jochumsen, K., Larsen, K. M. H., Lherminier, P., Meinen, C.
S., Moat, B. I., Rayner, D., Rhein, M., Roessler, A., Schmid, C., Smeed, D. A. (2019):
Sustainable observations of the AMOC: Methodology and Technology. Reviews of Geo-
physics, 57. doi:10.1029/2019RG000654

Perez, R., Baringer, M., Dong, S., Garzoli, S., Goes, M., Goni, G., Lumpkin, R., Meinen,
C., Msadek, R., Rivero, U. (2015): Measuring the Atlantic Meridional Overturning Cir-
culation. Marine Technology Society Journal, 49. doi:10.4031/MTSJ.49.2.14.

Rickels, W., Klepper, G., Dovern, J., Betz, G., Brachatzek, N., Cacean, S., Güssow, K.,
Heintzenberg J., Hiller, S., Hoose, C., Leisner, T., Oschlies, A., Platt, U., Proelß, A.,
Renn, O., Schäfer, S., Zürn M. (2011): Large-Scale Intentional Interventions into the Cli-
mate System? Assessing the Climate Engineering Debate. Scoping report conducted on
behalf of the German Federal Ministry of Education and Research (BMBF), Kiel Earth
Institute, Kiel

Temperton, C., Hortal, M., Simmons, A. (2001): A two-time-level semi-Lagrangian global
spectral model. Q. J. R. Meteorol. Soc., 127, 111-127

Winther, N. G., Johannessen, J. A. (2006): North Sea circulation: Atlantic inflow and its
destination, Journal of Geophysical Research, 111, C12018. doi:10.1029/2005JC003310

Impact of a Northern European Enclosure
Dam on North Atlantic Climate                                                      Page 16
Corinna Buder

6    Appendix

 Figure A.1: The difference of the temperature in ◦ C of the run with the dam and the
control run for the four seasons. The data are means over the 60 years of annual means
                                     at 3 m depth.

Impact of a Northern European Enclosure
Dam on North Atlantic Climate                                                 Page 17
Corinna Buder
Figure A.2: Hovmöller diagram for the ocean temperature in ◦ C at 3 m depth with the
locations 1 to 11 in the North Atlantic (Fig. 2).
Impact of a Northern European Enclosure
Dam on North Atlantic Climate Page 18Corinna Buder
Figure A.3: Hovmöller diagram for the ocean temperature in ◦ C at 989 m depth with
the locations 1 to 11 in the North Atlantic (Fig. 2).
Impact of a Northern European Enclosure
Dam on North Atlantic Climate Page 19Corinna Buder
Figure A.4: Time series of the temperature in ◦ C (left) and salinity in PSU (right) of
the original data; blue lines are location 1, red lines location 2 (Fig. 2); solid lines 3 m
depth and dotted lines 322 m depth
Impact of a Northern European Enclosure
Dam on North Atlantic Climate Page 20Corinna Buder Figure A.5: Time series of the temperature in ◦ C (left) and salinity in PSU (right) at 134 m depth of the original data; blue lines are location 1, red lines location 2 (Fig. 2) Impact of a Northern European Enclosure Dam on North Atlantic Climate Page 21
Corinna Buder

   Figure A.6: Correlation of the temperature at 3 m depth of the locations 1 and 2
                                       (Fig. 2).

  Figure A.7: Correlation of the temperature at 134 m depth of the locations 1 and 2
                                       (Fig. 2).

Impact of a Northern European Enclosure
Dam on North Atlantic Climate                                                 Page 22
Corinna Buder
Figure A.8: Correlation of the temperature at 322 m depth of the locations 1 and 2
(Fig. 2).
Figure A.9: Correlation of the salinity at 3 m depth of the locations 1 and 2 (Fig. 2).
Impact of a Northern European Enclosure
Dam on North Atlantic Climate Page 23Corinna Buder Figure A.10: Correlation of the salinity at 134 m depth of the locations 1 and 2 (Fig. 2). Figure A.11: Correlation of the salinity at 322 m depth of the locations 1 and 2 (Fig. 2). Impact of a Northern European Enclosure Dam on North Atlantic Climate Page 24
Eidesstattliche Erklärung
Hiermit erkläre ich, dass ich die vorliegende Arbeit selbständig und ohne fremde Hilfe
angefertigt und keine anderen als die angegebenen Quellen und Hilfsmittel verwendet
habe. Die eingereichte schriftliche Fassung der Arbeit entspricht der auf dem elektro-
nischen Speichermedium. Weiterhin versichere ich, dass diese Arbeit noch nicht als Ab-
schlussarbeit an anderer Stelle vorgelegen hat.

Kiel, den                                  Unterschrift:
You can also read