SATELLITE DERIVED EXTRACTION OF SPATIO - TEMPORAL VARIABILITY OF UPWELLING AND ITS INFLUENCE ON MARINE FISHERY RESOURCES
←
→
Page content transcription
If your browser does not render page correctly, please read the page content below
92 Journal of Marine Science and Technology, Vol. 26, No. 1, pp. 92-101 (2018 )
DOI: 10.6119/JMST.2018.02_(1).0003
SATELLITE DERIVED EXTRACTION OF
SPATIO - TEMPORAL VARIABILITY OF
UPWELLING AND ITS INFLUENCE ON
MARINE FISHERY RESOURCES
Kanmani Shanmuga Priya Rajkumar and Ramakrishnan Sunnambukulam Shanmugam
Key words: upwelling, sea surface temperature, chlorophyll concen- combined with the earth rotational effect known as ‘Coriolis
tration, fishery resources. effect’ leads to an uplift of deeper, cooler and nutrient rich sub-
surface water towards the surface replacing the warmer, less
nutrient surface water, the process known as Upwelling. The up-
ABSTRACT
welling process exhibits the mesosclae variability over the ocean
Upwelling is an essential mesoscale phenomenon as it con- surface in terms of spatial and temporal scale. The region of
tributes to regional as well as global marine biological pro- upwelling extends at ocean surface in several tens of kilometers
ductivity. The present study deals with utilization of QuikSCAT and from few day to months. It is necessary to detect the upwelling
derived wind speed and wind direction for delineating the po- zones along the coasts through its accurate driving sources as
tential zones of coastal upwelling with its spatio-temporal vari- it accounts around 50 percent of world’s fisheries. The quanti-
ability and its corresponding influence on fishery resources. The fication of strength and persistence of upwelling leads to quan-
Ekman mass transport and Ekman depth were used as the sig- tify the biological productivity of the Ocean. The Ekman theory
natures to locate and extract the mesoscale properties of upwelling explains quantitatively the physical mechanism of upwelling
such as spatial extent and temporal persistence. The upwelling due to atmospheric wind forcing at surface (Stewart, 2003). The
process is known to modulate the physical and biological pro- Ekman mass transport and Ekman layer depth were found to be
perties of the ocean surface. In order to confirm the existence the best and convenient indicators of coastal upwelling by Wass
of upwelling, the extracted upwelling filaments were related with et al. (2012).
the satellite derived chlorophyll concentration (CC) and sea sur- India has a long coast line of 8118 km including islands with
face temperature (SST), the process so called synergistic analysis. EEZ of 2.5 million km2 along the east and west directions con-
It was observed from the synergistic analysis that the upwelling stituting east and west coast of India. The whole west coast of
is associated with reduced SST and elevated CC which is an India receives the favorable wind forcing for upwelling develop-
indication of suitable environment for fishes. The two to three ment during the monsoon seasons. The investigation of Ocean-
fold increase was confirmed within the upwelling zone as com- ographic conditions in the Arabian Sea by Rao et al. (1992)
pared to outside region. The presence of demersal species in the indicate the possibility of Ekman transport and presence of dense,
30-50 m depth zone gives evidence for the aggregation of fishes cooler, nutrient rich water at surface through in situ data analysis.
in the upwelling zone. The combined analysis of upwelling, Muraleedharan et al. (1996) examined a coastal upwelling by
CC, SST and fishery catch data sets manifests that the upwelling analyzing the cruise samples collected during peak southwest
support the large quantity of fishes as compared to other regions monsoon season and they concluded that the analysis of wind
and the satellite based delineation and extraction of upwelling measurements indicated active upwelling along the southwest
properties is useful for exploration of fishery resources. coast of India, which gradually propagates towards the north.
Madhupratap et al. (2001) confirmed the start of upwelling at
the southern tip of west coast by May end and no upwelling was
I. INTRODUCTION
found north of Goa 16N and it does not occur along the coastal
The prevailing winds at a particular direction and strength waters of north in this month based on in situ observations.
The numerical simulation study on West coast of India by Rao
et al. (2008) state that the coastal upwelling off kochi is at its peak
Paper submitted 01/06/17; revised 04/10/17; accepted 07/24/17. Author for
correspondence: Kanmani Shanmuga Priya Rajkumar (e-mail: kanmanirajkumar@
during July and its intensity reduces towards north. Jayaram et al.
gmail.com). (2010) state that the Latitudinal Temperature Gradient (LTG)
Institute of Remote Sensing, Anna University, Chennai, Tamil Nadu, India. and strength of ekman transport are the good upwelling indices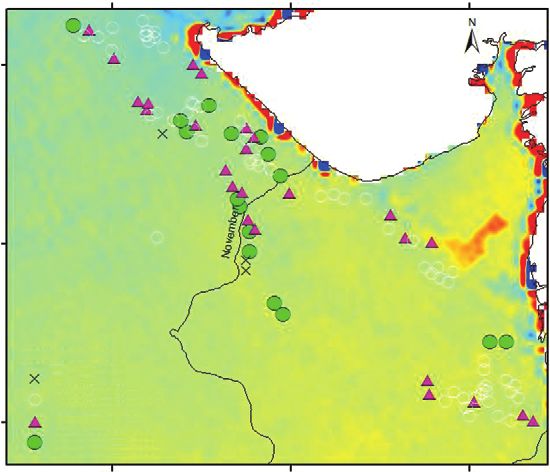
R. K. S. Priya and S. S. Ramakrishnan: Satellite Derived Extraction of Upwelling 93
and Upwelling is an annual phenomenon that predominantly the better understanding of water mass structure, properties and
occurs during southwest monsoon in the Southeastern Arabian its distribution (Solanki et al., 2003) and they also proved that
Sea. Smitha et al. (2014) characterized the upwelling along the the high probability exist for the aggregation of fish population
South West coast of India to be very weak during premonsoon at features such as fronts, rings, meanders, eddies and upwell-
periods and moderate during southwest monsoon months and it ing regions. Thus, the visible and infrared images are measuring
is strongest along the southern tip of India with OCM II winds and monitoring the oceanic condition feasible for marine living
of 2 m/s accuracy. organisms but these images are exhibiting the ocean features at
The annual marine fisheries production in India is 2.94 million short temporal scale only. The synergistic analysis of different
tons against the harvestable potential of 3.83 mt (Subramanian oceanic environmental parameters is useful in understanding
et al., 2014). According to marine fisheries information service the relationship between the physical, chemical and biological
report released during 1995 (CMFRI, 1995), the west coast of processes of ocean (Solanki et al., 2001a). The comparative ana-
India contributes to 73% of the annual average of fisheries pro- lysis of conventional fishery data products with satellite derived
duction from the whole Indian coast due to the rich concentra- findings leads to strengthen the capabilities of remote sensing
tions of prawns and pelagic fishes like sardines and mackerel technology for utilization in the marine dynamic ecosystem
whereas the coastal waters of east coast support smaller stocks studies.
of diversified fisheries. The catch composition varies between
the east and west coast as well as within the west coast. James II. MATERIALS AND METHODS
(1992) said that the whole western coast was divided broadly
into two in considering the topography, physical nature, sea bot- 1. Study Area and Data Products
tom, abundance and distribution the living species: the northwest The study area is the west coast of India of length 3314 km
coast comprising the maritime states of Gujarat and Maharashtra extending between 8N to 24N and 62E to 77E. It has a nar-
and southwest coast covering Goa, Karnataka, Kerala and west row continental shelf in the southern part and a wide continental
coast of Tamil Nadu. shelf in the northern part of the coast and it has two gulfs of
Madhupratap et al. (2001) analysed the fisheries along the Khambhat and Kutch in the Gujarat coast. The west coast of
west coast of India by dividing the whole west coast into the India is known to support the upwelling throughout the year due
region upto about 15N and the region to the north of 15N and to its seasonal wind reversal and geography of the coast line.
they concluded that the dominant catches in the north are car-
nivorous like Bombay duck, horse mackerel and ribbon fishes 1) Wind and Bathymetry Data Products
whereas from the southern coast planktonivorous based catches The level 2 daily wind products such as wind speed and wind
such as sardines, mackerels and anchovies are predominantly direction of QuikSCAT mission for the year 2000 were down-
caught. The total catch along the west coast is high during loaded from ftp://Podaac-ftp.jpl.nasa.gov. The spatial resolution
October-December and January-March quarters and it is lower of wind products is 12.5 km and wind speed accuracy is 1 m/s.
during mid year. James (1992) defined by the analysis of fishing The daily wind products were averaged to monthly products for
impact that the southwest coast of India is located with most pro- the purpose of monthly analysis. The modified ETOPO2 (En-
ductive fishing ground supporting the rich fisheries of Indian hanced Topography/Bathymetry) were obtained from the National
Mackerel, oil sardine, penaeid prawns. Madhupratap et al. (1994) Institute of Oceanography-Data Centre (NIODC) of NIO, Goa,
through their wide research on fishery and oceanographic con- India for the year 2000. (Sindhu et al., 2007)The modified ETOPO
ditions of oil sardine and Indian Mackerel state that the least 2 is a 2 arc minute gridded depth data product which is improved
quantity of catches and migration of the common pelagic fishes for its accuracy in the shallow region less than 200 m. The bathy-
during April-June is due to poor primary production and higher metric data was used to prepare the contour of 200 m depth.
SST during this season. They said that the wind driven upwelling
is one of the factors controlling the fishery. They also insist that 2) CC and SST Data Products
the upwelling is the main cause for the seasonal higher pro- The Level-3 standard mapped images(SMI) of CC at 9 km
ductivity in the southern coasts and cooling during winter plays 9 km from SeaWiFS sensor and SST at 4 km 4 km from
major role along 15N. NOAA AVHRR were obtained from ftp://podaac-ftp.jpl.nasa.gov.
The evolution of high resolution microwave remote sensing The Sea-viewing Wide Field-of-view Sensor (Sea-WiFS) has
data products makes possible to understand the spatial and tem- been serving as a primary source of ocean chlorophyll concen-
poral variability of Ocean mesoscale features. Unlike optical tration since 1997. Gregg and Casey (2004) assessed the quality
data products, the utilization of microwave data products help of the Sea-WiFS data sets over global Ocean and basins. They
to understand the influence of wind system over the Ocean du- stated that the Level-3 data product of Sea-WiFS is being pre-
ring the intense monsoon season also. The chlorophyll concen- ferred over lower levels for oceanographic biological applica-
tration was proved to be an excellent indicator of phytoplankton tion by the ratio of > 2:1 and they reported the RMS log error
concentration at euphotic depth and it is inversely varying with of Sea-WiFS chlorophyll to be 27.7% with r2 = 0.72 in the open
sea surface temperature (Solanki et al., 2001b). The estimation ocean compared to 33% RMS log error with r2 = 0.60 on the
of CC and SST through satellite remote sensing technology yields coasts globally. Desa et al. (2001) validated the SeaWiFS ocean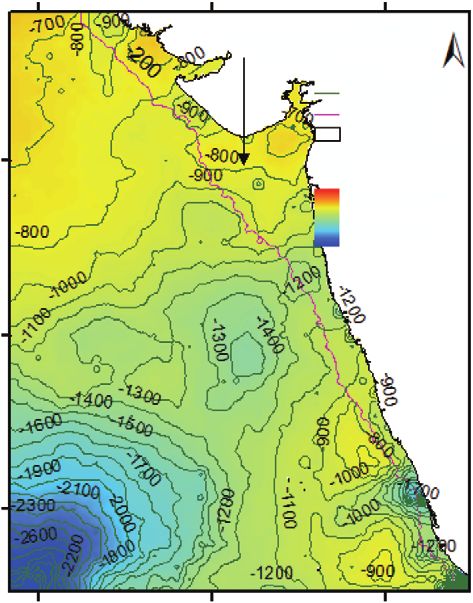
94 Journal of Marine Science and Technology, Vol. 26, No. 1 (2018 )
colour sensor in the coastal waters of the Eastern Arabian Sea Another parameter signifying the intensity of upwelling is
(the area used in this study) and they confirmed that the use of Ekman layer depth ‘DE’ which is the critical depth beyond
SeaWiFS data in the Eastern Arabian Sea underestimate the which water mass movement is not possible. The Ekman layer
chlorophyll concentration by 26%. Despite the underestima- depth is the dependent factor of the wind speed and latitude of
tion, the SeaWiFS data set was the predecessor and it is used as the place and its computation refers to Stewart (2003) with the
the reference data set for comparing the other sensors providing following form of equation.
the chlorophyll concentration such as MERIS, MODIS-Aqua,
MODIS-Terra (Djavidnia et al., 2010; Zhao, 2014). The similar 7.6
DE W10 , (3)
comparative analysis was done in the waters of Arabian Sea by sin
Kumar et al. (2015) and they concluded about the reliability of
other sensors over SeaWiFS. 3. Synergistic Analysis of Upwelling with SST and CC
In order to study the impact of upwelling process on other
3) Fishery Data Product
oceanic environmental parameters, the synergistic analysis was
The fish catch data were collected from Fishery Survey of conducted between potential upwelling zones and the corre-
India (FSI), Mumbai which is the central agency for surveying sponding satellite images of monthly SST and CC. For this pur-
the fishery resources in Indian seas. The fishing was conducted pose, the CC and SST images were brought to same spatial
with two vessels such as Matsya Mohini and Matsya Neerikshani resolution with wind data product as it has the lowest resolution
using trawl nets upto the depth of 200 m. The catch data consists among the utilized data products. The images of water mass trans-
of the geographic location (latitude, longitude), date, time, depth port, CC and SST were co-registered as it is necessary during
and catch weight for each fishing point. comparison. The contours of mass transport were generated and
Ekman mass transport contours were identified and converted
2. Calculation of Upwelling Indices
to vector. These vectors of Ekman mass transport signifies the
The Upwelling intensity can be estimated from Ekman mass spatial extent of upwelling filament. The upwelling filament
transport which is perpendicular to the direction of wind in that was overlaid with the SST and CC images in order to generate
region (Jayaram et al., 2010; Smitha et al., 2014). Ekman mass the composite product of upwelling signature and SST, CC
transport (Me) for the west coast of India was computed from the images.
bulk aerodynamic formula as used for satellite derived wind stress
by (koracin et al., 2004; Petiti et al., 2006) and the references 4. Fishery Resources Analysis
there in: The catch quantum at each fishing point was normalized
for unit fishing hour and it is termed as Catch Per Unit Effort
Across shore wind stress x a CDW10U , (1.a) (CPUE). The CPUE is a measure of fish population in large quan-
tity or amplitude of fish population at a particular geographical
location. The CPUE at all the fishing points were categorized
Along shore wind stress y a CDW10V , (1.b)
based on their statistical measures such as mean and standard
deviation. The categorized catch points were plotted on to the
Where a is density of air which is 1.29 kgm-3; W10 is the mag- composite images of monthly SST, CC with upwelling filament.
nitude of wind speed (at 10 m above the sea surface): U and V The spatial distribution and magnitude of classified normalized
are Zonal and meridional components of wind speed; CD is the catches was analyzed with the composite images. In order to find
frictional drag developed on the sea surface as the wind blows the relationship between the upwelling and fishery resources,
over the sea. The variable drag coefficient framed by Yelland the catch data sets caught within the upwelling region were eva-
and Taylor., 1996) was used to calculate CD. luated based on the evaluation methodology framed by Solanki
et al. (2005).
x
M ev , (2.a)
f III. RESULTS AND DISCUSSION
1. Analysis of Upwelling indices: Upwelling Identification
y
M eu , (2.b) The wind direction and wind speed are important forcing pa-
f
rameters involving in large water mass transports. The proposed
study utilized the QuickSCAT wind products which were found
Where Mev and Meu are the Ekman Mass Transport due to the to have high corrrelation with the coastal meteorological sta-
across-shore and along-shore winds respectively; f is the Coriolis tions derived winds as evidenced by Brunis et al. (2007).
parameter (2sin) (s-1), is the angular frequency of the earth
(s-1) and φ is the latitude. For the equator-ward wind, the nega- 1) Development of Upwelling
tive sign for Mev is taken as offshore transport (upwelling) and The particular wind direction and intensity along with the spe-
vice versa (Pankajakshan et al., 1997). cific coastal orientation are the causes of upwelling development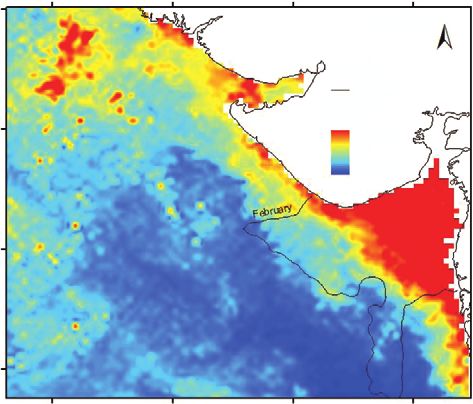
R. K. S. Priya and S. S. Ramakrishnan: Satellite Derived Extraction of Upwelling 95
65°E 70°E 75°E 65°E 70°E 75°E
Legend N Ekm an Transport N
contour
Wind Legend
direction (deg)
Mass Transport
0.0-241.4 200 m isobath
200 m isobath Coast line
20°N Coast line 20°N Wind Speed (kg/m.s)
Wind Speed (m/s) Value
Value High: 514.6
High: 9.6
Low: -5854
Low: 0
15°N 15°N
10°N 10°N
65°E 70°E 75°E 65°E 70°E 75°E
(a) (b)
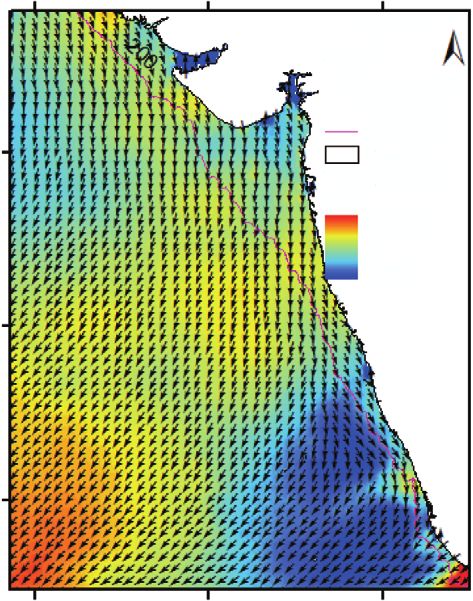
Fig. 1. (a) Wind speed with superimposed wind directions. (b) Zonal surface mass transport with contours of zonal offshore Ekman transport for the
month of January.
65°E 70°E 75°E 65°E 70°E 75°E
Legend N N
Legend
January January
August August
December December
February February
20°N July 20°N July
June June
November November
September September
Coast line Coast line
15°N 15°N
10°N 10°N
65°E 70°E 75°E 65°E 70°E 75°E
(a) (b)
Fig. 2. (a) Monthly pattern of Ekman Depth along the west coast of India. (b) Potential zones of Upwelling along the west coast of India.
(Rocha et al., 2013) through Ekman mass transport. The west veloped by the across shore winds towards the coast.
coast of India is oriented along the meridional axis with an angle The surface wind vectors for the month of January were over-
of 24 with north (Shetye, 1984). The offshore Ekman transport laid on to the continuous image of wind speed. During the month
in the zonal direction and upwelling development start as the of January, the winds are north easterly and north westerly along
meridional winds coincide with the coastline orientation whereas the southern coasts and northerly along the northern portion of
the offshore Ekman transport in the meridional direction is de- west coast of India as depicted in Fig. 1(a).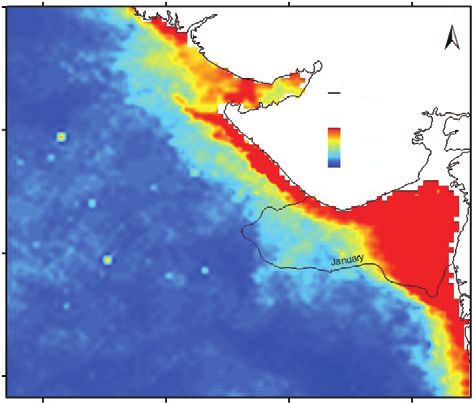
96 Journal of Marine Science and Technology, Vol. 26, No. 1 (2018 )
Table 1. Upwelling properties of West coast of India for the year 2000.
Upwelling Indices
Months Latitudes (N)
Ekman Transport (kg/m.s) Ekman Depth (m) Intensity
January 19.8 to 20.8 800 78 Moderate
February 19.8 to 20.8 800 80 Moderate
June 8.6 to 12.5 2800 130 Intense
July 8.4 to 13.3 2900 130 Intense
August 9.8 to 13.5 2000 110 Intense
September 14.4 to 21 800 80 Moderate
November 17 to 20.4 800 70 Moderate
December 16.2 to 20.5 800 75 Moderate
10
9.5 Kerala strong north westerlies of 6 m/s. The corresponding monthly
9
8.5
Kernataka patterns of Ekman depth contours are depicted in the Fig. 2(a).
Wind speed (m/s)
8 Maharashtra
7.5 Gujarat
7 2) Non-Favorable Wind Forcing for Upwelling
6.5
6
5.5 The favorable condition for offshore transport was not found
5
4.5 in the month of March during which the winds are prevailing
4
3.5 parallel to the whole west coast of India. This is due to the re-
3
duced wind speed of less than 5 m/s all along the coast. In the
y
ry
ch
il
ay
ne
ly
t
r
r
D ber
r
Se us
be
e
be
ar
pr
month of April, the North westerly winds continue to blow pa-
Ju
ob
ua
ar
M
Ju
ug
nu
em
em
em
A
M
br
ct
A
Ja
pt
O
ov
ec
Fe
rallel to the coast between 9N to 18N but the lesser wind speed
N
Months of the year 2000
of 5 m/s restricts the experience of Ekman transport. The lati-
Fig. 3. Wind speed variability of all the months of 2000. tudes from 18N to 23.5N receive the favorable wind strength
as shown in Fig. 3 but it is dominated by the shoreward wind
pattern.
The southern coasts from 8.2N to 15.6N receive the re-
duced wind speed less than 5 m/s and it does not develop the 2. Upwelling during Southwest Monsoon
required stress over the surface to transport the water mass. The During the month of May, the magnitude of wind has strength-
development of strong upwelling is possible during high wind ened to 6 m/s along the whole west coast which is an indication
speed especially greater than 5 m/s and parallel to the coast line of premonsoon wind development but the Ekman transport was
as found by Wass et al. (2012). With the progress to higher la- not observed as the winds blow towards the coast along the whole
titudes from 15.6N to 19.6N higher wind speed greater than western coast.
6 m/s do not favor the mass transport as the winds are non-parallel
to the coast. Between the latitudes from 19.6N to 20.6N, the 1) Initiation of Upwelling
average wind speed of 5.5 m/s blowing parallel to the coast During June, the onset of southwest monsoon peaks the wind
develop the along shore wind stress which is comparatively strength to 9 m/s in the southern coasts between 8.2N to 15N.
high than that of across shore wind stress and leads to transport The shoreward wind tend to produce the Ekman mass trans-
the water mass of 800 kg/m.s in the zonal direction away from port of 2800 kg/m.s in the meridional direction between the
the coast known as ‘Ekman mass transport’ as shown in the latitudes from 8.6N to 12.5N as shown in the Fig. 2(b) with
Fig. 1(b). The satellite derived image and its overlaid contours an Ekman depth to be 130 m which is comparative to the state-
(Fig. 1(b)) of the mass transport gives the clear distinction be- ment by Kampf (2010) that the typical thickness of Ekman layer
tween the offshore transport and non-offshore transport. The varies from 50 m to 150 m. The higher strength of Ekman trans-
total depth of the wind driven layer or Ekman layer depth was port and Ekman depth is an indication of intense upwelling be-
found to be 78 m. The Fig. 3 portrays the wind speed at all the tween 8.6N to 12.5N as shown in Table. 1.
latitudes along the coastal states of west coast. Similar analysis
was carried out for all the months of the year 2000. 2) Intensification and Persistence of Upwelling
In the month of February, though the north westerly winds During July, the fall of 2.5 m/s and change in the wind direc-
blow parallel to the whole western coast, the Ekman transport tion to be northwest and parallel as well to the coast between
was not found between 8.2N to 19.8N as the weaker winds 8.4N to 9.3N induces the zonal off shore Ekman transport
of 5.5 m/s are dominating the favorable wind directions. How- and the latitudes from 9.3N to 13.3N, the previous month mon-
ever between 19.8N to 20.8N, the previous month forcing pa- soon wind of 9 m/s continue to develop the meridional trans-
rameters and zonal offshore Ekman transport are stabilizing with port. These zonal as well as meridional transports lead to move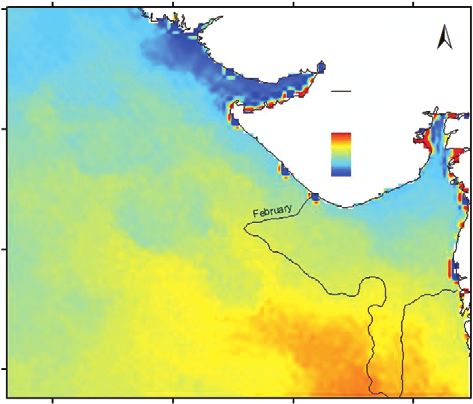
R. K. S. Priya and S. S. Ramakrishnan: Satellite Derived Extraction of Upwelling 97
66°E 68°E 70°E 72°E 66°E 68°E 70°E 72°E
22°N N 22°N N
Legend Legend
Upwelling Upwelling
SST (degC) CC (mg/m3)
Value Value
20°N High: 34 20°N High: 11
Low: -3 Low: 0.2
18°N 18°N
16°N 16°N
66°E 68°E 70°E 72°E 66°E 68°E 70°E 72°E
(a) (b)
Fig. 4. (a) Composite image of SST and upwelling filament for January. (b) Composite image of CC and upwelling filament for January.
66°E 68°E 70°E 72°E 66°E 68°E 70°E 72°E
22°N N 22°N N
Legend Legend
Upwelling Upwelling
SST (degC) CC (mg/m3)
Value Value
20°N High: 34 20°N High: 11
Low: -3 Low: 0.2
18°N 18°N
16°N 16°N
66°E 68°E 70°E 72°E 66°E 68°E 70°E 72°E
(a) (b)
Fig. 5. (a) Composite image of SST and upwelling filament for February. (b) Composite image of CC and upwelling filament for February.
the Ekman mass of 2900 kg/m.s between 8.4N to 13.3N with transport along the whole western coast even though the wind
an Ekman depth of 140 m as evidenced from the Ekman trans- direction has changed to be favorable for offshore transport
port contours portrayed in Fig. 2(b) The magnitude of upwelling between 8.2N to 23.5N.
indices signifies the strong persisting upwelling event.
3. Upwelling During Northeast Monsoon
3) Decaying Upwelling Event The less strengthened premonsoon winds below 5 m/s of
In the month of August, there is a reduction in the wind speed Northeast monsoon continue to prohibit the offshore transport
along the whole west coast by 1 m/s as found from the Fig. 3. during November up to 17N. The Fig. 2(b) shows that the la-
The extent of the Ekman transport shifts towards north extending titudes between 17N to 20.4N develop the offshore zonal trans-
from 9.8N to 13.5N with the meridional Ekman movement port of 800 kg/m.s. This transport is due to the north and north
of 2000 kg/m.s. easterlies which are parallel to the coast with feasible wind speed
In the month of September, the wind reduces its strength to of 6 m/s. The intense northeast monsoon winds of 6 m/s during
be less than 6 m/s all along the western coast. The latitudes from December stabilize the zonal Ekman transport of 800 kg/m.s
14.4N to 21N receive the upwelling favorable wind condi- between 17N to 20.4N as shown in Fig. 2(b).
tions to be north westerlies of 5.5 m/s blowing parallel to the
coast and develop the zonal offshore Ekman transport of 800 4. Influence of Upwelling on Other Oceanic
kg/m.s. The other southern coasts are not experiencing the Ekman Environmental Parameters and Processes
transport due to lesser wind speed. The reduced wind speed to The spatial extent of potential upwelling zone for the months
be less than 5 m/s during October prohibits the Ekman mass of January and February were overlaid as vector layers onto the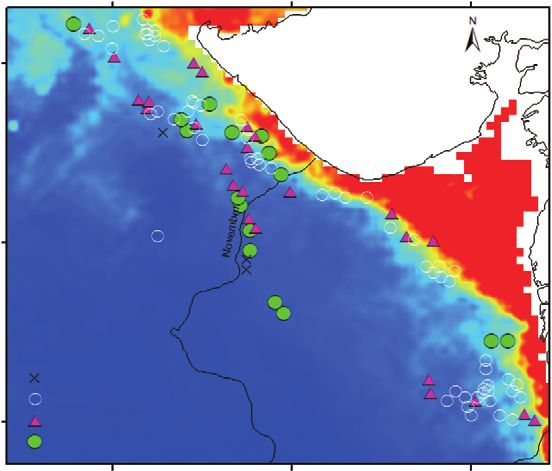
98 Journal of Marine Science and Technology, Vol. 26, No. 1 (2018 )
Table 2. Statistical significance of key species within and outside of upwelling region.
Species contribution within upwelling Species contribution outside of upwelling %
Increase
Key Species Habitat Standard Standard % Mean Standard Standard % Contribution
Mean CPUE in
Deviation (SD) Error (SE) Contribution CPUE Deviation (SD) Error (SE) Over upwelling
upwelling
DECAPTERID Columner 39.6 64.2 9.1 60.1 9.7 11.7 1.6 14.7 308.6
RIBBON_FIS Pelagic 10.7 18.2 2.6 16.3 4.1 8.9 1.2 6.2 164.4
DHOMA Demersal 9.3 21.6 3.1 14.1 2.5 7.2 1.0 3.8 270.5
SQUIDS Column/pelagic 3.2 5.2 0.7 4.8 0.7 1.1 0.2 1.0 360.6
BARRACUDA Pelagic 3.1 5.3 0.7 4.7 0.7 1.4 0.2 1.0 356.8
satellite derived images of SST and CC for the corresponding 68°E 70°E 72°E
months shown in Figs. 4 and 5 respectively.
The cold water mass with a surface temperature of 24C in 22°N
average was identified within the upwelling zone which is lower
than the surrounding temperature of 27C as shown in the Fig.
4(a). Thus, the noticeable reduction in the temperature towards
the coast is the significance of active upwelling along the coast.
The persistence in the upwelling as shown in Fig. 5(a) depicts 20°N
the further reduction of 1C.
The uplift of bottom surface water due to upwelling takes the
oxygen depleted, cool and nutrient rich water mass from the
CPUE_November
lower depths to surface where the biological productivity be-
0-17 (least)
gins as a result of photosynthesis activity. It was observed from 18-84 (moderate)
the Figs. 4(b) and 5(b), the growth of CC is very high within 18°N 85-152 (high)
153-335 (highest)
the upwelled region than the outside region. Also the chlorophyll
has well distributed to the whole extent of upwelling filament. 68°E 70°E 72°E
The peak strength of 2 mg/m3 observed as shown in Figs. 4(b) Fig. 6. The real time fishing locations superimposed onto the composite image
and 5(b) gives the evidence for the increased accumulation of of CC and upwelling boundary. (where the symbol X ‒ indicates the
phytoplankton concentration within the upwelling region. CPUE [< (µ ‒ σ)], white hollow O‒indicates [(µ ‒ σ) to < µ ], filled
Δ‒indicates [µ to ≤ (µ + σ)], filled O‒indicates above [> (µ + σ)]).
5. Influence of Upwelling over the Marine Fishery
Resources
The typical CC and SST images with upwelling filament 68°E 70°E 72°E
for the month of November (Figs. 6 and 7) were overlaid with
a corresponding real time fishing effort. The fishing was con- 22°N
ducted at 105 locations in and around the upwelled region. The
catch concentrations portrayed are the classified CPUEs. The
parameter mean is considered as an indicator of amplitude and
all the locations having the CPUE of [( ) to ] are con-
sidered as moderate amplitude locations and the locations with
[ to ( )] are high amplitude locations and where the 20°N
CPUE is above ( ) are indicated as the highest population
strength locations. The least strengthened locations are having
the effort less than ( ). Except least strength locations, all the CPUE_November
other locations are termed as the potential fishing locations. 0-17 (least)
18-84 (moderate)
The fishing was done at 50 geographical locations within the 18°N 85-152 (high)
upwelling boundary with well spatial distribution in the northern 153-335 (highest)
and southern portion of the filament. The filament shows the 68°E 70°E 72°E
high CC with a peak strength of 2 mg/m3 and SST of 28C. It Fig. 7. The real time fishing locations superimposed onto the composite image
was observed that the catch quantum is highly available at all of SST and upwelling boundary. (where the symbol X‒indicates the
the locations within the filament and only two locations were CPUE [< (µ ‒ σ)], white hollow O‒indicates [(µ ‒ σ) to < µ ], filled
found to be the least quantum of fish population CPUE. Δ‒indicates [µ to ≤ (µ + σ)], filled O‒indicates above [> (µ + σ)]).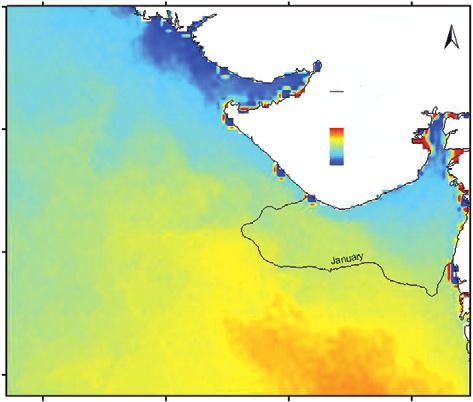
R. K. S. Priya and S. S. Ramakrishnan: Satellite Derived Extraction of Upwelling 99
50
45
% contribution of species caught within upwelling
40
35
Mean CPUE (kg/hr)
30
25
20
15
10
5
0
RK
A
CA SH
RA I
S
L
O H
IS
A
H S
A
L
LI TH
IP RD
U RID
S
M LE S
Y ISH
CH A K
X
PT S
A D
TE
ER L
R
TH
Y
ID
ID
BO TT ID
U
CA E
O
SS RE
A
D
BB FIS
LY AV
M
C
RI N
EL RI
_F
E
A
FI
EC M
H
O
A
EM A
U
_S
CU
A
EM
O
N
CU QU
BA F
N
TE
E
LE KE
N
C
G
K
SH
N ZZ
_D
C_
RI T_
PO AL
R
D NE
PE
A
D
S
N
C
IS
K
A
RR
C
IA
A
M
O
M
PR
BA
Spcies caught within upwelling
Fig. 8. Percent contribution of all the species caught within the upwelling region.
1) Evaluation of Fishery Resources 100
Mean CPUfE (kg/hr)
80 30-50 50-100 100-120
The trawl fishing in and around the upwelling region results 60
in the pelagic, columner and demersal species. The fishing at 50 40
locations within the upwelling produced the 25 various types 20
of fish catches such as Shark, Barracuda, Priacanthi, Rays, EEL, 0
DECAPTERID RIBBON_FISH DHOMA SQUIDS BARRACUDA
Cat fish, Ribbon fish, Kalava etc., as shown in the Fig. 8. The
trawl fishing produces the average fishing effort of 79.1 kg/hr Key Species of upwelling
with the total catch. In order to find the relationship between the Fig. 9. Depth wise contribution of the key species of upwelling region.
upwelling and fishery resources, the evaluation method framed
by Solanki et al. (2005) was adopted. The population index
for a particular fish type caught was calculated for each fishing The Fig. 9 indicates the depth wise contribution of the key
haul. The mean of all the sample values is called as species wise species of upwelling region. The fishing depth was classified
monthly mean CPUE. into three regions such as 30-50 m, 50-100 m and 100-120 m.
The Fig. 8 indicates the percent contribution of all the spe- Being the demersal species, the dhoma fish contributes more in
cies caught within the upwelling region. The fish types of Shark, the upper layers of 30-50 m depth. All the pelagic species are
Priacanthi, Rays, EEL, Kalava, Polynemids, Ghol, Lizzard, showing the well distribution up to the depth of 100 m. High
Upenids, Bombay_duck, Caranx, Chorinemus, Elalacate, Mackerel, catches of columner fishes are existing in 50-120 depth.
Lesser_Sardine and misc fishes are contributing low within the
upwelling. The moderate catches were obtained from Cat fish,
DISCUSSION
Koth, Nemipterid, Cuttle fish and the species wise monthly mean
CPUE contributing 3 kg and above was considered as key spe- The space view of upwelling indices is useful in extracting
cies producing high fishing efforts. It was observed that the the location and extent of the upwelling zones at spatial and tem-
fishes Barracuda, Ribbon fish, Dhoma, Squid and Decapterid poral scales. This intra annual analysis indicate that the west
are the key species obtained from the upwelled region. coast of India receives the possibility of upwelling development
The Table 2 gives the details of key species with its statistical throughout the year and almost the complete west coast stretch
significance. Upwelling exhibits the aggregation of potential key is lying in the high probable zone of upwelling development.
species at the pelagic, columner and demersal habitats as well. The upwelling starts during southwest monsoon in the southern
Decapterid is the highest contributor among the key species of end of west coast and it progress to the northern latitudes during
upwelling. About 90% of the contribution is made by the species Northeast monsoon.
Decapterid, Ribbon fish and dhoma together. Comparatively, The lowest Ekman depth value is greater than the typical thick-
the lowest catches of key species were obtained from outside ness of the Ekman layer depth which indicate that always the
of the upwelling region. About two fold increase was observed significant nutrients will be brought up to surface, thereby in-
from the Ribbon fish and other key species were attained three itiating the feasible zone for photosynthetic activity. The higher
fold increase in the upwelling region as compared to outside strength of Ekman transport and Ekman depth is an indication
region. of intense upwelling. The intense upwelling during southwest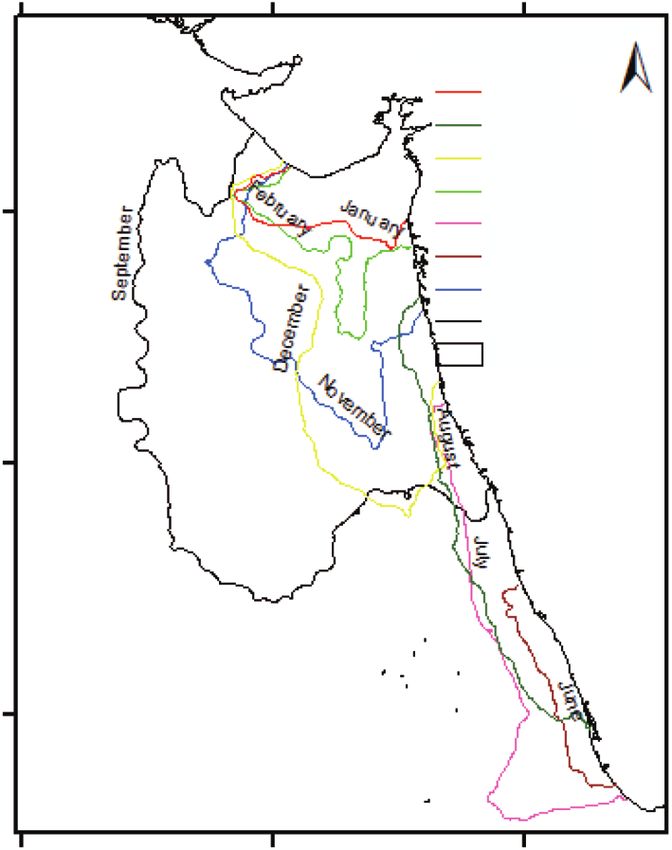
100                                Journal of Marine Science and Technology, Vol. 26, No. 1 (2018 )

monsoon signifies the possibility of increased biological activity     ficant amount of fish population arrived at the upwelling region.
as the water masses are brought to surface from the higher depths      This is reasonably high as compared to the mean CPUE of out-
where nutrient levels are high.                                        side region. The phytoplankton growth in the euphotic zone
                                                                       by photosynthesis activity as a result of nutrient enrichment
1. Impact of Upwelling Event over SST and CC                           maintains the region of upwelling with food and the presence
    The reduced SST identified within the upwelling zone proves        of dense cool upwelled water develops the physiologically suit-
that the Ekman transport brings the cool water from the lower          able environment for the aggregation of fishes.
depths to surface(Rao et al., 1992; Muraleedharan et al., 1996).          The high concentration of demersal fishes caught in the depth
The observed persistence in the upwelling areas has the posi-          zone of 30-50 m gives the strong evidence for the migration of
tive influence on SST also. The spatial comparative analysis           bottom living fishes to surface for their food as a result of up-
between the upwelling signatures and it’s corresponding SST            welling. The pelagic fishes exist in the depth zone of 30-100 m
image better explain the physical changes in the oceanic en-           which is coinciding with the Ekman layer depth of 100 m. The
vironment due to wind induced oceanic circulations. The pre-           transported water from surface to Ekman depth is replaced by
sence of cool water mass indicates the high probability for the        the dense cool nutrient rich water supporting growth of phy-
arrival of other living resources especially zooplankton and other     toplankton due to photosynthesis activity as the Ekman depth
fishes as they would generally prefer the cool environment for         comes well with in the light penetration depth.
their livelihood.                                                         The upwelling is the region where the significant quantum
    The occurrence of cold SST and increased Net primary Pro-          of fishes are aggregating at euphotic depth for food and suitable
ductivity due to upwelling was confirmed by Rodriguez et al.           physiological condition from all the habitats such as Pelagic,
(2012). The enhanced growth of CC in the upwelling zone in-            demersal and Columner fishes. The ecosystem of upwelling is
dicates that the upwelling induces the biological productivity         diverse as the 25 different types of fishes were caught in the up-
of the ocean by developing the feasible environmental condi-           welling region. The dominant species of upwelling are com-
tions for photosynthesis activity due to nutrient enrichment. Also,    mercially important and their potential strength over outside
the highest CC in the upwelling regions is an indication of oceanic    region exhibit the upwelling as the major contributor for the
environment with an available food resources for zooplankton           fishery and its management. The persisting upwelling continue
and other fish population to aggregate for feeding and spawn-          to attract the fishery resources for suitable living environment.
ing which may attract the large predators too.
    The study of upwelling signature with SST and CC com-                                       V. CONCLUSION
posites manifests that the upwelling results in the reduced SST
and enhanced phytoplankton concentration which is the suit-               The satellite derived extraction of upwelling zone along the
able site with high probability of accumulation of fish popu-          west coast of India implies that the intensity of Southwest mon-
lation. Also, this synergistic analysis strengthen the fact that the   soonal upwelling is very high as compared to northeast coun-
physical and biological processes are closely interlinked and          terpart whereas the persistence along the northern coasts due
the identification of potential upwelling zones helps to charac-       to northeast monsoon is predominant than that of Southwest
terize the biologically productive oceanic environment feasible        monsoon. The upwelling off northern coasts are more extensive
for living resources. The upwelling persists for a longer dura-        and covers larger area than southern upwellings. The inter mon-
tion in months during monsoon seasons. The satellite derived           soon and premonsoon months such as March, April, May and
analysis imply that the persistence in the upwelling produces          October are not receiving the upwelling magnitude due to non-
the direct impact on the SST and CC also. The temperature of           favorable wind forcing. The utilization of satellite data pro-
the ocean surface is susceptible to solar influx into the surface.     ducts are much useful in delineating the upwelling zones as the
So, the temperature feature captured by thermal sensors will fade      upwelling process is mesoscale ocean circulation and it covers
away over a short time span of days or weeks. The tenacious            the vast spatial and temporal extent. The synergistic analysis
capability of upwelling event makes the sea surface to recover         of upwelling extent with other oceanic environmental para-
the cool environment often. The visible color sensors portray          meters implies that the upwelling plays a major role in surface
the CC features disappearing in a short time length as the total       water mass cooling and intensified biological production. The
life cycle of the phytoplankton end up within days or weeks. A         probability for large quantum of fishery resources is high within
particular upwelling event incurs many number of phytoplankton         the upwelling zones as it act as the reservoir of food resources.
cycles in the euphotic depth. Thus, the delineation of upwelling       The persistent upwelling event leads to support the develop-
zone at spatial and temporal scale helps to describe the ocean         ment of strong food chain in the ecosystem. The delineation of
environment with persisting thermal and color gradients.               spatial and temporal variability of upwelling helps to define the
                                                                       feasible environment for exploring the fishery resources.
2. Fishery Resources within Upwelling
    The fish catch analysis within the upwelling shows that the                                   REFERENCES
upwelling region supports the arrival of high fish populations.        Brunis, P. P., M. Lopez, A. P. Sierra and J. Pineda (2007). Comparison of up-
It is evident from the mean CPUE of 79.1 kg/hr that the signi-             welling indices off Baja California derived from three different wind data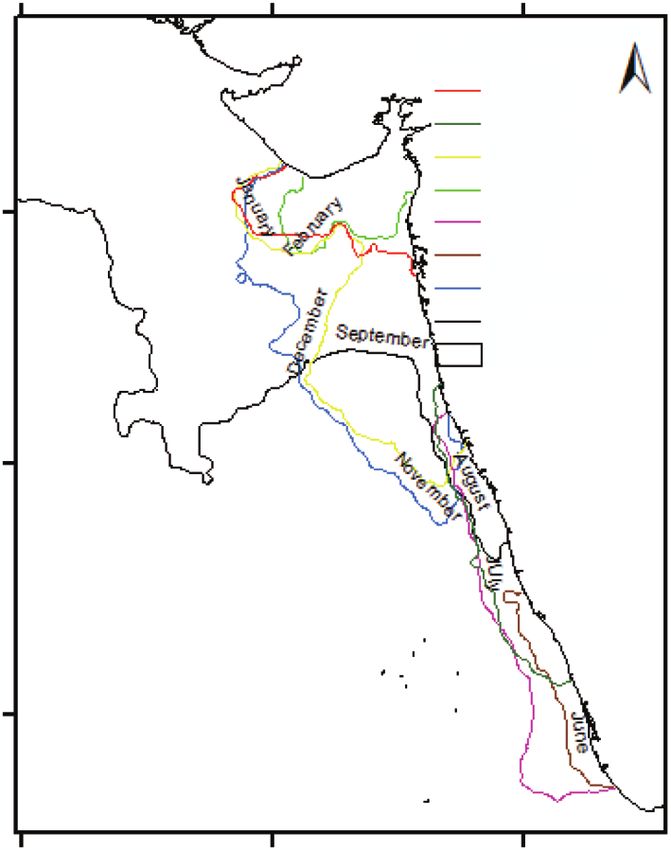
R. K. S. Priya and S. S. Ramakrishnan: Satellite Derived Extraction of Upwelling                                                    101

     sources. CalCOFI Report 48, 204-214.                                                58, 213-226.
Central Marine Fisheries Research Institute (CMFRI) (1995). Marine Fisheries         Rocha, C., N. Cordeiro, R. Nolasco and J. Dubert (2013). Numerical modelling
     Information Service. Vol. 136, 30.                                                  of the phytoplankton patterns in an upwelling event off the NW Iberian Mar-
Desa, E., T. Suresh, S. G. P. Mantondkar and E. Desa (2001). Sea truth validation        gin. Journal of Coastal Research. Special issue 65, 117-122.
     of Ocean colour sensor in the coastal waters of the eastern Arabian Sea.        Rodriguez, G. E., T. Castro, G. G. Castro, L. Zamudio and R. C. Duarte (2012).
     Current Science 80(7), 854-860.                                                     Net primary productivity, upwelling and coastal currents in the Gulf of
Djavidnia, S., F. Mélin and N. Hoepffner (2010). Comparison of global ocean              Ulloa, Baja California, Mexico. Ocean science 8,703-711.
     colour data records. Ocean Science 6, 61-76.                                    Shetye, S. R. (1984). Seasonal variability of temperature field off south-west
Gregg, W. W. and N. W. Casey (2004). Global and regional evaluation of SeaWiFS           coast of India. Proceedings of the Indian Academy of Sciences (Earth and
     chlorophyll data set. Remote Sensing of Environment 93, 463-479.                    Planetary Sciences) 93, 399-411.
James, P. S. B. R. (1992). Impact of fishing along the west coast of India during    Sindhu, B., I. Suresh, A. S. Unnikrishnan, N. V. Bhatkar, S. Neetu and G. S. Mi-
     southwest monsoon period on the finfish and shellfish resources and the             chael (2007). Improved bathymetric datasets for the shallow water regions
     associated management considerations. Bull. Cent. Mar. Fish. Res. Inst. 45,         in the Indian Ocean. Journal of Earth System Science 116(3), 261-274.
     251-259.                                                                        Smitha, A., K. A. Joseph, K. C. Jayaram and A. N. Balchand (2014). Upwelling
Jayaram, C., N. Chacko, K. A. Joseph and A. N. Balchand (2010). Interannual va-          in the southeastern Arabian Sea as evidenced by Ekman mass transport using
     riability of upwelling indices in the Southeastern Arabian Sea: A satellite         wind observations from OCEANSAT-II Scatterometer. Indian Journal of
     based study. Ocean Science Journal 45(1), 27-40.                                    Geo-Marine Sciences 43(1), 111-116.
Kampf, J. (2010). Advanced Ocean Modelling using Open source Software.               Solanki, H. U., R. M. Dwivedi and S. R. Nayak (2001a). Synergistic analysis
     1DModels of Ekman Layers. XIII, Springer Heidelberg Dordrecht London                of SeaWiFS chlorophyll concentration and NOAA-AVHRR SST features
     New York.                                                                           for exploring marine living resources. International Journal of Remote
Koracin, D., C. E. Dorman and E. P. Dever (2004). Coastal perturbations of               Sensing 22(18), 3877-3882.
     marine-layer wind, wind stress and wind stress curl along California and Baja   Solanki, H. U., S. M. Dwivedi, S. R. Nayak (2001b). Application of Ocean Colour
     California in June 1999. Journal of Physical Oceanography 32, 1152-1173.            Monitor chllrophyll and AVHRR SST for fishery forecst: Preliminary va-
Kumar, A. S. V. V., K. N. Babu and A. K. Sukhla (2015). Comparative analysis             lidation results off Gujarat coast, northwest coast of India. Indian Journal
     of chlorophyll-a distribution from SeaWiFS, MODIS-Aqua, MODIS-                      of Marine Science 30, 132-138
     Terra and MERIS in the Arabian Sea. Marine Geodesy 38, 40-57.                   Solanki, H. U., R. M. Dwivedi and S. R. Nayak (2003). Fishery forecast using OCM
Madhupratap, M., S. R. Shetye, K. N. V. Nair and S. R. Sreekumaran Nair (1994).          chlorophyll concentration and AVHRR SST: validation results off Gujarat
     Oil sardine Indian mackerel :their fishery, problems and coastal oceanog-           coast, India. International Journal of Remote Sensing 24(18), 3691-3699.
     raphy. Current Science 66(5), 340-349.                                          Stewart, R. H. (2003). Introduction to physical Oceanography. Response of the
Madhupratap, M., K. N. V. Nair, T. C. Gopalakrishnan, P. Haridas, K. K. C.               Upper Ocean to winds. 135-150.
     Nair, P. Venugopal and M. Gauns (2001). Arabian Sea oceanography and            Solanki, H. U., P. C. Mankodi, S. R. Nayak and V. S. Somvanshi (2005). Eva-
     fisheries of the west coast of India. Current Science 81(4), 355-361.               luation of remote-sensing based potential fishing zones (PFZs) forecast me-
Muraleedharan, P. M. and S. P. Kumar (1996). Arabian Sea upwelling – A com-              thodology. Continental Shelf Research 25, 2163-2173.
     parison between coastal and open ocean regions. Current Science 71, 842-846.    Subramanian, S., G. B. Sreekanth, N. Manjulekshmi, N. P. Singh, J. Kolwalkar, T.
Pankajakshan, T., J. Pattnaik and A. K. Ghosh (1997). An Atlas of upwelling in-          Patil and P. M. Fernandes (2014). Manual of the use of Potential Fishing
     dices along east and west coast of India. Indian Oceanographic Data Centre,         Zone (PFZ) forecast. Technical bulletin. 40, ICAR Research Complex of Goa
     NIO, India.                                                                         (Indian Council of Agricultural Research), Old Goa-403 402, Goa, India.
Petit, M., A. G. Ramos, F. Lahet and J. Copa (2006). Satellite - derived ERS Scat-   Wass, H. J. D., V. P. Siregar, I. Jaya and J. L. Gaol (2012). Coastal Upwelling under
     terometer – sea surface wind stress curl in the southwestern Indian Ocean           the influence of westerly wind burst in the North of Papua continent, Western
     Geoscience 338, 206-213.                                                            Pacific. International Journal of Remote Sensing and Earth Sciences 9(2),
Rao, D. S., C. P. Ramamirtham, A. V. S. Murty, S. Muthusamy, N. P. Kunthi-               128-139.
     hrishnan and L. R. Khambadkar (1992). Oceanography of the Arabian Sea           Yelland, M. and P. K. Taylor (1996). Wind stress measurements from the open
     with particular reference to the southwest monsoon. Bull. Cent. Mar. Fish.          ocean. Journal of Physical Oceanography 26, 541-558.
     Res. Inst. 45, 4-8.                                                             Zhao, W. J., G. Q. Wang, W. X. Cao, T. W. Cui, G. F. Wang and J. F. Ling (2014).
Rao, A. D., M. Joshi and M. Ravichandran (2008). Oceanic upwelling and down-             Assessment of SeaWiFS, MODIS, MERIS ocean clolour productsin the
     welling processes in waters off the west coast of India. Ocean dynamics             south china sea. International Journal of Remote sensing 35, 4252-4274.
You can also read