Quantification of earthquake diagnostic effects to assess low macroseismic intensities
←
→
Page content transcription
If your browser does not render page correctly, please read the page content below
Natural Hazards
https://doi.org/10.1007/s11069-020-04256-6

    ORIGINAL PAPER

Quantification of earthquake diagnostic effects to assess low
macroseismic intensities

Paola Sbarra1        · Patrizia Tosi1 · Valerio De Rubeis1 · Diego Sorrentino1

Received: 9 April 2020 / Accepted: 21 August 2020
© The Author(s) 2020

Abstract
A large amount of data about earthquake effects, supplied by citizens through a web-based
questionnaire, enabled the analysis of the occurrence of many of the effects on humans and
objects listed in macroseismic scales descriptions. Regarding the other diagnostic effects
(rattling, moving, shifting, falling or overturning depending of the object type of doors,
windows, china, glasses, small objects, pictures, vases, books, as well as frightened peo-
ple and animal behaviour), data from more than 300,000 questionnaires about earthquakes
felt in Italy from June 2007 to August 2017, were analysed by stacking them together as a
function of hypocentral distance and magnitude. The comparison of the resulting percent-
ages with the intensity prediction equation showed that almost all the chosen effects are
good diagnostics for macroseismic intensity evaluation, as their percentages are well dif-
ferentiated. We did not analyse the oscillations of hanging objects and liquids because the
differences in effect attenuations, highlighted by the maps of the occurrence percentage,
suggested to not consider them as diagnostic effect. This result allowed us to quantify the
occurrence of each diagnostic effect for the intensity degrees from II to VI of the European
macroseismic scale for the people who felt the earthquake. The application of the intensity
assessment method to internet macroseismic data, based on the specifications herein pro-
posed, should mitigate the problem of “not felt” undersampling in crowdsourced web data.

Keywords Diagnostic effects · EMS scale · Macroseismic questionnaire · Intensity
estimation · Earthquake

1 Introduction

Macroseismic scales are based on experimental observations that are categorised to obtain
the estimation of intensity levels of ground shaking. Objects and buildings can be consid-
ered as “instruments” in recording seismic effects, and even human response to ground
shaking, when averaged over a large number of samples, can be a good indicator of the
level of ground motion (Kayano 1990; Dengler and Dewey 1998). The descriptions of
macroseismic scales detail an increase in the level of intensity of each diagnostic effect

* Paola Sbarra
  paola.sbarra@ingv.it
1
      Istituto Nazionale di Geofisica e Vulcanologia, Via di Vigna Murata 605, 00143 Rome, Italy

                                                                                              13
                                                                                      Vol.:(0123456789)
Natural Hazards
observed. As stated in the European macroseismic scale (EMS, Grünthal 1998), “The scale
recognises the statistical nature of intensity, that is, that at any place a certain effect is
likely to be observed in a proportion of cases only, and whether that proportion is small
or large is itself something that tells one about the strength of the shaking.” These trends,
based mainly on reports from the field, but even on common sense, have been studied sys-
tematically in large samples of data only a few times (Brazee 1979; Vannucci et al. 2015)
and the occurrence of each diagnostic for each intensity level has been poorly quantified
using qualitative word such as few, many and most. Instead, directly observing the diag-
nostic effects of an earthquake without the conventional interpretation of an intensity scale
should provide a record regardless of the adopted methodology (Musson 1992).
Nowadays, considering that crowdsourcing has gained more attention in several fields
of interest, web-based macroseismic intensity questionnaires are used by many organisa-
tions (Radziminovich et al. 2014; Van Noten et al. 2017). The development of automated
methods for determining intensity (Ringdal et al. 1978; Gasparini et al. 1992; Ferrari et al.
1995; Musson 2006; Mazet-Roux et al. 2010; Sbarra and Tosi 2010; Wald et al. 2012; Tosi
et al. 2015; Vannucci et al. 2015; Goded et al. 2018) and the availability of large amounts
of data have paved the way for the quantification of each diagnostic effect, thus guarantee-
ing a more objective assessment of macroseismic intensity.
The ease in obtaining information about effects has sharpened the focus of the scien-
tific community on the low intensity, which are registered both far away from strong earth-
quakes and near the epicentre of small ones. The distinction among the lowest degrees of
a macroseismic scale (from I to V) is mainly based on the percentage of people feeling the
earthquake and on the occurrence of some specific diagnostic effects. The latter are not
directly recorded, but indirectly reported by people who observed them. However, a prob-
lem connected with the use of online data, especially when they are mostly gathered from
volunteers, is the scarcity of “not felt” reports, thus affecting the calculation of the “felt”
percentage. It is then necessary to quantify the amount of these missed "not felt” responses
(Boatwright and Phillips 2017). Despite the creation of the group of "registered users" in
the INGV site, who are invited by e-mail to respond even if they have not felt the earth-
quake, the number of “not felt” responses received was underestimated by a factor of 10
(Tosi et al. 2015). Yet, this factor actually is highly variable depending on time, earthquake
magnitude, geographical location, etc. For this reason, when assessing low intensities, it
may be useful to consider each diagnostic effect as it has been reported by people who
felt the earthquake and filled the questionnaire, specifying whether or not each effect was
observed. Finally, by combining the different strength levels in only one class, each effect
can be quantified as percentage of occurrence. This change of perspective to evaluate the
macroseismic intensity is not straightforward, because one must consider that macroseis-
mic effects may have different attenuation trends, as each effect is the response to a par-
ticular frequency range of ground shaking (Tosi et al. 2017). In fact, to determine reliable
values of macroseismic intensity it is advisable, for each level of the scale, to consider only
effects having the same trend of attenuation.
2 Disagreements between diagnostics
“Hai Sentito Il Terremoto” (which translates to “Did you feel the earthquake?” www.
haisentitoilterremoto.it, hereafter HSIT, Tosi et al. 2007), managed by the Istituto Nazi-
onale di Geofisica e Vulcanologia, collects responses concerning earthquakes felt in
13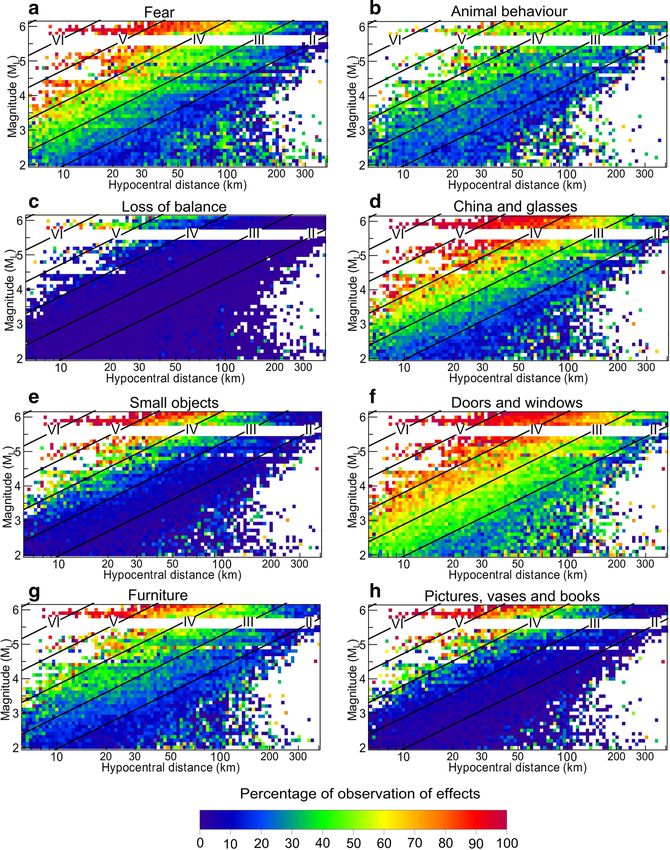
Natural Hazards

Italy since 1997. The HSIT database contains the responses given to an online question-
naire (Sbarra et al. 2019) by both volunteers and approximately 27,000 registered users,
who were invited, via email, immediately after the occurrence of an earthquake to give
feedback. The questions focus on the diagnostic effects needed for the assessment of
macroseismic intensity (Tosi et al. 2015; De Rubeis et al. 2019). Only one answer is
possible for each multiple-choice question listing progressive strength levels, starting
from the absence of the effect itself.
   We mapped the occurrence of each diagnostic effect by calculating their percentage
of observation in each municipality for the following three earthquakes, i.e. Emilia, 20
May 2012 Mw 5.8, Norcia, 30 October 2016 Mw 6.5, and Verona, ML 3.0 18 June
2013. The percentages obtained were the ratio between the number of answers describ-
ing the occurrence of the considered effect, combining the progressive strength levels
in only one class (e.g. the effect on doors and windows combines the following lev-
els “rattling”, “opening or closing” and “slamming”), and the total number of answers
including the absence of the effect itself. The percentages of all earthquake effects avail-
able on the HSIT site, calculated in the municipalities having more than 4 answers for
each effect, are shown in Figs. 1, 2, and 3, respectively. The comparison of the thematic
maps highlights the efficiency of each diagnostic in representing the shaking intensity.
In fact, most of effects of the first two earthquakes (Figs. 1, 2) showed a significant vari-
ation in the percentage of observation within a distance of 200 km from the epicentre.
On the contrary, the maps of free-hanging objects (Figs. 1e, 2e) and liquids oscilla-
tion (Figs. 1i, 2i) reveal that the effect is almost equally present at all shown distances.
These patterns match the results found by Tosi et al. (2017), who showed that, in the
whole HSIT database, the mean percentage of occurrence of each effect, calculated as
a function of hypocentral distance and magnitude, presents a specific attenuation trend
identified by the ratio between magnitude and distance coefficients of the linear regres-
sion function. On the basis of this ratio, the diagnostic effects were separated by Tosi
et al. (2017) into two groups. The first group accounted for most of the diagnostics, i.e.
rattling, moving, shifting, falling or overturning depending of the object type (doors,
windows, china, glasses, small objects, pictures, vases, books), frightened people and
animal behaviour. The second group included oscillation of liquids and hanging objects.
Tosi et al. (2017) suggested that the effects in the first group were the response to a
1 Hz ground motion, while the oscillations in the second group were the response to
lower frequency ground motion. The frequency-dependent differences in attenuation are
the reason why in places that should experience the same macroseismic intensity, i.e.
far from medium–high earthquakes and near small ones, there are high percentages of
oscillations in group 2 (Figs. 1e, i, 2e, i), or low percentages (Fig. 3e, i), depending on
the magnitude. In detail, by comparing macroseismic fields (Fig. 4) and diagnostic maps
(Figs. 1, 2, 3), it appears that for most municipalities having intensity III EMS of Emilia
and Norcia earthquakes (Fig. 4a, b) the percentage of oscillations of both free-hanging
objects and liquids is greater than 75% (Figs. 1e, i, 2e, i), while near the epicentre of the
smaller event (Fig. 4c), where intensity is III EMS, the percentage of oscillations is on
average 23% (Fig. 3e) for free-hanging objects and 35% for liquids (Fig. 3i).
   Thus effects involving oscillations could have different behaviours for high- and low-
magnitude earthquakes. As the scale should be equally valid for all earthquakes in the
next section we analyse the HSIT database (De Rubeis et al. 2019; Sbarra et al. 2019) to
quantify only the other effects showing similar attenuation behaviours, for each macro-
seismic intensity value.

                                                                                  13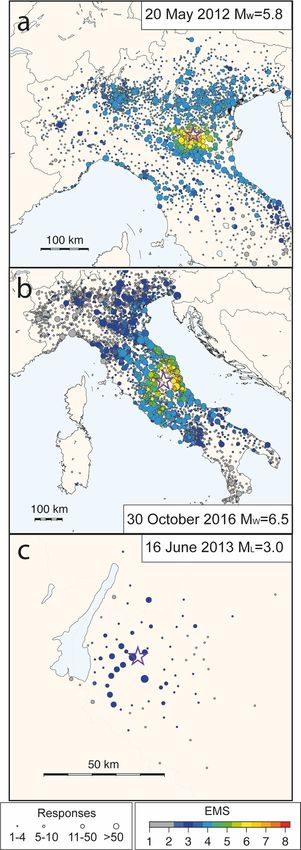
Natural Hazards

Fig. 1  Spatial distribution of observation percentages for each considered diagnostic effect for the Emilia
earthquake, Mw 5.8, which occurred on 20 May 2012

   Even if the data are scarce, we added the analysis of the loss of balance percentages
(Figs. 1c, 2c, 3c) to the above-mentioned effects, because it is one of the diagnostic
effects listed in the EMS characterising the medium–high degrees.

13
Natural Hazards
Fig. 2 Spatial distribution of observation percentages for each considered diagnostic effect for the Norcia
earthquake, Mw 6.5, which occurred on 30 October 2016
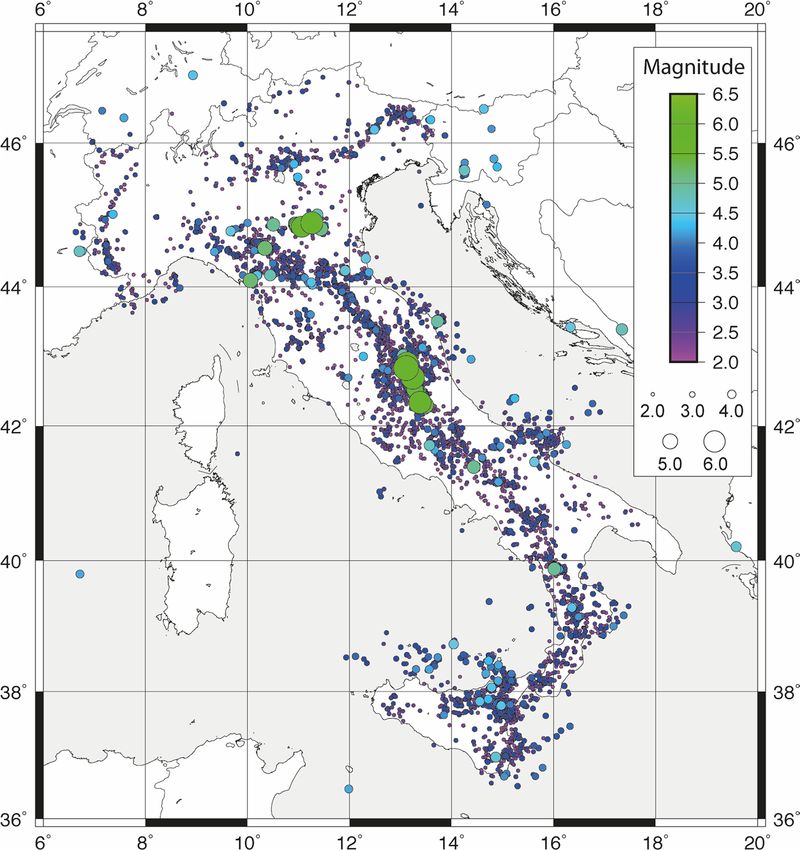
3 Quantification of the effects
We analysed 315,991 indoor “felt” questionnaires concerning 11,253 earthquakes that
occurred from June 2007 to August 2017 in Italy or in the neighbouring countries (Fig. 5).
13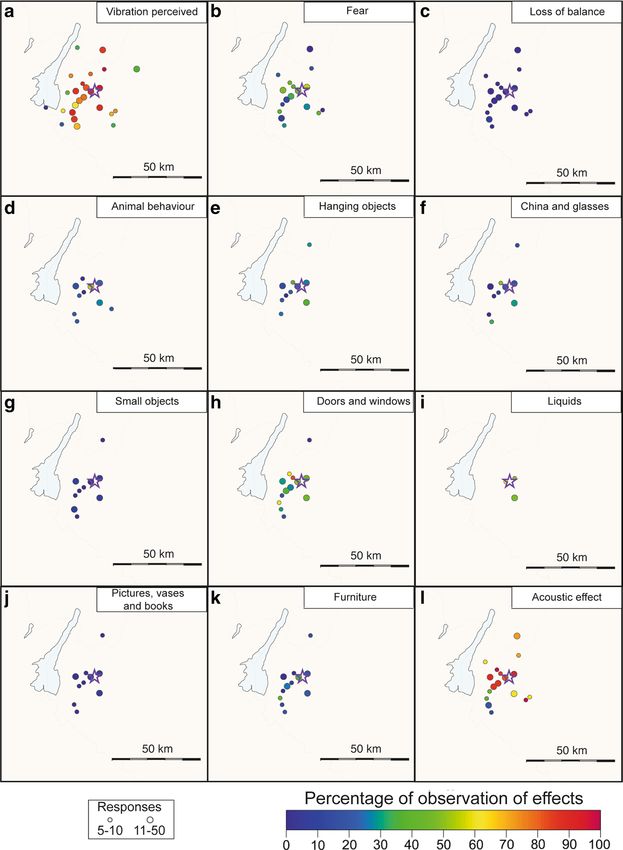
Natural Hazards

Fig. 3  Spatial distribution of observation percentages for each considered diagnostic effect for the Verona
earthquake, ML 3.0, which occurred on 18 June 2013

The data set consists of events with a magnitude (ML) range from 2 to 6.1, and depths
shallower than 35 km, that received more than 3 questionnaires. Some of the aftershocks,
or other events occurring in a short space of time, were excluded because of the risk of
people confusing them with the mainshock events (Tosi et al. 2017).

13
Natural Hazards

Fig. 4  EMS macroseismic
intensity maps assessed with
HSIT online questionnaire data.
The purple stars indicate the
epicentres. a 20 May 2012, Mw
5.8, lat. 11.23° N long. 44.89°
E. b 30 October 2016, Mw 6.5,
lat. 13.11° N long. 42.84° E. c 18
June 2013, ML 3.0, lat. 10.98° N
long. 45.54° E

                                     13
Natural Hazards Fig. 5 Map of 11,253 earthquakes analysed in this study, which occurred from June 2007 to August 2017 For each effect, the answer “unable to say”, a different option from the absence of the effect itself, was selected in about 45% of responses, with an almost homogeneous distribu- tion as a function of distance and magnitude. Our data show that this answer was chosen by only 10% of people for earthquakes having a magnitude greater than 5.8 and hypocentral distances less than 30 km, showing that with high-intensity earthquakes citizens fill the macroseismic questionnaire with greater care, by responding to almost all questions. The more frequently answered questions concerned the effects on people (fear 304,170 answers; 92%) and on doors or windows (233,765 answers; 71%), while questions about the behaviour of animals (105,032 answers; 32%) were answered less frequently (Table 1). To quantify the diagnostics, we calculated the percentage of occurrence of each effect, stacking data of all selected earthquakes, as a function of hypocentral distance and magnitude, following Tosi et al. (2017). Each magnitude-distance window included at least 3 answers and more than 1000 answers at most, with a median of about 100 values. The resulting percentages (Fig. 6), as expected, show similar trends among the 13
Natural Hazards
Table 1 Number of analysed macroseismic questionnaires, regarding 11,253 earthquakes, with magnitude
range from 2 to 6.1 (ML), felt in Italy from June 2007 to August 2017
Diagnostic effect Number of people Number of people Number of people who
who answered who answered answered “unable to say”
“yes” “no”
Fear (people is frightened) 118,165 186,005 27,352
Loss of balance 10,561 280,787 40,174
Animal behaviour (become uneasy) 29,821 75,211 226,490
China and glasses (rattle or clatter 72,168 99,662 159,692
together)
Small objects (shift or fall) 34,327 141,613 155,582
Doors and windows (rattle, open or 126,248 107,517 97,757
shut)
Pictures, vases and books (shift or 22,887 121,832 186,803
fall)
Furniture (shift or overturn) 61,708 144,620 125,194
The diagnostic effect is indicated inside the brackets as reported in the scale descriptions
effects. Such behaviour is in agreement with results by Tosi et al. (2017) although data
set in that work was limited to October 2015 and the number of analysed questionnaires
was 20% lower than the data set here examined.
All the effects shown in Fig. 6 are used in the macroseismic scales as diagnostics,
and thus reasonably their attenuation as a function of magnitude and distance closely
follows macroseismic intensity, which by definition is based on the whole set of effects
involved. To compare the attenuations of each single effect with that of EMS macroseis-
mic intensity (I), the isolines of a simple Intensity Prediction Equation (IPE), were also
drawn in Fig. 6 (black diagonal lines). These isolines were obtained using the method of
Tosi et al. (2015) on the HSIT intensity data,
I = (− 2.55 ± 0.03) log10 D + (1.08 ± 0.01)ML + 2.43 ± 0.04 (1)
where D is the hypocentral distance. Figure 6 shows that the isolines of the IPE, for each
single effect, border magnitude-distance windows having similar percentages of the occur-
rence for the effect itself, and thus, that the attenuation of each effect has the same trend
as the EMS IPE. As an example, from Fig. 6, let us consider the percentages of frightened
people included between III and IV EMS. This interval includes percentages in the 40–60%
range, in agreement with all the distance-magnitudes windows. In other words, there is
a good correspondence between percentage and intensity intervals. This correspondence
allows the estimation of a percentage of people who observed each effect for every EMS
intensity value. The average of percentages corresponding to windows having the same
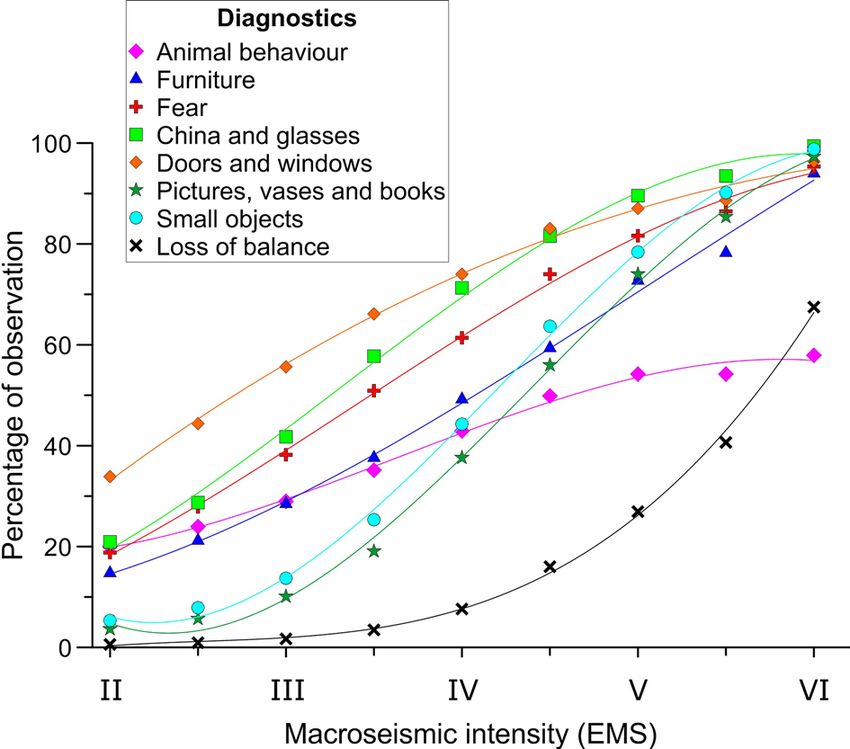
EMS intensity predicted by Eq. 1 is shown in Fig. 7.
To exemplify the results of Fig. 7, we summarised in Table 2 the percentages of the
effects on objects and humans which should be operatively applied to improve the esti-
mation of EMS intensities from II to VI. We also inserted in Table 2 the quantification
of the vibration perceived, already published by Sbarra et al. (2014), in order to include
all the results on transient effects. As specified, it is important to point out that the per-
centages were calculated among those who felt the earthquake.
13Natural Hazards Fig. 6 Distribution in percentages of observation colour-coded as a function of magnitude and hypocentral distance for each diagnostic effect analysed. The black diagonal lines represent intensities in EMS scale calculated using Eq. 1. The percentages were obtained summing up the data pertaining to all earthquakes of a defined magnitude (with a precision Δm = 0.1), within a logarithmically increasing range of hypocentral distance (window length = 0.02 log10D, where D is the hypocentral distance expressed in km) We include in this graph also the diagnostic of the movement of pictures, vases and books although it is not mentioned in the EMS scale. This diagnostic is similar to the movement of small objects; in fact, they show a similar trend (Fig. 7), but it is possible to observe some differences in the percentage of occurrence of each one. Therefore, we 13
Natural Hazards
Fig. 7 Percentage of people who
observed each diagnostic effect
(this study) versus the EMS
intensity. A third-degree poly-
nomial regression line connects
the points in order to highlight
the trend
believe that these two diagnostics must remain separate and we propose adding the move-
ment of pictures, vases and books to the EMS scale.
4 Discussion
The results of the HSIT data analysis show that most effects follow the attenuation trend
of Eq. 1. This indicates that they are good diagnostics for intensity estimation and con-
firms the reliability of citizens’ reports. Here, to focus on a smaller number of variables, we
did not consider the specific location (floor and building height) of the observers (Sbarra
et al. 2012, 2015; Van Noten et al. 2017; Schlupp et al. 2018). However, the floors higher
than the fifth account for only 5% of our database. Besides, the potential effects of other
major variables, such as site geology and focal mechanism, were neglected in this analysis,
assuming that these variables were balanced and averaged due to the heterogeneity of the
data contained in the large HSIT data set, which covers the entire Italian territory and pre-
sents a moderately large magnitude range.
The analysis of effects attenuation highlighted the different behaviour of the oscilla-
tions of hanging objects and liquids with respect to other effects (Figs. 1, 2, 3). In fact,
the percentages of observed oscillation of hanging objects do not follow specific intensity
levels. The same behaviour was observed for the oscillation of liquids, suggesting that the
oscillations in general, probably even of bells, can introduce a noise component in inten-
sity assessment. In particular, considering that the oscillation of chandeliers is a frequently
observed effect, and that this effect is often drawn on thumbnails depicting earthquake
intensity (Sira 2015; Bossu et al. 2017; Goded et al. 2017), there can be an anomalous
extension of III degree at the expense of II in the case of high-magnitude, and the opposite
in the case of low-magnitude events (for these reasons, Le Bureau Central Sismologique
Français followed our suggestions and modified the last version of the miniatures, pre-
sented after the on-line questionnaire, and removed the hanging objects from the pictures,
https://www.franceseisme.fr/formulaire/index.php?IdSei=0). Actually, the swinging of
13Table 2 EMS scale description and our corresponding specifications and quantifications: (a) effects on humans; (b) effects on objects
EMS degree Description (Grünthal 1998) This study
13
II (a) The tremor is felt only at isolated instances (< 1%) of individuals at rest (a) Felt by very few at rest at higher floors (0.4%) and at rest at lower floors
and in a specially receptive position indoors (0.2%)
(b) No effect Among those who felt the earthquake
19% reporting fear and 1% lose their balance
(b) Doors and windows (34%), china and glasses (21%) and furniture (15%)
rattle, animals become uneasy 20%. Small objects (5%), pictures, vases and
books (4%) move
III (a) The earthquake is felt indoors by a few. People at rest feel a swaying or (a) Felt by a few at rest at higher floors (5%) and by very few at rest at lower
light trembling floors (2%)
(b) Hanging objects swing slightly Among those who felt the earthquake
38% reporting fear and 2% lose their balance
(b) Doors and windows (56%), china and glasses (42%) and furniture (28%)
rattle, animals become uneasy (29%). Small objects (14%), pictures, vases
and books (10%) move
IV (a) The earthquake is felt indoors by many and felt outdoors only by very few. (a) Felt by many at rest at higher floors (33%), by many at rest at lower floors
A few people are awakened. The level of vibration is not frightening. The (23%), by few/many at rest outdoor (15%), by a few in motion at higher floors
vibration is moderate. Observers feel a slight trembling or swaying of the (12%), by few in motion at lower floors (6%). Many people are awakened at
building, room or bed, chair, etc. higher floors (33%), and at lower floors (18%)
(b) China, glasses, windows and doors rattle. Hanging objects swing. Light Among those who felt the earthquake
furniture shakes visibly in a few cases. Woodwork creaks in a few cases 61% reporting fear and 7% lose their balance
(b) Doors and windows (74%), china and glasses (71%) and furniture (49%)
rattle, animals become uneasy 43%. Small objects (44%), pictures, vases and
books (37%) move
V (a) The earthquake is felt indoors by most, outdoors by few. A few people are (a) Felt by most at rest at both higher floors (86%) and lower floors (64%), and
frightened and run outdoors. Many sleeping people awake. Observers feel a outdoors (78%). By many in motion at both higher floors (53%) and lower
strong shaking or rocking of the whole building, room or furniture floors (28%). By a few in motion outdoors (7%). Most people are awakened at
(b) Hanging objects swing considerably. China and glasses clatter together. both higher floors (77%) and lower floors (82%)
Small, top-heavy and/or precariously supported objects may be shifted or Among those who felt the earthquake
fall down. Doors and windows swing open or shut. In a few cases, window 81% reporting fear and 27% lose their balance
panes break. Liquids oscillate and may spill from well-filled containers. (b) Doors and windows swing open or shut (87%), china and glasses rattle or
Animals indoors may become uneasy clatter together (90%) and furniture (73%) rattle, animals become uneasy
(54%). Small objects (78%) and pictures, vases and books (74%) may be
Natural Hazards
shifted or fall downTable 2 (continued)
EMS degree Description (Grünthal 1998) This study
VI (a) Felt by most indoors and by many outdoors. A few persons lose their bal- (a) Felt by all at rest or in motion (100%). All people are awakened (100%)
Among those who felt the earthquake
Natural Hazards
ance. Many people are frightened and run outdoors
(b) Small objects of ordinary stability may fall, and furniture may be shifted. 95% reporting fear and 67% lose their balance
In few instances dishes and glassware may break. Farm animals (even (b) Doors and windows swing open or shut or slam (96%), china and glasses
outdoors) may be frightened rattle or clatter together or break (99%) and furniture (94%) rattle, moved or
overturn. Animals become uneasy (58%). Small objects (99%) and pictures,
vases and books (97%) may be shifted or fall down
13Natural Hazards
hanging objects seems to be a controversial diagnostic. Its claimed intensity level varies
significantly in different macroseismic scales, even though intensities lower than VI in
the Mercalli–Cancani–Sieberg scale (MCS, Sieberg 1930), the EMS, Mercalli Modified
Intensity (MMI, Wood and Neumann 1931) and the Medvedev–Sponheuer–Karnik scale
(MSK, Medvedev et al. 1965) should be very similar to each other (Molin 1995; Musson
et al. 2010). For example, the EMS scale defines three levels of swinging (slightly at III
EMS, moderately at IV EMS and considerably at V EMS, see Table 2). The MMI scale
reports in II “sometimes may swing”, in III “may swing slightly”, in IV “swung in numer-
ous instances”, in V “swing generally or considerably”. The newer version of MMI (Mus-
son and Cecić 2012) reports the same descriptions, omitting hanging objects in degree V.
MCS and MSK scales report only one level (swinging of chandeliers at degree V). Finally,
the scale adopted by the Japan Meteorological Agency (JMA 2019; Musson and Cecić
2012), considering that 2 and 4 JMA respectively correspond to IV and V EMS (Mus-
son et al. 2010; Musson and Cecić 2012), quotes “swing slightly” in intensity 2, “swing
considerably” in 4 and “swing violently” in 5-Lower. In summary, this diagnostic of low-
intensity degrees is discordant in different scales. Moreover, for medium–high magnitudes,
it is observed up to very long distances; instead, it does not characterise low-magnitude
events. As an example, the slight swinging of hanging objects is almost never observed
in Britain (Musson 1991) where seismicity is characterised by low magnitudes (Grünthal
1989). This problem was already mentioned in the specific notes of the EMS scale guide-
lines (Grünthal 1998). For all these reasons we suggest to critically revise the diagnostic of
hanging object oscillation and/or to rephrase the correspondence question inside the mac-
roseismic questionnaire.
Similar considerations apply to the oscillation of liquids that are currently contem-
plated, in many macroseismic scales. We here list some scale descriptions. MMI (Wood
and Neumann 1931) intensity I “liquids may sway very slowly”, II “liquids may swing”,
IV “disturbed liquids in open vessels slightly”, V “spilled liquids”, VI “liquid set in strong
motion”; EMS intensity V “liquids oscillate and may spill”, VII “water splashes from con-
tainers, tanks and pools”; MCS scale intensity IV “oscillating slightly”, V “water may spill
from filled container”, VI “moving strongly”; MSK intensity V “liquids oscillate and may
spill”. Therefore, in all these scales, the presence of this diagnostic could generate a noise
component in the intensity assessment. Thus, we discourage the use of this diagnostic as
suggested by Stover and Coffman (1993).
Regarding the diagnostics with the attenuation behaviour similar to that of intensity
(Fig. 7), the movement of doors and windows is the most perceived effect at the lowest
EMS intensities (Table 2). Regarding IV EMS, in the scale of perception the following
effects are observed (the mean percentage in brackets): movement of doors and windows
(74%), movement of china and glassware (71%), fear (61%), movement of furniture (49%),
animal behaviour (43%), movement of small objects (44%), movement of pictures, vases
and books (38%), and loss of balance (8%). All the percentages increase quite steeply
towards VI EMS, except for animal behaviour that never exceeded the value of 60%. Thus,
this diagnostic, considered in the description of V EMS, turned out to be a poor quality
marker, as its percentages for different intensities change slightly. It is worth noting that
this effect could be more difficult to evaluate, as it relies on the ability of the compiler to
interpret the reaction of animals. Recently, Woith et al. (2018) highlighted the difficulties
in collecting and analysing this kind of data, in a review of 44 publications and 729 reports
on abnormal animal behaviour in connection with 160 earthquakes.
In Fig. 7, some diagnostic effects show significant percentages of occurrence, among
those who felt the earthquake, even in II EMS (Table 2). That is, 34% for door and window
13Natural Hazards
rattling, 21% for rattling of china and glasses, 20% for animal behaviour is 20%, 19% for
people reporting fear, and 15% for the movement of furniture. Thus, it is possible to assess
II and III EMS, in web-based surveys, even on the basis of these diagnostics, which are
usually neglected in the lowest intensities. The percentage of occurrence of each effect
could then be used, especially for Internet surveys, when sufficient data are available, to
recognise low and medium intensities (from II to VI, Fig. 7). Moreover, the use of percent-
ages based only on questionnaires filled by citizens who felt the earthquake, reduces the
problem of the underestimation of not felt reports raised by Boatwright and Phillips (2017).
Percentage values shown in Fig. 6 and Table 2 are based on the expected intensities
calculated with Eq. 1, but we want to emphasise that even using the experimental EMS
intensity values assessed for each municipality by the HSIT system (Tosi et al. 2015) we
obtained similar values, thus confirming the robustness of results. We preferred the first
approach, to avoid potentially wrong local intensities resulting from the incoherence of
diagnostics in low degrees.
5 Conclusions
This paper is focused on quantification of the occurrence of effects on humans and
observed effects objects to reduce the subjective component in macroseismic intensity
assessment. In fact, many authors (Davison 1921; Ferrari and Guidoboni 2000; Musson
et al. 2010; Musson and Cecić 2012; Vannucci et al. 2015) admit that one of the difficulties
in assessing macroseismic intensity is the rough quantification of each diagnostic effect.
On the basis of the analysis of a large crowdsourced macroseismic data pool, it was
verified that most of the diagnostic effects mentioned in the macroseismic scales are good
markers for ground shaking intensity differentiation (Figs. 6, 7). Fear, a parameter that
could be easily biased by subjective emotional states, has also proven to be a good marker
of macroseismic intensity, whereas animal behaviour had a low resolution for distinguish-
ing among medium intensities (from IV to VI EMS).
On the other hand, the oscillations of hanging objects and liquids were more related to
magnitude variations than other effects. Consequently, following the results of this arti-
cle, we suggest omitting or at least critically revising the oscillation of hanging objects
and liquids within diagnostics, to assure a magnitude-independent scale. We hope that our
results can be a starting point for a discussion and comparative research in other countries,
to propose, in case, a change of the EMS scale. As mentioned by Grünthal (1998) in the
guidelines and background material of the latest version of the EMS scale, “future applica-
tions or future needs might be the basis for further improvements” of a macroseismic scale.
The results presented here (summarised in Table 2) suggest that the estimation of II and III
intensity degrees can be improved, by considering the percentage of occurrence of some
diagnostics (movement of doors, windows, china, glasses, and fear) reported by people
who felt the earthquake. The quantification, in terms of percentage of observation of each
diagnostic effect on objects and humans, could allow a more objective intensity assessment
for EMS intensities from II to VI.
Acknowledgements This work would not have been possible without the efforts of so many people in Italy
who have filled in the HSIT macroseismic questionnaires, providing us with valuable data. We are grateful
to Pierfrancesco Burrato and Roberto Vallone for helpful advice. We acknowledge the financial support of
the INGV-DPC 2019–2021 agreement (Allegato A, WP7).
13Natural Hazards
Funding Open access funding provided by Istituto Nazionale di Geofisica e Vulcanologia within the CRUI-
CARE Agreement.
Open Access This article is licensed under a Creative Commons Attribution 4.0 International License,
which permits use, sharing, adaptation, distribution and reproduction in any medium or format, as long
as you give appropriate credit to the original author(s) and the source, provide a link to the Creative Com-
mons licence, and indicate if changes were made. The images or other third party material in this article
are included in the article’s Creative Commons licence, unless indicated otherwise in a credit line to the
material. If material is not included in the article’s Creative Commons licence and your intended use is not
permitted by statutory regulation or exceeds the permitted use, you will need to obtain permission directly
from the copyright holder. To view a copy of this licence, visit http://creativecommons.org/licenses/by/4.0/.
References
Boatwright J, Phillips E (2017) Exploiting the demographics of “Did you feel it?” Responses to esti-
mate the felt area of moderate earthquakes in California. Seismol Res Lett 88:335–341. https://doi.
org/10.1785/0220160041
Bossu R, Landès M, Roussel F et al (2017) Thumbnail-based questionnaires for the rapid and efficient
collection of macroseismic data from global earthquakes. Seismol Res Lett 88:72–81. https://doi.
org/10.1785/0220160120
Brazee RJ (1979) Reevaluation of modified Mercalli intensity scale for earthquakes using distance as
determinant. Bull Seismol Soc Am 69:911–924
Davison C (1921) On scales of seismic intensity and on the construction and use of isoseismal lines.
Bull Seismol Soc Am 11:95–130
Dengler LA, Dewey JW (1998) An intensity survey of households affected by the Northridge, California,
Earthquake of 17 January 1994. Bull Seismol Soc Am 88:441–462
De Rubeis V, Sbarra P, Tosi P, Sorrentino D (2019) Hai Sentito Il Terremoto (HSIT)—macroseismic
intensity database 2007–2018, version 1. https://doi.org/10.13127/HSIT/I.1
Ferrari G, Gasperini P, Guidoboni E (1995) Macroseismic intensity evaluation with the “Fuzzy sets
logic”. Ann Geofis 38:811–826
Ferrari G, Guidoboni E (2000) Seismic scenarios and assessment of intensity: some criteria for the use
of the MCS scale. Ann Geofis 43:707–720
Gasparini C, De Rubeis V, Tertulliani A (1992) A method for the analysis of macroseismic question-
naires. Nat Hazards 5:169–177. https://doi.org/10.1007/bf00127004
Goded T, Horspool N, Gerstenberger M et al (2017) A comparison between GeoNet’s “Felt RAPID” and
“Felt detailed” online questionnaires. In: Proceedings of the New Zealand society of earthquake
engineering technical conference, Wellington (New Zealand), April 2017
Goded T, Horspool N, Canessa S et al (2018) New macroseismic intensity assessment method for New
Zealand web questionnaires. Seismol Res Lett 89:640–652. https://doi.org/10.1785/0220170163
Grünthal G (1989) Thoughts and proposals for the updating of the MSK intensity scale. Central Institute
for the Physics of the Earth, Potsdam, pp 1–63
Grünthal G (1998) European macroseismic scale 1998 (EMS-98). Cahiers du Centre Européen de Géo-
dynamique et de Séismologie Luxembourg 15:1–99
Japan Meteorological Agency (JMA) (2019) Summary of tables explaining the JMA seismic intensity
scale. https://www.jma.go.jp/jma/kishou/know/shindo/kaisetsu.html. Last Accessed Sept 2019
Kayano I (1990) Distribution of various effects and damages caused by earthquakes and of seismic
intensities on the basis of questionnaire surveys: a newly developed group survey method. Bull
Earthq Res Inst Univ Tokyo 65:463–519
Mazet-Roux G, Bossu R, Carreño E et al (2010) EMSC real time earthquake information services. In:
European-Mediterranean Seismological Centre (EMSC) report, 31 p. https://www.emsc-csem.org/
Files/news/EMSC/EMSC_RTEI_services.pdf. Last Accessed Sept 2019
Medvedev SV, Sponheuer W, Karnik V (1965) Seismic intensity scale version MSK 1964. Academy of
Sciences of the USSR, Soviet Geophysical Committee, Moscow
Molin D (1995) Considerations on the assessment of macroseismic intensity. Ann Geofis 38:805–810
Musson RMW (1991) The use of the MSK intensity scale in the study of British earthquakes. In: Kozák
J (ed) Proc 3rd Int Sym on Hist Eqs in Europe, Liblice, April 1990. Geoph. Inst. Czech. Acad. Sci.,
Prague
13Natural Hazards
Musson RMW (1992) Single diagnostic analysis of earthquake effects. In: Cecić I (ed) Proceedings 2nd
AB workshop on macroseismic methods, Poljče, Yugoslavia, 15–18 Oct 1990, Seismological Sur-
vey of Slovenia, Ljubljana (Also as BGS Global Seismology Report No WL/91/14)
Musson RMW (2006) Automatic assessment of EMS-98 intensities. British Geological Survey technical
report, IR/06/048.
Musson RMW, Cecić I (2012) Intensity and intensity scales. New manual of seismological observa-
tory practice (NMSOP-2). IASPEI, GFZ German Research Centre for Geosciences, Potsdam, 2012.
https://doi.org/10.2312/GFZ.NMSOP-2
Musson RMW, Grünthal G, Stucchi M (2010) The comparison of macroseismic intensity scales. J Seis-
mol 14:413–428. https://doi.org/10.1007/s10950-009-9172-0
Radziminovich YB, Khritova MA, Gileva NA (2014) Modern methods for acquisition of macroseismic
data and their possible uses for eastern Siberia. J Volcanol Seismol 8:375–389
Ringdal F, Husebye ES, Sandvin OA, Christoffersson A (1978) Statistical test theory in the analysis of
macroseismic questionnaires. Tectonophysics 49:161–170
Sbarra P, Tosi P, De Rubeis V (2010) Web-based macroseismic survey in Italy: method validation and
results. Nat Hazards 54:563–581. https://doi.org/10.1007/s11069-009-9488-7
Sbarra P, Tosi P, De Rubeis V, Rovelli A (2012) Influence of observation floor and building height on mac-
roseismic intensity. Seismol Res Lett 83:261–266. https://doi.org/10.1785/gssrl.83.2.261
Sbarra P, Tosi P, De Rubeis V (2014) How observer conditions impact earthquake perception. Seismol Res
Lett 85:306–313. https://doi.org/10.1785/0220130080
Sbarra P, Fodarella A, Tosi P, De Rubeis V, Rovelli A (2015) Difference in shaking intensity between
short and tall buildings: known and new findings. Bull Seismol Soc Am 105:1803–1809. https://doi.
org/10.1785/0120140341
Sbarra P, Tosi P, De Rubeis V, Sorrentino D (2019) Hai Sentito Il Terremoto (HSIT)—macroseismic ques-
tionnaire database 2007–2018, version 1. https://doi.org/10.13127/HSIT/Q.1
Schlupp A, Sira C, Dumetz C, Masson R (2018) Quantification of the increase in shaking with the floor
level based on macroseismic data collected by the BCSF-RENASS in France. In: 36th general assem-
bly of the European seismological commission, 2–7 Sept 2018, Valletta-Malta
Sieberg A (1930) Scala MCS (Mercalli–Cancani–Sieberg). Geologie der Erdbeben Handbuch der Geo-
physik 2:552–555
Sira C (2015) Macroseismic Intervention Group: the necessary field observation. In: Perspectives on Euro-
pean earthquake engineering and seismology. Springer, Berlin, pp 395–408
Stover CW, Coffman JL (1993) Seismicity of the United States, 1568–1989 (revised). US Government
Printing Office
Tosi P, De Rubeis V, Sbarra P, Sorrentino D (2007) Hai Sentito Il Terremoto (HSIT) https://doi.
org/10.13127/HSIT
Tosi P, Sbarra P, De Rubeis V, Ferrari C (2015) Macroseismic intensity assessment method for web ques-
tionnaires. Seismol Res Lett 86:985–990. https://doi.org/10.1785/0220140229
Tosi P, De Rubeis V, Sbarra P (2017) Frequency ranges and attenuation of macroseismic effects. Geophys J
Int 210:1765–1771. https://doi.org/10.1093/gji/ggx201
Vannucci G, Tripone D, Gasperini P, Ferrari G, Lolli B (2015) Automated assessment of macroseismic
intensity from written sources using the fuzzy sets. Bull Earthq Eng 13:2769–2803. https://doi.
org/10.1007/s10518-015-9759-5
Van Noten K, Lecocq T, Sira C, Hinzen KG, Camelbeeck T (2017) Path and site effects deduced from
merged transfrontier internet macroseismic data of two recent M4 earthquakes in northwest Europe
using a grid cell approach. Solid Earth 8:453–477. https://doi.org/10.5194/se-8-453-2017
Wald DJ, Quitoriano V, Worden CB, Hopper M, Dewey JW (2012) USGS “Did you feel it?” Internet-based
macroseismic intensity maps. Ann Geophys 54:688–707. https://doi.org/10.4401/ag-5354
Woith H, Petersen GM, Hainzl S, Dahm T (2018) Can animals predict earthquakes? Bull Seismol Soc Am
108:1031–1045. https://doi.org/10.1785/0120170313
Wood H, Neumann F (1931) Modified Mercalli intensity scale of 1931. Bull Seismol Soc Am 21:277–283
Publisher’s Note Springer Nature remains neutral with regard to jurisdictional claims in published maps and
institutional affiliations.
13You can also read