ADEP WORKING PAPER SERIES - Using Daily Payment Processor Data to Determine Existence and Length of Retail Shopping Event Effects1
←
→
Page content transcription
If your browser does not render page correctly, please read the page content below
ADEP WORKING PAPER SERIES

 Using Daily Payment Processor Data
 to Determine Existence and Length
 of Retail Shopping Event Effects 1

 Nicole Czaplicki
 U.S. Census Bureau

 Rebecca Hutchinson
 U.S. Census Bureau

 Working Paper ADEP-WP-012020-03

 January 2020

 Associate Directorate for Economic Programs
 U.S. Census Bureau
 Washington DC 20233

1
 Disclaimer: Any views expressed are those of the author(s) and not necessarily
those of the U.S. Census Bureau.The Census Bureau has reviewed this data
product for unauthorized disclosure of confidential information and has approved
the disclosure avoidance practices applied. (Approval ID: CBDRB-FY19-428)
Using Daily Payment Processor Data to Determine Existence and Length of
Retail Shopping Event Effects

Nicole Czaplicki, U.S. Census Bureau, nicole.czaplicki@census.gov
Rebecca Hutchinson, U.S. Census Bureau, rebecca.j.hutchinson@census.gov
Working Paper ADEP-WP-012020-03
January 2020

Abstract
The Super Bowl is viewed as a major retail shopping event that can lead shoppers to
increase their spending. The Super Bowl is played annually and has consistently been held
on the first Sunday in February since 2004. This means that the Super Bowl’s impact—if
one exists—can differentially affect January and February retail sales depending on its date
in a particular year, meeting the definition of a moving holiday for seasonal adjustment
purposes. Identifying if these effects actually exist and the length of their impact is
somewhat hard to do with monthly retail survey data. This paper makes use of daily
aggregated payment processor data and modeling to test for Super Bowl effects in various
types of retail business (e.g., grocery, electronics, clothing, etc.) and attempts to identify
the length of the effects for each type of business (e.g. how many days before and after the
holiday itself).

Key Words: retail, alternative data source, seasonal adjustment, business, economy

 2
1. Introduction
Seasonal adjustment methodology for monthly retail trade estimates published by the
United States Census Bureau includes adjustments for moving holiday effects. As the name
suggests, a moving holiday is an event for which the date changes from year to year.
Moving holidays impact a monthly time series when 1) the level of activity measured by
the series changes in a predictable way as a result of the holiday, 2) the change in activity
associated with the holiday spans two or more months, and 3) the proportion of the change
in activity assigned to each month changes from year to year. A common moving holiday
in United States economic time series is Easter Sunday, which varies in date from March
22 to April 25.2 However, there are other holidays in the United States without a fixed
date—such as Memorial Day (the last Monday in May)—that are not considered for
adjustment in monthly time series because the holiday consistently falls late enough in the
month that any associated change in retail activity will be completely contained within that
month and will subsequently be part of the seasonal pattern for that month. For the purposes
of seasonal adjustment, specifying a moving holiday effect removes the predictable
variation in the level of the series associated with the holiday, which would otherwise
obstruct the estimation of the seasonal pattern.

Easter, Labor Day, Thanksgiving, and Christmas are long-standing holidays that are
associated with changes in consumers’ retail spending behaviors. There are other events
not formally recognized as holidays but nonetheless are widely thought to inspire changes
to retail spending patterns, one prime example being Super Bowl Sunday. The Super Bowl
is the annual championship game for the National Football League, the professional
American football league in the United States. Currently, the Super Bowl is played each
year on the first Sunday of February. According to a survey conducted by the National
Retail Federation (NRF) and Prosper Insights & Analytics, American adults planned to
spend an average of $81.30 related to Super Bowl LIII in 2019. Most consumers planned
to spend money on food and beverages, but others planned to purchase team apparel,
decorations, new televisions, and furniture (NRF 2019).

Anecdotal evidence, like that from the NRF, supports the exploration of a Super Bowl
Sunday effect but additional information is needed to test for the existence of such an effect
and the length of the effect. Identifying when there is a change in consumer spending
behavior ahead of Super Bowl Sunday is critical to this analysis. Does the change happen
the weekend before Super Bowl Sunday? The day before? The day of? Daily or weekly
retail consumer spending data likely provide greater insight into these behavior changes
than can be observed in monthly data. Currently, the highest frequency data collection the
Census Bureau conducts for retail sales data is monthly. However, third-party data
providers such as point-of-sale data aggregators and payment processors often have daily
or weekly data available.

This paper summarizes work done to determine the existence and potential lengths of Super
Bowl Sunday effects on retail sales using daily payment processor data from Fiserv, Inc.
The results of this work are considered when determining if Super Bowl Sunday effects
should be applied to retail estimates published in the Census Bureau’s Monthly Retail
Trade report.3 Section 2 of this paper explores how alternative data sources—like payment

2
 Moving holiday adjustments for Labor Day and for the day after Thanksgiving are also made to
selected retail series.
3
 The complete Monthly Retail Trade Survey report can be found at:
https://www.census.gov/retail/index.html

 3
processor data—are being used within the Economic Directorate of the United States
Census Bureau. Section 3 provides background information on Fiserv, the alternative data
source used in this research. Section 4 summarizes previous holiday effect work done using
daily data. Section 5 presents the motivation behind the research and presents the
methodology used to identify Super Bowl Sunday effects in the daily data. Section 6
presents the results of this work. Section 7 reviews the conclusions and proposes the next
steps for this work.

 2. Use of Alternative Data Sources
The Economic Directorate of the Census Bureau is responsible for statistical programs that
measure the economic activity of United States businesses and government organizations.
The Economic Directorate’s mission is to collect quality economic data and provide
statistics that are critical to understanding current conditions in the economy. These data
are important to the preparation of key measures of economic activity by other government
agencies, including Gross Domestic Product (GDP) estimates, benchmark input-output
accounts, producer price indexes, and measures of industrial production and manufacturing
capacity utilization.

Official economic statistics produced by the Economic Directorate have long served as
high-quality benchmarks for data users. However, demands for more timely and more
granular data, a decline in respondent cooperation and increasing costs of traditional survey
data collection are making it challenging for the Census Bureau to meet its data users’
needs. To meet these needs, a growing emphasis has been placed on exploring
nontraditional means of collecting and obtaining data (Jarmin 2019).

The Census Bureau measures the retail economy every five years in the Economic Census
and on a more frequent basis in monthly and annual surveys. In years ending in ‘2’ and ‘7,’
the Economic Census—a mandatory data collection—asks for detailed sales and product-
level information as well as employment, payroll, and business characteristics for each
physical store location that a retailer operates. 4 Data collected by the Economic Census are
used to update the Census Bureau’s Business Register, from which the sampling frames
for many Economic Directorate surveys—including the annual and monthly retail trade
surveys—are created.

Each year, the Annual Retail Trade Survey (ARTS) collects data at the company or retailer
level; no individual store location data are collected.5 The ARTS collects annual sales, e-
commerce sales, end-of-year inventories, and expenses data as well as some retailer
characteristics. The annual data are released approximately 15 months after the data year
ends.

The Monthly Retail Trade Survey (MRTS) is a voluntary survey done at the retailer or
company level and collects total sales as well as end-of-month inventories and e-commerce
sales for all retail industries. Estimates from this survey are released approximately six
weeks after month’s end. The MRTS is a subsample of the ARTS and a reselection of the

4
 For more information on how data are collected for the Economic Census, visit
https://www.census.gov/programs-surveys/economic-census/technical-documentation.html.
5
 For more information on how data are collected for the annual and monthly retail surveys, visit
https://www.census.gov/retail/how_surveys_are_collected.html

 4
MRTS sample occurs approximately every five years to ensure the sample remains
representative and to redistribute the burden for small- and mid-sized businesses. 6

The timeliest measurement of the retail economy and earliest indication of nominal
consumer spending produced by the government is the Advance Monthly Retail Trade
Survey (MARTS). This survey measures only sales/receipts and estimates are published
approximately two weeks after month’s end. The MARTS is a subsample of the MRTS
and this sample is selected every 2-3 years, again to ensure a representative sample and to
redistribute burden. All Economic Census, ARTS, MRTS, and MARTS estimates are
categorized by retail kinds-of-business categories defined by the North American Industry
Classification System (NAICS). 7

The Census Bureau has initiated a number of exploratory projects using alternative data
sources. These alternative data sources include high-frequency and near real-time data such
as point-of-sale data obtained from a retailer or a third party, building permit data obtained
from a city government application programming interface (API), or new construction info
obtained via satellite imagery. The Census Bureau leverages these alternative data sources
in conjunction with existing survey and administrative data to provide more timely or more
geographically granular data products and to improve efficiency and quality throughout the
survey life cycle. Use of daily data from an alternative data source to inform current
seasonal adjustment methodologies is an example of the latter.

Incorporating these types of alternative data sources into official government statistics has
shown promise but also raises concerns related to methodological transparency,
consistency of the data, information technology security, public-private partnerships,
confidentiality, and the general quality of the data. Statisticians who set policy and quality
standards for official government statistics are now faced with various issues surrounding
third-party data. The United States Office of Management and Budget (OMB) and
associations such as the American Association for Public Opinion Research (AAPOR) and
the American Statistical Association (ASA) have begun looking more closely at how to
evaluate the quality of third-party data and statistics derived from them (AAPOR 2015).

 3. Description of Fiserv
Fiserv is a payment processing company that serves as an intermediary between a customer
swiping a credit, debit, or gift card and the card’s financial institution. Fiserv captures
approximately 45% of all noncash transactions in the United States and processes 2,500
transactions per second worldwide. Through official government acquisition processes, the
Census Bureau awarded a contract to Palantir Technologies, Inc., a software development
company, that has taken Fiserv data stored on different acquisition platforms and integrated
them into a single platform. This contract provided access to indexed daily, weekly, and
monthly aggregates across many sectors of the economy—including the retail and service
sectors—for each of the 50 states and the District of Columbia as well as for the entire
United States. The daily data used for this research spanned from 2010 through 2017.

6
 More details about the MRTS sample design can be found at:
https://www.census.gov/retail/mrts/how_surveys_are_collected.html.
7
 The Economic Census, ARTS, MRTS, and MARTS are subject to various sources of error,
including imputation, estimation, or measurement, ARTS, MRTS, and MARTS are subject to
sampling error.

 5
While the Fiserv data provide a unique view into consumer spending habits, the data also
have limitations that induce caution. One obvious limitation is that the Fiserv data only
cover credit, debit, and gift card transactions; transactions paid in cash are not included.
However, coverage of the retail sector by Fiserv data is the primary concern. Fiserv must
protect the privacy and confidentiality of the companies whose data it processes so there is
no way to know which companies are or are not included in the aggregated data.
Additionally, companies working with Fiserv can opt out from sharing their data in the
aggregated estimates that data users like the Census Bureau purchase. The primary goal of
the Fiserv data was to produce more geographically granular retail estimates. Dumbacher,
Morris, and Hogue (2019) used small area estimation methods to produce regional and
state estimates. The uncertainty and lack of transparency regarding coverage prevents the
Census Bureau from producing a data product based solely on the Fiserv aggregates as the
Census Bureau must be fully transparent about its methodologies when producing official
data products. 8

Additionally, e-commerce measurement within the Fiserv data has some limitations. While
all payment processor transactions have a flag for whether or not the cardholder was present
for the transaction, it is unclear whether e-commerce transactions were appropriately and
consistently categorized as either an e-commerce sale or a traditional brick and mortar sale.
This means that e-commerce transactions that the Census Bureau would tabulate in its
Nonstore Retailers breakout (NAICS 454) may instead be classified in the retailer’s
primary kind-of-business breakout (e.g. Sporting Goods Store (NAICS 45111) or
Department Stores (NAICS 4521)). This limitation in the data prevents its use for better
understanding of another e-commerce focused retail shopping event: Cyber Monday, the
Monday following the Thanksgiving holiday in the United States.

Other federal government agencies have had success using the Fiserv data as a reference
for decision making rather than using it to create new data products. The Federal Reserve
Board has used the data to better understand consumer spending surrounding national
disasters including Hurricane Matthew in 2016 (Aladangady, et al. 2016). The Bureau of
Economic Analysis is using the Fiserv aggregates as inputs to machine learning algorithms
for predicting the advance estimates of receipts for service sector industries (Chen, et al.
2018).

 4. Previous Holiday Effect Research Done with Daily Data
As part of a pilot project conducted in 2016 with Palantir Technologies, Inc., Fiserv, and
the Bureau of Economic Analysis, the Census Bureau conducted two efforts focused on
holiday effects using daily data. During this pilot, the Census Bureau had access to
national-level daily sales aggregates from October 1, 2012 through April 12, 2016. These
aggregates were available for a select group of retail kind-of-business categories including
Appliance, Television, and Other Electronics Stores (NAICS 44311), Home Centers
(NAICS 44411), Supermarkets and Other Grocery Stores (NAICS 44511) 9 , Family
Clothing Stores (NAICS 44814), Shoe Stores (NAICS 4482), Sporting Goods Stores
(NAICS 45111), Department Stores (NAICS 45211), and Warehouse Clubs and
Superstores (NAICS 45291).

8
 On July 29, 2019, Fiserv Inc. completed an acquisition of FirstData Merchant Services, Inc.
Publications by Census Bureau researchers and other government agencies prior to that date may
reference FirstData as the data source.
9
 NAICS 44511 excludes convenience stores.

 6
The first seasonal adjustment research project conducted during the pilot involved the
Fiserv daily data themselves. Daily data seasonal adjustment models were built and run on
the daily data (McElroy, Monsell, and Hutchinson 2018). This paper extracted annual and
weekly patterns as well as moving holiday effects from the daily data using an unobserved
components framework. Significant holiday impacts for Super Bowl Sunday, Easter, Labor
Day, Black Friday, and Cyber Monday were identified. Relevant to this work in this paper,
a significant and negative Super Bowl Sunday effect was identified in the Fiserv Sporting
Goods Stores (NAICS 45111) series. The Super Bowl Sunday effect identified here was
just for the day of the Super Bowl itself.

The other research project focused on Easter Sunday. While the Easter[8] holiday regressor
is used in X-13ARIMA-SEATS modeling for some retail series, this effect captures the
change in retail spending in the eight days leading up to Easter and does not include Easter
Sunday itself. But Easter Sunday is an example of a moving holiday where the day of the
holiday itself impacts sales both through the behavior of consumers who reduce purchases
and stores that have reduced hours or have closed for the holiday (Hutchinson and Scheleur
2017). Industry-level plots of all the Sundays for the daily data revealed noticeably
depressed sales in several industries including Building Materials and Supplies Dealers
(NAICS 4441). As seen in Figure 1 below, sales levels on Easter Sunday (darker/red bars)
are markedly lower than any other Sunday in the time series.

An Easter Sunday regressor was then tested for inclusion in the seasonal models for MRTS
series where the daily data showed evidence of an Easter Sunday effect. The significance
and sign of those effects were noted and the small-sample-size corrected version of the
Akaike Information Criterion (AICC) was compared between the model that included the
Easter Sunday regressor and the model that did not include it. As a result of this work, the
Easter Sunday effect was implemented in MRTS production seasonal models for the
Building Materials and Supplies Dealers series as well as the Automobile and Other Motor
Vehicle Dealers series (NAICS 4411 and NAICS 4412). Additionally, the Easter Sunday
regressor was introduced in the February 2017 release of X-13ARIMA-SEATS, the
seasonal adjustment software used and developed by the Census Bureau. 10 Each year, all
retail series are tested for significant Easter Sunday effects and new series that have
significant Easter Sunday effects have been identified.

This Easter Sunday effect work provides the framework used for the Super Bowl Sunday
research: examining a third-party data source for characteristics, patterns, and trends that
cannot be observed in the existing monthly Census Bureau data and then applying those
findings to Census Bureau data.

10
 For more information on the X-13ARIMA-SEATS seasonal adjustment program, please visit
the X-13ARIMA-SEATS website at https://www.census.gov/srd/www/x13as/.

 7
0

Figure 1: Sunday Consumer Activity in Fiserv's Building Materials and Supplies Dealers
(NAICS 4441) Jan 2014-June 2016
Source: Fiserv daily consumer spending data

 5. Super Bowl Sunday
Since 1967, the two teams that emerge victorious from the National Football League’s
playoffs meet in the Super Bowl. The Super Bowl was initially played in early January but
over time, the date of the game was moved to later in the month. In 2002, the Super Bowl
was played for the first time in February due to regular-season game cancellations after the
terrorist attacks on September 11, 2001. In 2003, the game returned to January (Robinson
2017). However in 2004, the Super Bowl was moved to the first Sunday in February and
been played on this day ever since.

The Super Bowl is now a cultural phenomenon widely known for inspiring people across
the country to host game-watching parties. There is growing anecdotal evidence that
consumers are not only increasing grocery expenditures in anticipation of the Super Bowl,
but are also buying more expensive items, including new televisions, for the big game.
Some of the expenditures likely happen before the day of the Super Bowl. For such a major
event, would people buy new televisions on the day of the Super Bowl and risk a
malfunction that would prevent them from watching the game?

In its move to the first Sunday in February, Super Bowl Sunday became a moving holiday.
Depending on how early or late in the month the first February Sunday falls, some pre-
Super Bowl consumer spending may happen in January and the proportion of Super Bowl
spending that will occur in January and February, respectively, will change from year to
year. Before the availability of daily data, the selection of holiday effect length was based
on subject matter knowledge and the convenience of the holiday effect regressors already
included in X-13ARIMA-SEATS. The effect modeled for Easter in retail series, which like
the Super Bowl always falls on a Sunday, begins eight days prior to the holiday and ends
the day before the holiday. However, unlike Easter, changes in consumer behavior

 8
associated with the Super Bowl will likely continue through Super Bowl Sunday because
the game is played in the evening, leaving plenty of time during the day for last minute
purchases.

The Genhol program published by the Census Bureau can create customized moving
holiday regressors for use with X-13ARIMA-SEATS (U.S. Census Bureau 2015). We use
Genhol to create a nine-day Super Bowl regressor describing an effect that begins eight
days prior to the Super Bowl and ends on Super Bowl Sunday, denoted SuperBowl[8-0].
Since the Super Bowl first became a moving holiday in 2002, we set the Super Bowl
regressor equal to zero prior to 2002.

The moving holiday regressors generated by Genhol describe an effect that induces a
constant shift in the level of the series for the length of the holiday effect. In other words,
the increase or decrease in the level of the series is the same throughout the entire holiday
effect window. For each month, the regressor is defined by the proportion of the holiday
effect window that falls within that month. For example, if the Super Bowl occurs on
February 3 and we were using the nine-day effect described above, 6/9 of the effect window
would fall in January and 3/9 of the effect window would fall in February. The long-term
calendar month mean is then subtracted from this proportion for a given month. Therefore,
the Super Bowl moving holiday regressor is nonzero for Januarys and Februarys and zero
elsewhere. Without access to daily data, testing for a holiday effect is limited to adding a
holiday regressor to the regression models for the MRTS series and comparing model fit
diagnostics against models without the holiday regressor. When adding a user-defined
regressor to a model in X-13ARIMA-SEATS, an optional test can be conducted comparing
the AICC of the model with and without the holiday regressor and selecting the model with
the smaller AICC.

We begin our investigation by first testing for the presence of Super Bowl effects in the
monthly time series. Models are estimated for published monthly retail and food services
sales by kind-of-business series, beginning January 2002 and ending February 2019, using
default model selection settings in Win X-13 and including the SuperBowl[8-0] regressor
described above. 11 We used the optional AICC test to determine whether to include the
Super Bowl regressor in the model. Table 1 presents the t statistics for the SuperBowl[8-
0] regressors that were selected into the model based on the AICC test and exceeded 1.96
in absolute value.

11
 The time span of 2002-2019 was used to reflect the time period when Super Bowl Sunday is
considering a moving holiday. Prior to 2002, Super Bowl Sunday and its effects fell exclusively in
January.

 9
Table 1: Super Bowl[8-0] effect results
 t statistic for
NAICS Series description SuperBowl[8-0]
 effect
442, Furniture, Home Furnishings, Electronics, and Appliance
 2.70
443 Stores
4421 Furniture Stores 1.98
443141 Household Appliance Stores 2.05
 Building Materials and Garden Equipment and
444 2.15
 Supplies Dealers
445 Food and Beverage Stores 3.28
4451 Grocery Stores 2.31
4453 Beer, Wine, and Liquor Stores 4.09
44814 Family Clothing Stores 2.25
45291 Warehouse Clubs and Superstores 2.72
454 Nonstore Retailers -2.13
722 Food Services and Drinking Places 2.79
7224 Drinking Places 2.47
722511 Full Service Restaurants 3.18
722513,
722514, Limited Service Eating Places 2.09
722515
7225 Restaurants and Other Eating Places 3.39
Source: U.S. Census Bureau Monthly Retail Trade Survey data, 2002-2019

Some of the results in Table 1 align with the anecdotal evidence that consumers buy food,
alcohol, and televisions and other electronics before the Super Bowl. However, some of
the findings are harder to explain. Why is there a positive effect for building materials and
garden equipment? Is that related to the Super Bowl or is it more of winter storm effect
capturing sales of shovels and sidewalk salt? While analysis of daily data may not explicitly
answer these questions, it may help to better define consumer-spending habits in various
retail kinds of business around the Super Bowl.

 6. Using Daily Data to Identify Super Bowl Sunday Effects
6.1 Data
Raw payment processor data can have spikes and drops that are related to retailers joining
and leaving the payment processor platform for varying lengths of time. Since the Census
Bureau does not have access to the underlying microdata in the Fiserv dataset, the raw
series is difficult to use when analyzing consumer spending behavior over time. For the
purposes of this project, the chained merchant series created by Palantir and Fiserv was
used. Beginning in January 2010 and available to the Census Bureau through December
2017, the chained merchant series contains only those well-behaved merchants who had
transactions in the current month as well as in the previous 13 months. “Well-behaved” in
this context is defined to be those merchants that have not demonstrated a ramp-up in
activity on a Fiserv platform, have not exited the platform, and have not exhibited sparse
and inconsistent transactions or transaction batching. Additionally, merchants that are
outliers in the share of transactions or transaction growth are also excluded from the
chained merchant series. These series are available for a subset of the NAICS industries

 10
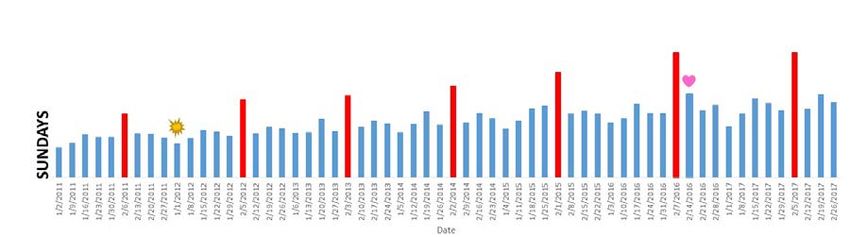
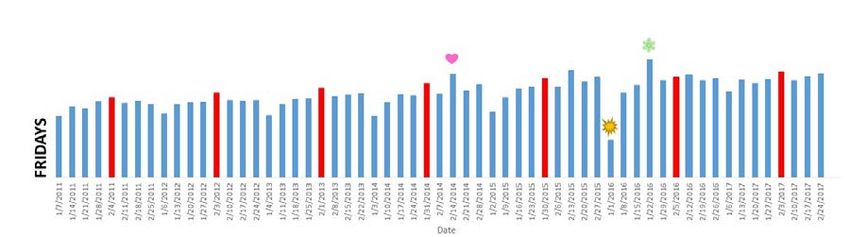
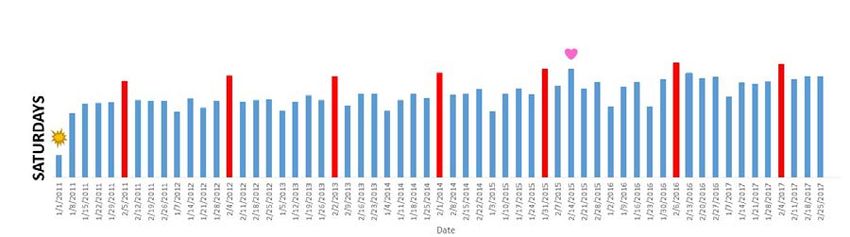
included in the MRTS estimates at the national-level and for each of the 50 states and the
District of Columbia. A full list of industries by NAICS code available in the chained
merchant series is available in the Appendix.

The Census Bureau had no control over this methodology but received the technical
documentation explaining the method. We are comfortable using this data for this research
because the data are being used to better inform methodologists regarding patterns of retail
consumer behavior in the same manner other third-party data sources are typically used by
Census Bureau analysts. As mentioned earlier in the paper, other government entities like
the Federal Reserve Board and the Bureau of Economic Analysis are using the Fiserv data
in a similar manner: as a reference point for decision-making. The Census Bureau is not
using this third-party data source to create a standalone data product or to supplement
existing estimates.

6.2 Methodology
To understand consumer behaviors on each day of the week, time series by day were
constructed from the full time series for each of the seven days of the week for each
NAICS-based industry included in the chained merchant series. We subset the daily data
to include only the observations from January and February. In retail, January and February
are typically two of the lower retail sales months capturing a winter and post-holiday
slowdown. When measuring a Super Bowl Sunday effect, it may make sense to measure
the behavior of the days leading up to the Super Bowl against other days in January and
February rather than against the full time series where months are not similar in behavior
to January and February.
Reflecting back to the initial work done with Easter Sunday, plots of sales by day of the
week are a good starting point in identifying changes in consumer spending patterns around
Super Bowl Sunday through the use of daily data. Figures 2 through 8 show the Fiserv
consumer spending by days of the week for Beer, Wine, and Liquor Stores (NAICS 4453)
during the months of January and February. 12 We hypothesize that we should see an
increase in spending in this NAICS leading up to the Super Bowl. The darker (red) bars
denote that the day of the week is either Super Bowl Sunday for Sundays or a day in the
week leading up to Super Bowl Sunday (i.e., the darker (red) bars in the Saturday graph
are those Saturdays that immediately precede Super Bowl Sunday). Consumer spending at
Beer, Wine, and Liquor Stores is generally higher on Super Bowl Sunday and the Saturday
before the Super Bowl when compared to other Sundays and Saturdays in January and
February. The Friday before the Super Bowl appears to have increased spending compared
to other Fridays at the beginning of series but the difference tapers off over time. The
differences in the remaining days of the week are less visually apparent.

During the months of January and February, other events occur that can cause a change in
consumer spending at Beer, Wine, and Liquor Stores in the Fiserv data. Observed events
include New Year’s Day (typically lower consumer spending is observed), Valentine’s Day
(typically higher consumer spending is observed), and blizzards approaching the East
Coast (typically higher consumer spending is observed). For this reason, icons have been

12
 All Fiserv retail series were analyzed in a similar matter. Due to space constraints, we are
limiting the graphical results featured in the paper to the Beer, Wine, and Liquor Stores series
(NAICS 4453).

 11
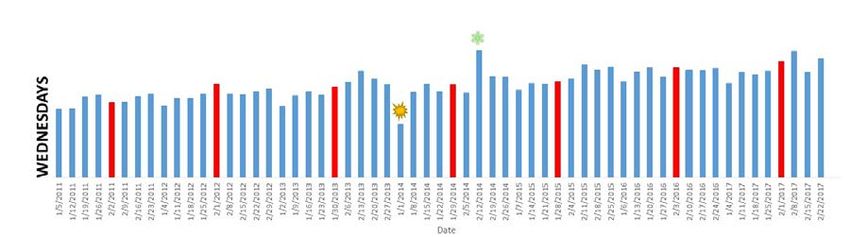
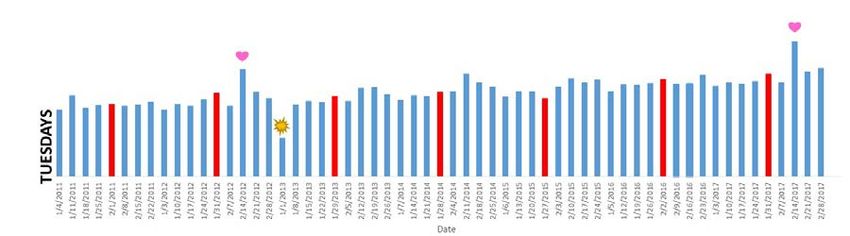
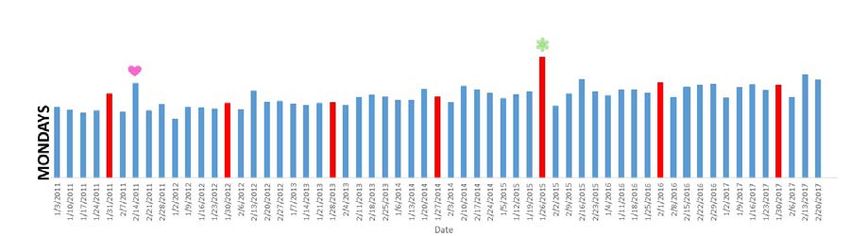
added to the daily data plots in Figures 2-8 to help clarify these outliers. A yellow firework
designates New Year’s Day (January 1st), a pink heart designates Valentine’s Day
(February 14th), and a green snowflake designates days leading up to blizzards on the East
Coast (February 12, 2014; January 26, 2015; January 21-22, 2016).

Figure 2: Consumer spending in Beer, Wine, and Liquor Stores (NAICS 4453) for
Sundays in January and February 2011-2017
Source: Fiserv’s daily consumer spending data

Figure 3: Consumer spending in Beer, Wine, and Liquor Stores (NAICS 4453) for
Saturdays in January and February 2011-2017
Source: Fiserv daily consumer spending data

Figure 4: Consumer spending in Beer, Wine, and Liquor Stores (NAICS 4453) for Fridays
in January and February 2011-2017
Source: Fiserv daily consumer spending data

 12
Figure 5: Consumer spending in Beer, Wine, and Liquor Stores (NAICS 4453) for
Thursdays in January and February 2011-2017
Source: Fiserv daily consumer spending data

Figure 6: Consumer spending in Beer, Wine, and Liquor Stores (NAICS 4453) for
Wednesdays in January and February 2011-2017
Source: Fiserv daily consumer spending data

Figure 7: Consumer spending in Beer, Wine, and Liquor Stores (NAICS 4453) for
Tuesdays in January and February 2011-2017
Source: Fiserv daily consumer spending data

Figure 8: Consumer spending in Beer, Wine, and Liquor Stores (NAICS 4453) for
Mondays in January and February 2011-2017
Source: Fiserv daily consumer spending data

 13
X-13ARIMA-SEATS does not currently model daily data and we wanted to start this work
using an initial simple model with hopes of adding complexities later if necessary. Ordinary
least squares regression was run on each day of the week series by NAICS industry using
an autoregressive model specified to capture seasonality as well as effects from individual
holidays that occur in January and February and may also impact retail sales. Two Super
Bowl Sunday regressors are included, one to capture effects in the six days leading up to
the Super Bowl as well as Super Bowl Sunday, the other regressor captures the week before
Super Bowl week. This second regressor represents the week following the playoff games
where the two teams that will participate in the Super Bowl are determined. We
hypothesize that more expensive items, such as televisions or furniture, may be purchased
further in advance of the Super Bowl, primarily during the weekend prior to the Super
Bowl, to allow adequate time for delivery and setup.

We first log transform the daily data and take the first difference of the transformed series
to give the series a constant mean and variance over time. Let be the series of daily
observations for a particular day of the week, (e.g. all of the Monday observations). Define
 = ( ) − ( −1 ). We then subset to include only observations in January or
February. We defined our regression model as follows:

 = 0 + 1 + 2 + 3 + 4
 + 1 −1 + 2 −2 + 52 −52
 Where
 • −1 , −2 , −52 are the lag 1, lag 2, and lag 52 values,
 respectively of the series
 • SB Week = 1 if the day falls in the six days leading up to the Super
 Bowl or on Super Bowl Sunday itself, 0 otherwise
 • Week Before SB = 1 if the day falls in the week before Super Bowl
 Week (i.e. two Mondays before Super Bowl Sunday through the
 Sunday before Super Bowl Sunday) , 0 otherwise
 • New Years = 1 if day is New Year’s Day, 0 otherwise
 • Valentine = 1 if the day falls in the 6 days leading up to
 Valentine’s Day or on Valentine’s Day itself, 0 otherwise
6.3 Results
Table 2 presents the t statistics for each NAICS industry with significant parameter
estimates (α=.05) for either the Super Bowl Week regressor or the Week Before Super
Bowl regression for the Saturday prior to the Super Bowl. We also present the t statistics
for significant parameter estimates for other days of the week leading up to the Super Bowl.
For the week prior to the Super Bowl week regressors, we found only one significant
parameter estimate, Saturday for NAICS 4453. Thus, we exclude the rest of the days of the
week for the week prior to the Super Bowl week from the table.

 14
Table 2: t statistics for significant Super Bowl Sunday related effects in January and
February by NAICS codes (α=.05)
 Super Bowl Week Sunday Two
 before Saturdays
 NAICS Super
 the before
 Code Bowl Sat Fri Thu Wed Tue Mon Super the Super
 Sunday Bowl Bowl
 441 -2.39
 4411 -2.32
 442 -2.80
 4421 -2.71
 4422 -3.51
 443 -2.29
 4431 -2.29
 445 2.92 3.70 2.14
 4451 2.38 2.99 2.17
 4452 3.81 3.69 2.08
 4453 5.60 4.16 2.53 2.02 2.55
 446 3.03
 4461 3.03
 4512 -2.15
 452 2.02 2.18
 4521 2.61 2.56 2.17
 4531 2.35
 4533 -1.97
 4539 3.26
 454 3.60
 4543 3.60
 722 -2.20
 7221 -2.77
Source: Fiserv daily consumer spending data

Based on the results in Table 2, we looked for consistent significant effects over a span of
days. Significant effects on Super Bowl Sunday only, although interesting, would not need
to be modeled as a moving holiday in the monthly time series because Super Bowl Sunday
always falls in February for the span of data we considered and would be part of the normal
seasonal pattern for February. For the remaining series, we generated moving holiday
regressors that match the patterns we observe in the daily data. For the series without a
significant effect on Super Bowl Sunday, we generate regressors to describe an effect that
ends one day prior to the Super Bowl. Otherwise, the regressors describe an effect that ends
on Super Bowl Sunday. We denote the Super Bowl moving holiday regressors with their
start and end dates relative to Super Bowl Sunday (e.g. SuperBowl[2-0] to describe the
effect that begins 2 days prior to the Super Bowl and ends Super Bowl Sunday).

 15
To apply the findings from the daily data to the MRTS data, we include the Super Bowl
regressors suggested by the daily data in the model for the corresponding MRTS times
series, where available. All other model settings are kept constant, only the Super Bowl
regressor was changed. No changes are made to the model for Beer, Wine, and Liquor
Stores (NAICS 4453) because the Super Bowl regressor suggested by the daily data is the
same as the nine-day SuperBowl[8-0] regressor we originally tested. For the series where
we did not originally include the SuperBowl[8-0] regressor, we compare the model with
the Super Bowl regressor suggested by the daily data to the model with no Super Bowl
effect. Table 3 displays the results for the series that we tested.

Table 3: Results for Super Bowl regressors suggested by patterns in the daily data.
 NAICS MRTS series Super Bowl t statistic Increase in
 code regressor AICC
 suggested by daily compared to
 data previous
 model
 445 Food and Super Bowl[2-0] 2.77* 2.97
 Beverage Stores
 4451 Grocery Stores Super Bowl[2-0] 1.84* 1.87
 4453 Beer, Wine, and Super Bowl[8-0] 4.09* 0.00
 Liquor Stores
 446 Health and Super Bowl[1-1] 1.64
 Personal Care
 Stores
 4461 Pharmacies and Super Bowl[1-1] 1.09 1.12
 Drug Stores
 452 General Super Bowl[3-1] 0.36 -0.31
 Merchandise
 Stores
 4521 Department Stores Super Bowl[3-1] 0.04 2.25
 454 Nonstore Retailers Super Bowl[1-1] -1.66* 1.74
 4543 Fuel Dealers Super Bowl[1-1] -1.64 -0.49
* indicates the model with the Super Bowl regressor selected into the model by the AICC
test compared to the model with no Super Bowl regressor
Source: U.S. Census Bureau Monthly Retail Trade Survey data, 2002-2019

In each case where the Super Bowl regressor is included in the model via the AICC test,
the model fit is slightly better with the nine-day holiday regressor we originally tested as
shown by an increase in the AICC presented in Table 3. Only General Merchandise
Stores (NAICS 452) and Fuel Dealers (NAICS 4543) showed a decrease in the AICC,
although these decreases are very small. Food and Beverages Stores (NAICS 445), Grocery
Stores (NAICS 4451), and Beer, Wine, and Liquor Stores (NAICS 4453) are the three
NAICS industries that would be the strongest candidates for implementing a Super Bowl
Sunday effect of some length as an effect is present in the MRTS data and is supported by
consumer spending patterns in the Fiserv daily data. The negative Super Bowl Sunday
effect in Nonstore Retailers (NAICS 454) is somewhat puzzling as it appears to be driven
by Fuel Dealers (NAICS 4543) in the Fiserv data. Anecdotally, it is difficult to link
depressed sales in fuel dealers to Super Bowl Sunday; it may in fact be related to fuel prices
in winter but that would require further investigation.

 16
For other NAICS industries, the significant Super Bowl Sunday effects in the Fiserv data
are not found in the MRTS data or vice versa. One possible reason is that as stated before,
the coverage of retailers in the Fiserv data is a relative unknown. So while we can
hypothesize that spending at the Fiserv subset of grocery and liquor stores is representative
of Super Bowl Sunday spending in the retail universe, it is difficult to hypothesize the same
about department stores or health and personal cares stores where individual retailers may
have markedly different consumer compositions.

 7. Conclusion and Next Steps
Anecdotal evidence has long suggested that consumer spending behaviors may change as
consumers prepare to watch the Super Bowl and plan Super Bowl parties. When the Super
Bowl was moved to be played on the first Sunday of February, it became a moving holiday
that if significant would shift sales impacts between January and February from year to
year. Monthly data reported to the Census Bureau’s Monthly Retail Trade Survey have
made it difficult to discern the impact of the Super Bowl in a meaningful way based on
data-driven evidence. Daily payment processor data from a third-party data source offer a
starting point for finding evidence of a change in consumer spending related to the Super
Bowl or other nationally recognized events. Based on the findings above, using daily
payment processor data from Fiserv, it is clear that there is a change in consumer spending
behavior in the days leading up to Super Bowl Sunday, particularly when it comes to
spending on food, beverages, and alcohol. However, for most series where an effect was
detected in the daily data, the Super Bowl effect length suggested by the daily data did not
produce a superior model fit in the monthly series compared to the originally tested Super
Bowl [8-0] effect (with the exception of Beer, Wine, and Liquor Stores series where the
daily data confirmed the Super Bowl [8-0] effect). Implementing a Super Bowl [8-0] effect
in these series for the Monthly Retail Trade Survey estimates may produce an improvement
in the seasonally adjusted estimates.

Using a third-party data source to make this kind of decision does have risk though. The
coverage of the Fiserv data is an unknown. It may make sense to pursue another third-party
data source to verify our findings. We would like to refine the model used in this work
more so that it can be applied to other third-party data sources to provide consistent results
over time.

The Super Bowl moving holiday regressors used in this research all described constant
changes to the retail time series for the entire Super Bowl effect window. For future
research, alternative definitions of the Super Bowl moving holiday regressors, such as
effects that increase or decrease linearly or exponentially leading up to the Super Bowl
could be considered.

The Census Bureau continues to pursue retail estimates at more granular geographies. If
those estimates are developed, using the daily data to find Super Bowl Sunday effects at
these geographies will be an interesting exercise to pursue more. We have begun
preliminary exploratory analysis on states that either hosted the Super Bowl or were home
to one of the participating teams. In this preliminary work, we have observed large
increases in activity in the week leading up to the Super Bowl in some retail kind-of-
business categories. We plan to continue this research to quantify these increases and
further investigate changes in retail behavior in states with a direct connection to a given
year’s Super Bowl.

 17
Acknowledgements
The authors would like to thank Kathleen McDonald-Johnson, Xijian Liu, Javier Miranda,
Scott Scheleur, Stephanie Studds, and James Livsey for their thoughtful comments on
previous versions of this paper.

 18
References

Aladangady, A., Aron-Dine, S., Dunn, W., Feiveson, L., Lengermann, P., and Sahm, C.
(2016). The Effect of Hurricane Matthew on Consumer Spending, FEDS Notes.
Washington: Board of Governors of the Federal Reserve System, December 2, 2016,
https://doi.org/10.17016/2380-7172.1888. Accessed online 6/2/2019.

American Association for Public Opinion Research (AAPOR). (2015). AAPOR Report on
Big Data, AAPOR Big Data Task Force 2015.

Chen, J., Dunn, A., Hood, K., Driessen, A., and Batch, A. (2018). Machine Learning for
National Economic Accounts, https://www.bea.gov/system/files/2018-11/2018-11-06-
JeffChen-ACM-nn-wide.pptx. Accessed online 6/2/2019.

Dumbacher, B., Morris, D.S., and Hogue, C. (2019). Using Electronic Transaction Data to
Add Geographic Granularity to Official Estimates of Retail Sales. Journal of Big Data
6(80). https://doi.org/10.1186/s40537-019-0242-z

Hutchinson, R. J., and Scheleur, S. A. (2017). Using Big Data to Enhance US Census
Bureau Economic Data Products. Proceedings of the American Statistical Association,
Business and Economic Statistics Section.

Jarmin, R. S. (2019). Evolving Measurement for an Evolving Economy: Thoughts on 21st
Century US Economic Statistics. Journal of Economic Perspectives 33 (1), 165-184.

McElroy, T. S., Monsell, B., and Hutchinson., R. (2018). Modeling of Holiday Effects and
Seasonality in Daily Time Series. Center for Statistical Research and Methodology Report
Series RRS2018/01. Washington: US Census Bureau. https://www.census.gov/
srd/papers/pdf/RRS2018-01.pdf

National Retail Federation. (2019, January 24). Consumers Say They'll Spend an
Average $81 on Super Bowl. Retrieved from National Retail Federation Web site:
https://nrf.com/media-center/press-releases/consumers-say-theyll-spend-average-81-
super-bowl. Accessed online 6/2/2019.

Robinson, E. (February 5, 2017). How 9/11 Changed the Super Bowl Forever,
https://www.ozy.com/flashback/-how-9/11-changed-the-super-bowl-forever/75330.
Accessed online 6/2/2019.

U. S. Census Bureau (2015), Genhol Documentation, U. S. Census Bureau, U. S.
Department of Commerce https://www.census.gov/srd/www/genhol/genhol_run.html
Accessed online 6/19/2019.

 19
Appendix

List of NAICS codes included in the Fiserv Chained Merchant Series
 NAICS NAICS
 Description Description
 code code
 Sporting Goods, Hobby, Musical
 441 Motor Vehicle and Parts Dealers 451
 Instrument, and Book Stores
 Sporting Goods, Hobby, and Musical
 4411 Automobile Dealers 4511*
 Instrument Stores
 4412* Other Motor Vehicle Dealers 4512* Book Stores And News Dealers
 Automotive Parts, Accessories, and
 4413 452 General Merchandise Stores
 Tire Stores
 442 Furniture and Home Furnishings Stores 4521 Department Stores
 4421 Furniture Stores 4529 Other General Merchandise Stores
 4422 Home Furnishings Stores 453 Miscellaneous Store Retailers
 443 Electronics and Appliance Stores 4531* Florists
 Office Supplies, Stationery, and Gift
 4431* Electronics and Appliance Stores 4532*
 Stores
 Building Materials And Garden
 444 4533* Used Merchandise Stores
 Equipment and Supplies Dealers
 Building Materials and Supplies
 4441 4539* Other Miscellaneous Store Retailers
 Dealers
 Lawn And Garden Equipment and Electronic Shopping and Mail-Order
 4442* 454
 Supplies Stores Houses
 445 Food and Beverage Stores 4543* Direct Selling Establishments
 4451 Grocery Stores 721** Accommodation
 4452* Specialty Food Stores 7211** Traveler Accommodation
 RV (Recreational Vehicle) Parks and
 4453 Beer, Wine, and Liquor Stores 7212**
 Recreational Camps
 446 Health and Personal Care Stores 722 Food Services and Drinking Places
 4461* Health and Personal Care Stores 7221* Full-Service Restaurants
 447 Gasoline Stations 7222* Limited-Service Eating Places
 4471* Gasoline Stations 7223* Special Food Services
 Clothing and Clothing Accessories
 448 7224 Drinking Places
 Stores
 4481 Clothing Stores
 4482 Shoe Stores
 Jewelry, Luggage, and Leather Goods
 4483*
 Stores
* These NAICS levels are not published as part of the Monthly Retail Trade report. More detailed
levels that sum to these levels or equivalent higher levels may be published as part of the Monthly
Retail Trade report
** These NAICS levels are published as part of the Quarterly Services Survey (QSS). More
information on QSS is available here: https://www.census.gov/services/index.html

 20
You can also read