Air Monitoring Network Plan - 2021 State of Hawaii
←
→
Page content transcription
If your browser does not render page correctly, please read the page content below
State of Hawaii
        2021
   Air Monitoring
   Network Plan
Submitted to the U.S. EPA Region 9
         July 1, 2021
           Prepared by:
          State of Hawaii
        Department of Health

 Environmental Management Division
           Clean Air Branch
                 and
      State Laboratories Division
    Air Quality Monitoring Section
        Document Control Number
       HDOH – AMNP – 2021 - v01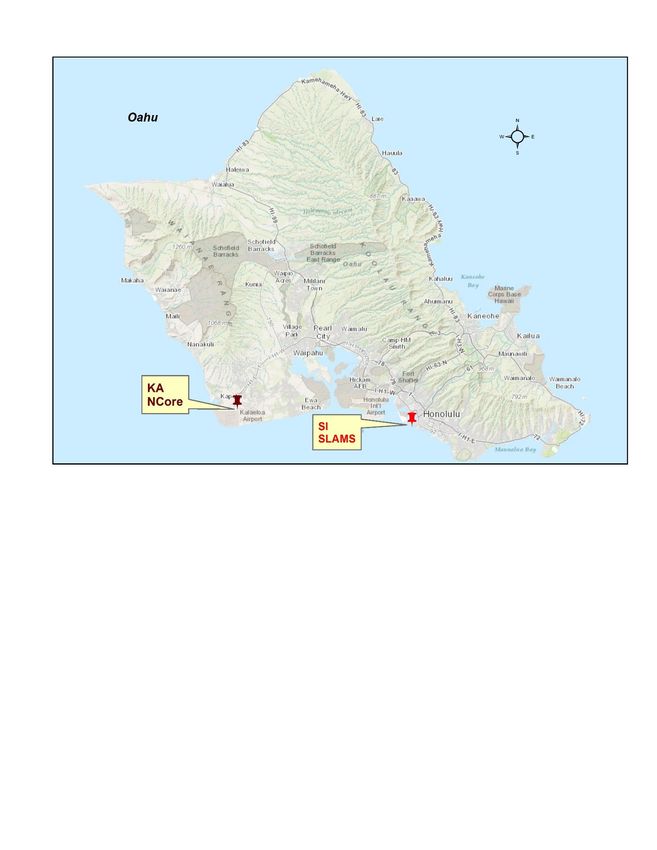
This page intentionally left blank
Table of Contents
List of Tables ............................................................................................................................. 3
List of Figures ........................................................................................................................... 3
Acronyms and Definitions ........................................................................................................ 4
Introduction ............................................................................................................................... 5
Appendix A .............................................................................................................................. 82
Appendix B .............................................................................................................................. 83
1.0 Network Purpose and Design ....................................................................................... 6
1.1 Overview .............................................................................................................. 6
1.1.1 SLAMS.................................................................................................... 6
1.1.2 SPMS ..................................................................................................... 6
1.2 Network Design and Review Process .................................................................. 7
1.2.1 Monitoring Objectives and Site Types ..................................................... 7
1.2.2 PM2.5 Network Changes .......................................................................... 8
1.3 Organizational Structure and Responsibilities ...................................................... 8
2.0 Network Evaluation ...................................................................................................... 9
2.1 PM10 Network ....................................................................................................... 9
2.2 PM2.5 Network .................................................................................................... 11
2.3 O3 Network ........................................................................................................ 14
2.4 Pb Network ........................................................................................................ 16
2.5 CO Network ....................................................................................................... 17
2.6 NO2 Network ...................................................................................................... 18
2.7 SO2 Network ...................................................................................................... 19
2.8 NCore ................................................................................................................ 22
2.9 H2S Network ...................................................................................................... 22
2.10 Site Closures ..................................................................................................... 22
2.10.1 Pearl City SLAMS ................................................................................. 23
2.10.2 Kihei SLAMS ......................................................................................... 23
2.10.3 Kahului SPMS ....................................................................................... 23
2.10.4 Niumalu SPMS...................................................................................... 24
2.10.5 Honaunau SPMS .................................................................................. 24
2.10.6 Waimalu DDR ....................................................................................... 24
2.11 Site Additions ..................................................................................................... 24
2.12 Site Modifications ............................................................................................... 25
2.12.1 Leilani Community Association Center SPMS ....................................... 25
2.12.2 Kapolei SLAMS/NCore.......................................................................... 25
2.12.3 Sand Island – SLAMS ........................................................................... 25
2.12.4 Keeau SPMS ........................................................................................ 25
2.12.5 Naalehu-TP and TS SPMS ................................................................... 26
2.12.6 Pahoa SPMS ........................................................................................ 26
2.12.7 Waikoloa Temporary and Long-term SPMS .......................................... 26
2.13 Summary of Network and Changes.................................................................... 27
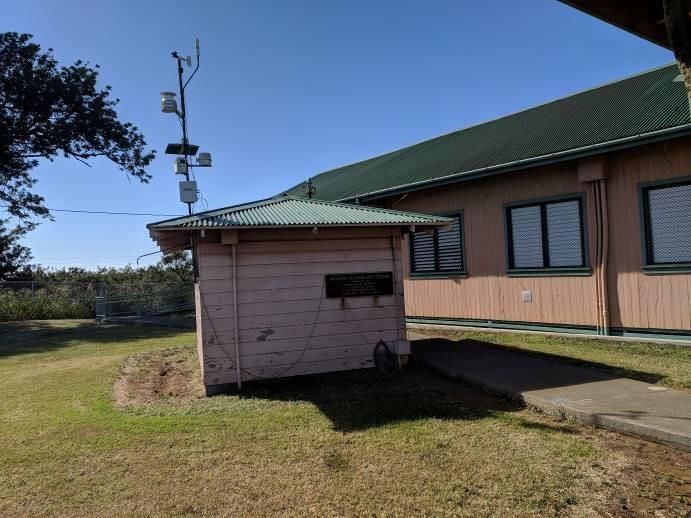
3.0 Detailed Site Descriptions .......................................................................................... 32
(DH) HONOLULU .......................................................................................................... 33
(KA) KAPOLEI SLAMS and NCORE ............................................................................. 35
(PC) PEARL CITY ......................................................................................................... 40
(SI) SAND ISLAND ........................................................................................................ 42
(KH) KIHEI .................................................................................................................... 44
(KL) KAHULUI ............................................................................................................... 46
(NI) NIUMALU ............................................................................................................... 48
2021 Annual Network Plan 1 State of Hawaii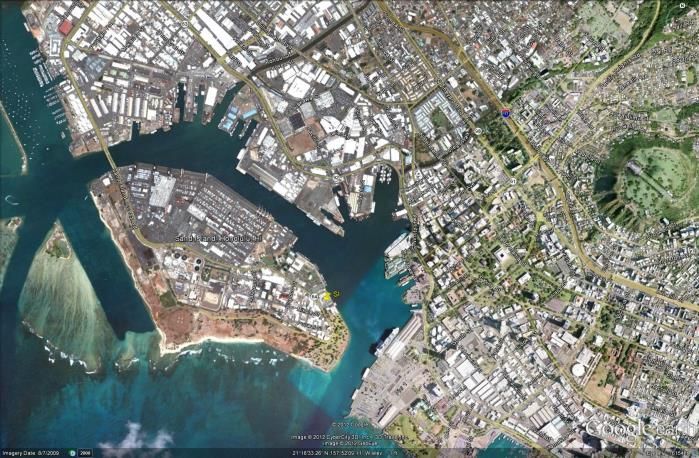
(HL) HILO ...................................................................................................................... 50
    (KN) KONA .................................................................................................................... 52
    (MV) MOUNTAIN VIEW ................................................................................................ 54
    (OV) OCEAN VIEW ....................................................................................................... 56
    (PA) PAHALA ................................................................................................................ 58
    (HN) HONAUNAU ......................................................................................................... 60
    (KK) KAILUA-KONA ...................................................................................................... 62
    (KS-T) KEAAU – Temporary.......................................................................................... 64
    (KS-LT) KEAAU – Long-term......................................................................................... 66
    (NA-TP) NAALEHU – Temporary PM2.5 ......................................................................... 68
    (NA-TS) NAALEHU – Temporary SO2 ........................................................................... 70
    (WL-T) WAIKOLOA – Temporary .................................................................................. 72
    (WL-LT) WAIKOLOA – Long-term ................................................................................. 74
    (LE) LEILANI COMMUNITY ASSOCIATION CENTER .................................................. 76
    (KE) KAHE .................................................................................................................... 78
    (WI) WAIAU ................................................................................................................... 80

2021 Annual Network Plan                                        2                                                State of Hawaii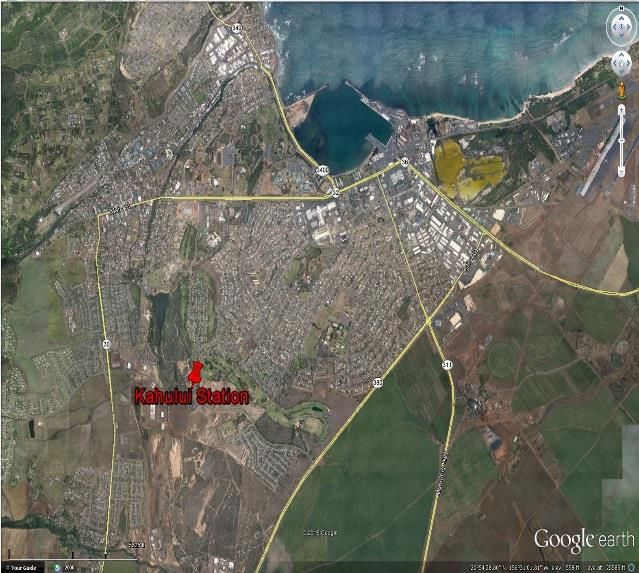
List of Tables

Table 2-1       PM10 Network and Concentrations for the Honolulu MSA .......................... 9
Table 2-2       PM10 Minimum Monitoring Requirements for Each MSA ........................... 9
Table 2-3       PM2.5 Network and Concentrations for Each MSA ................................... 11
Table 2-4       PM2.5 Minimum Monitoring Requirements for Each MSA......................... 12
Table 2-5       PM2.5 Co-located Network ........................................................................ 12
Table 2-6       O3 Design Values for the Honolulu MSA.................................................. 14
Table 2-7       O3 Minimum Monitoring Requirements for Each MSA ............................. 14
Table 2-8       Minimum Pb Monitoring Requirement at NCore ...................................... 16
Table 2-9       Minimum Near-Road NO2 Monitoring Requirements for the MSA ........... 18
Table 2-10      Minimum SO2 Monitoring Requirements .................................................. 20
Table 2-11      Number of Monitors by Pollutant or Program ........................................... 27
Table 2-12      Summary of Network Changes ................................................................ 28
Table 3-1       State of Hawaii Ambient Air Monitoring Network ..................................... 32
Table B-1       PM2.5 Data Completion Percentages ......................................... Appendix B
Table B-2       PM2.5 Annual Design Values for Station Closures...................... Appendix B
Table B-3       PM2.5 24-Hour Design Values for Station Closures .................... Appendix B
Table B-4       PM10 Data Completion Percentages .......................................... Appendix B
Table B-5       PM10 Design Values for Station Closure .................................... Appendix B
Table B-6       SO2 Data Completion Percentages............................................ Appendix B
Table B-7       SO2 Design Values for Station Closures .................................... Appendix B
Table B-8       NO2 Data Completion Percentages ........................................... Appendix B
Table B-9       NO2 Annual Design Values for Station Closure ......................... Appendix B
Table B-10      NO2 1-Hour Design Values for Station Closure ......................... Appendix B
Table B-11      CO Data Completion Percentages ............................................. Appendix B
Table B-12      Exceedance of CO 1-Hour and 8-Hour NAAQS ........................ Appendix B

                                                List of Figures

Figure 2-1      PM10 Network........................................................................................... 10
Figure 2-2      PM2.5 Network .......................................................................................... 13
Figure 2-3      O3 Network .............................................................................................. 15
Figure 2-4      CO Network ............................................................................................. 17
Figure 2-5      NO2 Network ............................................................................................ 18
Figure 2-6      SO2 Network ............................................................................................ 21

   2021 Annual Network Plan                                 3                                           State of Hawaii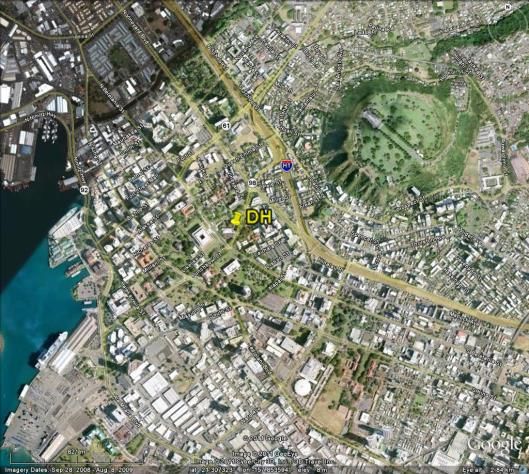
Acronyms and Definitions

AADT                 Annual Average Daily Traffic
AQI                  Air Quality Index
AQMS                 Hawaii Department of Health Air Quality Monitoring Section
AQS                  Environmental Protection Agency Air Quality System
BAM                  Beta-Attenuation Mass Monitor
CAB                  State of Hawaii Department of Health Clean Air Branch
CBSA                 Core-Based Statistical Areas
CFR                  Code of Federal Regulations
CO                   Carbon Monoxide
DOH                  Hawaii State Department of Health
DOT                  Hawaii State Department of Transportation
DRR                  Data Requirements Rule
DWS                  Hawaii County Department of Water Supply
ECA                  (North American) Emissions Control Area (Maritime)
EPA                  United States Environmental Protection Agency
EMD                  State of Hawaii Department of Health Environmental Management Division
FEM                  Federal Equivalent Method
FRM                  Federal Reference Method
H2S                  Hydrogen Sulfide
HECO                 Hawaiian Electric Company
IMPROVE              Integrated Monitoring of Protected Visual Environments
LERZ                 Kilauea Volcano Lower East Rift Zone
MSA                  Metropolitan Statistical Area
MSL                  Mean Sea Level
MWC                  Municipal Waste Combustor
NAAQS                National Ambient Air Quality Standards
NCore                National Core Multi-Pollutant Monitoring Stations
NEI                  National Emissions Inventory
NO2                  Nitrogen Dioxide
O3                   Ozone
PAMS                 Photochemical Assessment Monitoring Station
Pb                   Lead
PGV                  Puna Geothermal Ventures
PM2.5                Particulate matter less than or equal to 2.5 microns in aerodynamic diameter
PM10                 Particulate matter less than or equal to 10 microns in aerodynamic diameter
PM10-2.5             Particulate matter coarse
PQAO                 Primary Quality Assurance Organization
PPB                  Parts per billion
PPM                  Parts per million
PSD                  Prevention of Significant Deterioration
PWEI                 Population Weighted Emissions Index
QC                   Quality Control
SLAMS                State and Local Air Monitoring Stations
SLD                  State Laboratories Division
SLDIT                State Laboratories Division Information Technology
SO2                  Sulfur Dioxide
SPM(S)               Special Purpose Monitoring (Stations)
STN                  Speciation Trends Network
TPY                  Tons per Year
TSA                  Technical Systems Audit
TSP                  Total suspended particulates
VMAP                 Vog Measurement and Prediction Project
VOG                  Haze due to volcanic emissions
WD                   Wind direction
WS                   Wind speed
µg/m3                micrograms per cubic meter of air

  2021 Annual Network Plan                          4                                    State of Hawaii
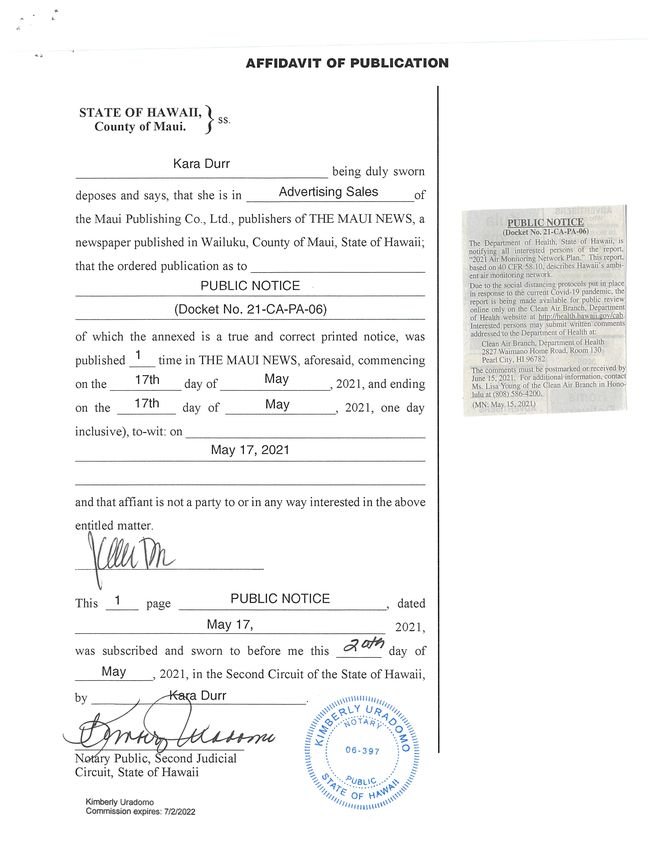
Introduction
The State of Hawaii Department of Health (DOH) plans, operates and maintains the
statewide ambient air quality monitoring network. Monitoring data is used for a variety
of reasons including determining compliance with National Ambient Air Quality
Standards (NAAQS), timely reporting of the U.S. Environmental Protection Agency’s
(EPA) Air Quality Index (AQI), tracking and characterizing air quality trends, evaluating
emission control strategies, and supporting health studies.

The DOH manages all the State and Local Air Monitoring Stations (SLAMS), Special
Purpose Monitoring Stations (SPMS), and the National Core Multi-Pollutant Monitoring
Station (NCore). Additionally, Hawaii has two Interagency Monitoring of Protected
Visual Environments (IMPROVE) stations located at Haleakala National Park on Maui
and Volcanoes National Park on the island of Hawaii. The IMPROVE stations are
operated and maintained by the National Park Service through their federal land
management agency. DOH is also overseeing two ambient air stations on the island of
Oahu that are operated by Hawaiian Electric Company (HECO) to meet the Data
Requirements Rule (DRR).

This annual review evaluates the state’s existing ambient air monitoring network to
determine adequacy in meeting monitoring objectives, optimizes the network by closing,
moving or adding stations, and ensures that air quality issues important to the state are
being addressed. The review ensures that the network is providing adequate, quality
assured and useful data to meet the needs of stakeholders.

This plan encompasses the 18-month period from July 1, 2021 through
December 31, 2022. However, unplanned modifications may occur due to limited
resources such as, funding reductions, staffing shortages, unanticipated site issues, or
changes in EPA monitoring requirements. This plan is being submitted to the EPA
Region 9 according to the Code of Federal Regulations (CFR), Title 40, Part 58, Section
58.10.

Notification of the plan availability for public inspection was provided through public
notices published on May 17, 2021 in the daily newspapers of all counties. The plan
was available for review on the Clean Air Branch website, http://health.hawaii.gov/cab,
for 30 days from May 17, 2021 to June 15, 2021 (due to social distancing protocols put
in place in response to the COVID-19 pandemic, the plan was only available online and
not at all county District Health offices). Documentation of public notification is provided
in Appendix A. No comments were received.

The commenting period for the 2020 Air Monitoring Network Plan ended on
July 2, 2020, one day after it was submitted on July 1, 2020. No comments were
received for the entire commenting period. A copy of the affidavit provided by the Maui
daily newspaper for the 2020 plan was inadvertently omitted from the submittal; it is
included in Appendix A of this year’s plan.

   2021 Annual Network Plan                   5                               State of Hawaii
1.0 Network Purpose and Design
1.1       Overview

EPA established NAAQS for the following criteria pollutants: carbon monoxide (CO),
lead (Pb), nitrogen dioxide (NO2), ozone (O3), sulfur dioxide (SO2), particulate matter 10
microns or less in aerodynamic diameter (PM10) and particulate matter 2.5 microns or
less in aerodynamic diameter (PM2.5). Additionally, there is a state standard for
hydrogen sulfide (H2S) that was established primarily to monitor the ambient air effects
of geothermal energy production activities on the island of Hawaii. In 2011 the state
established the NCore station as required by 40 CFR 58. The NCore station monitors
for PM2.5, speciated PM2.5, particulate matter coarse (PM10-2.5), O3, SO2, CO, nitrogen
oxides (NO/NO2/NOy) and the meteorological parameters wind speed, wind direction,
ambient temperature and relative humidity. Hawaii’s air quality surveillance network
consists of compliance stations monitoring for criteria pollutants as well as the NCore
station and special purpose monitoring stations.

The annual network review ensures that Hawaii continues to meet monitoring and siting
requirements, the three basic monitoring objectives, addresses the six site types in 40
CFR 58 Appendix D, provides information for non-regulatory data goals and the
requirements of 40 CFR 58 appendices A, C, D, and E as follows:
   •     Appendix A: Quality Assurance Requirements for SLAMS, SPMSs and PSD
         Air Monitoring
   •     Appendix C: Ambient Air Quality Monitoring Methodology
   •     Appendix D: Network Design Criteria for Ambient Air Quality Monitoring
   •     Appendix E: Probe and Monitoring Path Siting Criteria for Ambient Air Quality
         Monitoring

      1.1.1 SLAMS

      SLAMS are established primarily to demonstrate compliance with the NAAQS, and
      to meet minimum monitoring requirements as required in 40 CFR 58 Appendix D.
      All SLAMS must meet quality assurance, methodology, and siting requirements of
      40 CFR 58 Appendix A, C and E, respectively. All data is submitted to EPA’s Air
      Quality System (AQS) within 90 days at the end of each calendar quarter, as
      required in 40 CFR 58.16.

      EPA mandated that each state establish a minimum of one NCore station to support
      tracking of long-term trends of criteria and non-criteria pollutants, model evaluation,
      long-term health and ecosystem assessments, and other scientific and technological
      studies. Hawaii’s NCore station became fully operational on January 1, 2011. The
      SLAMS network excludes SPMS but includes NCore.

      1.1.2 SPMS

      SPMS are operated for specific areas of interest to the state and is not part of the
      minimum monitoring requirements. Hawaii’s SPM network is established primarily to
      monitor air quality impacts of emissions from Kilauea volcano, hydrogen sulfide
      (H2S) emissions from geothermal energy production and impacts from cruise ships
      2021 Annual Network Plan                 6                               State of Hawaii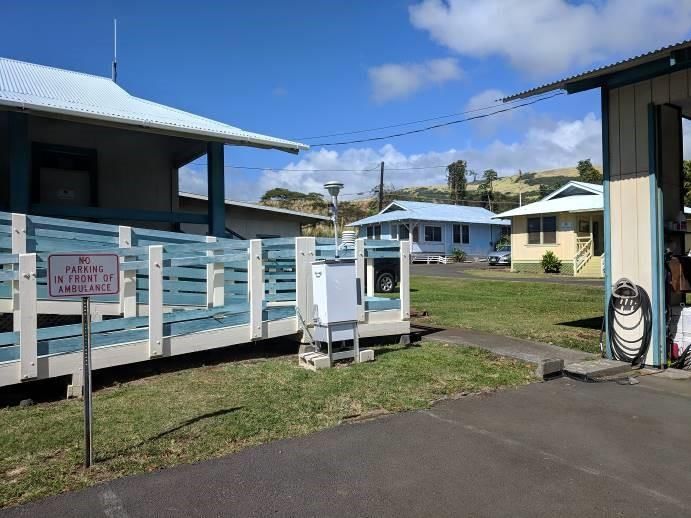
on the island of Kauai. The DOH utilizes Federal Reference Method (FRM) or Federal
      Equivalent Method (FEM) analyzers for all criteria SPMS, meets the quality assurance
      requirements of 40 CFR 58 Appendix A and E, and submits criteria pollutant data to
      AQS. All data from SPMS which have operated for more than 24 months is eligible
      for comparison to respective NAAQS.

1.2      Network Design and Review Process

The network review process is conducted to determine if any changes or modifications
to the network are necessary. Changes such as meeting new NAAQS monitoring
requirements, utilizing newer and better technology, reducing or eliminating redundancy
and low value monitoring, ensuring that sufficient data is being collected using the best
technology, and that all siting and quality assurance requirements are met.

Modification decisions are made using a variety of tools, including but not limited to:
data trend analyses; performance and technical systems audits; regular site
inspections; cost and value analyses; assessment of unfavorable site changes such as
loss of lease or construction that adversely affect data collection; and the need to
address special studies or new regulatory as well as non-regulatory monitoring
objectives.

      1.2.1 Monitoring Objectives and Site Types

      Ambient air monitoring networks must be designed to meet three basic objectives as
      stated in 40 CFR 58 Appendix D:
          1) Provide air pollution data to the general public in a timely manner.
          2) Support compliance with NAAQS and emissions strategy development.
          3) Support air pollution research studies.

      The state’s ambient air monitoring network achieves all three objectives as follows:
         1) Air pollution data from all SLAMS and SPMS are exhibited near real-time on
            the DOH public website. Additionally, continuous PM2.5 and O3 data is
            provided to EPA’s AIRNow website for use in calculating the AQI, SO2 data is
            provided for the Hawaii SO2 Short Term Advisory, and PM2.5 and SO2 data is
            provided to the Vog Measurement and Prediction Project (VMAP).
         2) Data from SLAMS are used to demonstrate compliance with the NAAQS and
            in development and tracking of emissions control strategies. Similarly, data
            from the NCore station is used to demonstrate compliance with the NAAQS
            and to track long-term trends of criteria and non-criteria pollutants as well as
            support emissions control strategies.
         3) All SLAMS, SPMS, and NCore monitoring provide valuable information in
            support of air pollution, health and other scientific studies.

      In order for the network to support the three basic objectives outlined above, it must
      be designed with a variety of monitoring site types. The six general site types are:
          1) Determine the highest pollutant concentrations expected in the network.
          2) Measure typical concentrations in areas of high population density.
          3) Determine the impact of significant sources or source categories on air
              quality.
          4) Determine general background concentrations.
      2021 Annual Network Plan                   7                              State of Hawaii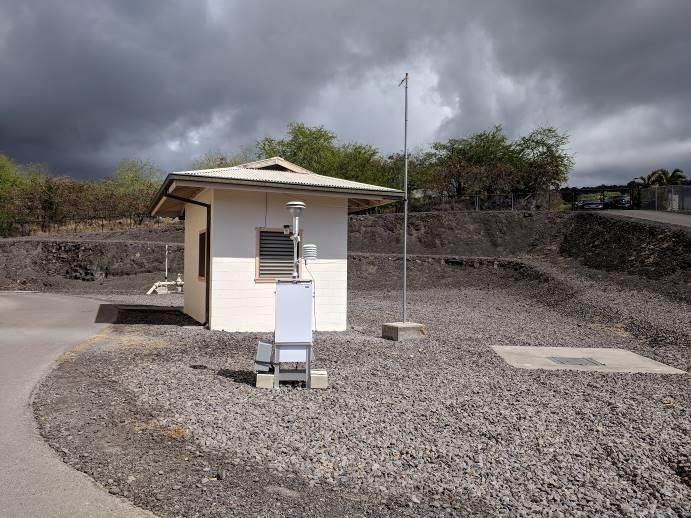
5) Determine the extent of regional pollutant transport between populated areas.
          6) Measure pollution impacts on visibility, vegetation, crops, animals, and
             buildings.

      The site type for each station in the network is included in its detailed description in
      Section 3.0 of this document.

      1.2.2 PM2.5 Network Changes

      According to 40 CFR 58.10 (c), this network plan must document how the state will
      provide for a review of changes to a PM2.5 monitoring network that impact the
      location of a violating PM2.5 monitor or the creation or change to a community
      monitoring zone, including a description of the proposed use of spatial averaging for
      purposes of making comparisons to the annual PM2.5 NAAQS as set forth in Part 50
      Appendix N. The agency must also document the process for obtaining public
      comment and include any comments received through the public notification process
      within the submitted plan.

      The state does not have, nor is intending to create, any community monitoring zones
      and does not utilize spatial averaging for comparison to the PM2.5 NAAQS. The
      state has in place a public notification procedure which includes posting notice in the
      newspapers of all counties and on the agency web site allowing for public viewing
      and comments of the changes that are in the annual network plan document.

1.3       Organizational Structure and Responsibilities

The DOH Clean Air Branch (CAB) is the state agency responsible for planning,
management, and regulatory activities associated with the state’s air program. The
HDOH serves as the Primary Quality Assurance Organization (PQAO) with two
separate divisions within the DOH responsible for quality assurance oversight and data
collection.

The CAB in the Environmental Management Division (EMD) is responsible for the
overall planning, siting, and quality assurance oversight of the ambient air monitoring
program, is organizationally independent of data collection activities. The Air Quality
Monitoring Section (AQMS) of the State Laboratories Division (SLD) is responsible for
all data collection activities including installing, operating, maintaining ambient air
monitoring equipment and stations, providing valid quality assured, documented and
defensible data that meet EPA QA requirements. The SLD - IT provides quality assured
data to AQS. AQMS contracts out laboratory support for co-located PM2.5 mass
analyses.

      2021 Annual Network Plan                   8                               State of Hawaii
2.0 Network Evaluation
There are minimum monitoring requirements for PM10, PM2.5, O3, SO2, and Pb for each
Metropolitan Statistical Area (MSA) in the state as described in 40 CFR 58 Appendix D.
In 2013, the U.S. Office of Management and Budget designated two MSAs in the State
of Hawaii, Urban Honolulu and Kahului-Wailuku-Lahaina (Maui County, excluding
Kalawao County). The 2019 census population was estimated at 974,563 for the Urban
Honolulu MSA (hereafter called Honolulu) and 167,417 for the Kahului-Wailuku-Lahaina
MSA (hereafter called Maui). The 2020 census population was estimated at 1,407,006
for the state, down 0.6% from the 2019 estimate of 1,415,615 (according to the
Department of Business and Economic Development and Tourism, demographic 2020
census data will be released between August and September 2021, breakdown by
MSAs were not available). There are five counties in the state: Kauai (islands of Niihau
and Kauai); City & County of Honolulu (island of Oahu); Maui (islands of Maui, Molokai,
Lanai, Kahoolawe, excluding Kalawao County); Kalawao (Kalaupapa Settlement on
Molokai) and Hawaii (island of Hawaii).
2.1 PM10 Network
The minimum number of required PM10 monitoring stations for the MSA is dependent
upon population and concentration measurements. High concentration areas are those
for which the ambient PM10 data show concentrations exceeding the PM10 NAAQS by
20 percent or more. Medium and low concentration areas are those for which ambient
PM10 data show concentrations exceeding 80 percent of the NAAQS, and
concentrations less than 80 percent of the NAAQS, respectively.
PM10 data for 2020 showed the Honolulu MSA to be a low concentration area (Table
2-1) and, therefore, is required to have one to two PM10 monitors (Table 2-2). In the
absence of a PM10 design value for the newly designated Maui MSA and with a
population 80% of NAAQS 120 µg/m3) (1,000,000 6-10 4-8 2-4
500,000-1,000,000 4-8 2-4 1-2
250,000-500,000 3-4 1-2 0-1
100,000-250,000 1-2 0-1 0
2019 Census Highest 24-hr Required # of # of Active Monitors # of Monitors
MSA
Population (estimated) Value (2020) Monitors in the MSA Needed
Honolulu 974,563 43 µg/m3 1-2 3 0
Maui 167,417 No data available 01 0 0
1
40 CFR Part 58 Appendix D Section 4.6 Table D-4 states that in the absence of a design value, these minimum monitoring
requirements apply.
2021 Annual Network Plan 9 State of HawaiiFigure 2-1 is a map of the current PM10 sites in the state. All of the PM10 stations are in
the Honolulu MSA.
Figure 2-1. PM10 Network
2021 Annual Network Plan 10 State of Hawaii2.2 PM2.5 Network
The state must operate a minimum number of required PM2.5 monitors based on
population and the most recent 3-year design value in each MSA. There are four PM2.5
SLAMS in the Honolulu MSA and one SLAMS in the Maui MSA with complete design
values. The design value for the annual PM2.5 standard is the most current 3-year
average annual mean for each site. The design value for the 24-hour PM2.5 standard is
the most current 3-year average of annual 98th percentile 24-hour values recorded at
each monitoring site. Table 2-3 shows the annual and daily design values for complete
data years 2018 to 2020.
The most recent 3-year design values in the Honolulu and Maui MSAs were less than
85% of any PM2.5 NAAQS. Table 2-4 shows that the state operates more than the
minimum monitoring requirements for PM2.5 in each MSA. Additionally, in 2020, the
state operated one SPMS in the Maui MSA and ten SPMS on the island of Hawaii for
volcanic emissions, and one SPMS on the island of Kauai to monitor cruise ship
emissions.
Part of DOH’s response to the 2018 eruption at the Lower East Rift Zone (LERZ) of
Kilauea volcano, was to supplement the existing PM2.5 network with additional SPMS
sites on Hawaii island. Six new SPMS sites were identified, and temporary monitors
were set up in communities around the island.
At the time of this plan’s publication, a few of the monitors are still operating at the
temporary locations but are slated to be relocated to the selected SPMS/long-term sites.
See Section 2.12 for discussion on site modifications and Section 3.0 for detailed
location information.
The IMPROVE monitoring station (HACR1) at Haleakala National Park on Maui,
operated by the National Park Service, serves as the background/transport PM2.5 site
for the state’s network. All primary PM2.5 monitors operated by the state are continuous
FEM. Figure 2-2 shows the map locations of all the PM2.5 stations in the state, including
the IMPROVE monitor and SPMS (existing stations as well as the six new stations
being established).
Table 2-3. PM2.5 Network and Concentrations for Each MSA
Annual Percent of Daily Percent of
Sampling Design Annual Design 24-Hour
Site AQS No.
Frequency Value (µg/m3) NAAQS Value (µg/m3) NAAQS
2018 – 2020 (12µg/m3) 2018-2020 (35 µg/m3)
Honolulu MSA
Honolulu 150031001 Continuous 3.3 28 7 20
Kapolei 150030010 Continuous 2.6 22 7 20
Pearl City 150032004 Continuous 3.2 27 7 20
Sand Island 150031004 Continuous 3.8 32 7 20
Maui MSA
Kihei 150090006 Continuous 3.9 33 12 34
NOTE: Haleakala IMPROVE (150099001) is the PM2.5 background/transport site for Hawaii and is operated and maintained by the NPS
2021 Annual Network Plan 11 State of HawaiiTable 2-4. PM2.5 Minimum Monitoring Requirements for Each MSA
MSA Population Category Most recent 3-year Design Value Most recent 3-year Design Value
≥85% of any PM2.5 NAAQSFigure 2-2. PM2.5 Network
Background/transport site
2021 Annual Network Plan 13 State of Hawaii2.3 O3 Network
The state must operate a minimum number of O3 monitors depending upon MSA
population and typical peak concentrations. NCore sites are intended to complement
O3 data collection but can be used to meet the minimum monitoring requirements.
The O3 monitoring season for the state of Hawaii is 12-months from January to
December. The O3 design value is the 3-year average of the fourth-highest daily
maximum 8-hour concentrations measured at each monitor.
The most recent O3 design value concentrations at the Sand Island and Kapolei NCore
stations in the Honolulu MSA showed less than 85% of the O3 NAAQS (Table 2-6). The
Maui MSA does not have any O3 monitoring. However, with a 2019 census population
estimated at 167,417, according to 40 CFR Part 58 Appendix D Table D-2 and, as
shown in Table 2-7 below, in the absence of a design value, no O3 monitor is required in
that MSA. The state meets the minimum O3 network monitoring requirements.
Table 2-6. O3 Design Values for the Honolulu MSA
8-Hour 2019 MSA # of Active #
Stations in the Required #
Design Value Census Monitors of Monitors
MSA of Monitors
2018 – 2020 Population in the MSA Needed
Sand Island
0.047
(150031004) 974,563
1 2 0
Kapolei (estimated)
0.048
(150030010)
There is no O3 monitor in the Maui 167,417
0 0 0
MSA (estimated)
Table 2-7. O3 Minimum Monitoring Requirements for Each MSA
Most recent 3-year design value Most recent 3-year design value
MSA Population Category
≥85% of any O3 NAAQSFigure 2-3. O3 Network 2021 Annual Network Plan 15 State of Hawaii
2.4        Pb Network

With a 2010 census population of 953,207 in the Honolulu MSA, the state was
previously required to conduct non-source-oriented Pb monitoring at the Kapolei NCore
site (Table 2-8). This NCore site began collecting Pb data on January 1, 2012.
Appendix D to 40 CFR Part 58 also requires source-oriented Pb monitoring for sources
emitting 0.50 or more tons per year (TPY) according to the most recent emissions
inventory. There are no sources in the state emitting 0.5 or more TPY of Pb. No Pb
monitoring is required in the Maui MSA.

Since the beginning, the station recorded concentrations of Pb well below the standard,
at approximately one to two percent of the standard. Per a letter dated October 29,
2018, EPA approved the discontinuation of the Pb monitoring at the Kapolei NCore
station. Pb monitoring was discontinued on December 31, 2018.

                  Table 2-8.         Minimum Pb Monitoring Requirement at NCore
                                                    2019 Census
                                                                           # Required          # Active         # Monitors
  NCore           AQS ID            CBSA             Population
                                                                            Monitors           Monitors           Needed
                                                     (estimated)
      KA        150030010          Honolulu            974,563                   *0                *0                0
      * Per EPA letter dated October 29, 2018, the Pb monitoring at Kapolei NCore was approved to be discontinued

      2021 Annual Network Plan                                  16                                          State of Hawaii
2.5 CO Network
The state operates two SLAMS and one SLAMS/NCore CO monitors in the Honolulu
MSA. Figure 2-4 shows the locations of the CO sites in the state. 40 CFR Part 58,
Appendix D Section 4.2.2 requires one co-located CO monitor at near-road NO2 sites in
Core-based Statistical Areas (CBSA) with populations ≥1,000,000. The Honolulu MSA
had a 2019 census population estimated at 974,563 and therefore is not currently
required to co-locate a CO monitor. No CO monitoring is required in the Maui MSA.
Figure 2-4. CO Network
2021 Annual Network Plan 17 State of Hawaii2.6 NO2 Network
Near-road NO2 monitoring requirement for CBSAs with a population of greater than
500,000 but less than one million, which includes the Honolulu MSA, has been removed
by EPA as of December 22, 2016. The population and Annual Average Daily Traffic
(AADT) for the Honolulu CBSA will be monitored, and in the event, they hit the minimum
threshold in the future, the near-road monitoring will be implemented.
40 CFR Part 58, Appendix D Section 4.3.3 requires area wide NO2 monitoring in the
location of highest expected concentration in a CBSA with a population ≥1,000,000.
The Honolulu MSA had a 2019 census population estimated at 974,563 and therefore is
not currently required to have area-wide monitoring. DOH will continue to work with
EPA to determine the appropriate timeline associated with this requirement. The state
currently has one SLAMS NO2 station in the MSA which measures typical concentration
in areas of high population density but would also be the location of highest expected
concentration, making it suitable as the area-wide monitoring location. There is one
SPMS on the island of Kauai and no NO2 monitoring is required in the Maui MSA.
Table 2-9. Minimum Near-Road NO2 Monitoring Requirements for the MSA
2019 Census
Max AADT Counts # Required # Monitors to be
CBSA Population
(2019)1 Monitors operational by 1/1/2017
(estimated)
Honolulu 974,563 263,152 0 0
1
2019 estimated average AADT provided by the State of Hawaii Department of Transportation
Figure 2-5. NO2 Network
2021 Annual Network Plan 18 State of Hawaii2.7 SO2 Network
EPA has established the Population Weighted Emissions Index (PWEI) to determine
required SO2 monitoring. The PWEI is calculated by multiplying the population of each
CBSA with the total amount of SO2 in TPY emitted within the CBSA area and dividing
the result by one million. According to this calculation, Hawaii is required to operate one
SO2 monitor in the Honolulu MSA and none in the Maui MSA (Table 2-10). The state
currently operates two SLAMS SO2 monitors in the Honolulu MSA, and one at the
NCore station in Kapolei; it therefore meets the minimum number of required SO2
stations. There are no requirements for a SO2 monitor in the Maui MSA.
The state also has a station on the island of Kauai that monitors for cruise ship
emissions. This is a SPM station which includes FEM monitoring for SO 2, follows all
requirements of 40 CFR 58 Appendices A, D, and E, and as of April 2, 2013, has been
operating for more than 24 months and is eligible for comparison with the NAAQS.
On December 20, 2020, a new volcanic event starts as lava began erupting from inside
Halemaumau Crater at the summit of Kilauea volcano. SO2 emissions from the summit
was estimated at approximately 40,000 tons per day for the first three days after the
eruption began, cut in half to 20,000 tons per day two days later, and dropped again to
5,000 tons per day the very next day. Since February 11, 2021, the emissions
continued to gradually decrease and has steadied to a range from 650 to 1,200 tons per
day. SO2 emissions continues to be a concern on the island of Hawaii due to the
unpredictable potential for significant increase of volcanic emissions at any time. There
are currently six stations monitoring SO2 due to volcanic emissions, two of which are
SLAM stations (Hilo and Kona) and four (Mountain View, Pahala, Ocean View and the
more recently established temporary station at Naalehu) are SPMS that use FEM
monitors and follow all the requirements of 40 CFR 58 Appendices A, D, and E.
Mountain View, Pahala, Ocean View have been operating for more than 24 months and
therefore are subject to NAAQS comparison.
As a part of DOH’s response to the air quality issues caused by the 2018 LERZ eruption
at the Kilauea volcano and due to the continuing volcanic activity on Hawaii Island, the
CAB identified six additional sites/locations for long term monitoring to provide air
quality data, advisories and notification to the public in order to protect their health. The
six sites identified are in the following communities: Waikoloa, Kailua-Kona, Honaunau,
Naalehu, Keaau and Pahoa. Of the six stations Naalehu and Keaau are installed and
operating at temporary locations. Pahoa was shut down on December 20, 2018 and
remains closed.
See Section 2.12 for discussion on site modifications and Section 3.0 for detailed
location information. Figure 2-6 shows the locations of the SLAMS and the three SPMS
stations discussed.
The state is also required by 40 CFR Part 51, Subpart BB, Data Requirements Rule, to
characterize maximum 1-hour ambient concentrations of SO2 through either ambient air
quality monitoring or air quality modeling analysis. The state has two air stations, Kahe
and Waiau, to monitor four sources that has been identified as having SO 2 emissions
data of 2,000 tons or more (see detailed site description for more information). The
start date for these stations began in January 2017 and both have completed the
2021 Annual Network Plan 19 State of Hawaiirequired three years of data collection. After review of the three year of data collected,
it was determined that Waiau met the DRR requirement to shut down.
40 CFR Part 58, 58.14 allows for approvals to be granted when requests to shut down
monitors will not compromise data collection needed for implementation of the NAAQS,
the requirements in 40 CFR Part 58 Appendix D continue to be met, and that specific
criteria for discontinuing monitors operated to satisfy that rule.
DOH’s request to shut down the DRR monitor at Waiau (AQS ID: 15-003-4100), was
submitted to EPA on May 15, 2020 (see Appendix B of this plan) for approval upon the
satisfaction of the specific criteria in 40 CFR Part 51, Subpart BB, 51.1203, Section
(c)(3). In the request, DOH represented the monitors were operated solely for the
purpose of satisfying the 2015 SO2 DRR (80 FR 51052) for the listed DRR source, and
addressed the following:
HECO Waiau Generating Station Valid 3-year Design Value of 16 PPB
In order for EPA to process the request, DOH submitted data to AQS for the specified,
qualifying monitor for CY 2017-2019, and certified the data on April 24, 2020 so that a
design value may be calculated (per 40 CFR Part 50, Appendix T) that meets the
requirements under 40 CFR 51.1203(c)(3). If data collected from the monitor during
either its first or second 3-year period of operation produces a valid design value no
greater than 50% of the NAAQS (which is 37.5 ppb), the monitor is eligible for shut
down so long as it is not: located in an area designated as nonattainment of the 2010
SO2 NAAQS; being used to satisfy other ambient SO2 minimum monitoring
requirements listed in 40 CFR Part 58, Appendix D, section 4.4; or otherwise required
as part of a SIP, permit, attainment plan or maintenance plan.
Pending EPA approval, the DOH intends to shut down the Waiau monitor within the
next 18 months.
Table 2-10. Minimum SO2 Monitoring Requirements
2019 DRR2
Total SO2 # #
Census Sources # Active
CBSA County (tons/year) PWEI1 Required Monitors
Population Using Monitors
2017 NEI Monitors Needed
(estimated) Monitoring
City &
2 SLAMS
County
Honolulu 974,563 13,159 12,824 4 1 1 SLAMS/ 0
of
NCore
Honolulu
Maui Maui 167,417 2,688 450 0 0 0 0
1
According to 40 CFR 58 Appendix D, if the PWEI for a CBSA is ≥ 5,000 but < 100,000, a minimum of one SO 2 monitor is required.
2
Data Requirements Rule for the 2010 1-Hour SO2 Primary NAAQS.
2021 Annual Network Plan 20 State of HawaiiFigure 2-6. SO2 Network 2021 Annual Network Plan 21 State of Hawaii
2.8       NCore

The Kapolei NCore station is located in the residential, commercial, and industrial
community on the southwest side of Oahu. Kapolei is the “second city” next to Honolulu
with county, state and federal agencies having established offices in the area. The
NCore parameters are: NO/NOy, trace-level SO2, trace-level CO, O3, PM10-2.5, PM2.5
speciation and the meteorological parameters wind speed, wind direction, temperature
and relative humidity.

By correspondence dated October 30, 2009, EPA approved Kapolei as the NCore
station and it became fully operational on January 1, 2011.

40 CFR Part 58, Appendix D Section 5 (a) requires the state to collect and report
Photochemical Assessment Monitoring Station (PAMS) measurements at each NCore
site located in a CBSA with a population ≥1,000,000. The Honolulu MSA had a 2019
census population estimated at 974,563 and therefore is not currently required to
operate a PAMS. DOH will continue to work with EPA to determine the appropriate
timeline associated with this requirement.

2.9       H2S Network

The state has a one-hour H2S standard of 25 parts per billion (ppb) established primarily
to determine the effects of geothermal energy exploration and production on the island
of Hawaii. Puna Geothermal Ventures (PGV) is a 41-megawatt geothermal power plant
located in the lower east rift zone of the Kilauea volcano.

DOH established a station at the Leilani Community Association Center, downwind of
the facility, to monitor ambient levels of H2S due to geothermal exploration and
operations. H2S sampling began on September 17, 2019 at a temporary location and
was relocated to its permanent location on the same property on September 18, 2020.

2.10      Site Closures

40 CFR part 58, Appendix A, §2.1.3 states: The PQAO/monitoring organization’s quality
system must have adequate resources both in personnel and funding to plan,
implement, assess, and report on the achievement of the requirements of this appendix
and its’ approved QAPP. The ongoing COVID-19 pandemic’s travel and budget
restrictions resulted in insufficient AQMS resources (staff and equipment) to collect
quality assured, documented and defensible data. Additionally, a Technical Systems
Audit (TSA) conducted by EPA in July 2020 found that “Inadequate resources were
adversely impacting the quality of the data produced by HDOH’s ambient air monitoring
program.”

Therefore, DOH is proposing to address the resource issues by temporarily reducing
the size of the ambient monitoring network (i.e., identify lower-value monitoring sites
and request temporary closure approvals from the EPA) while developing a plan to
acquire additional resources. Factors in the decision to temporarily close certain
stations or parameters include, but are not limited to:

      2021 Annual Network Plan               22                             State of Hawaii
• Ensuring that the remaining monitoring stations in the network continue to meet
or exceeds any minimum requirements for the parameter.
• Ensuring that the purpose or objectives for the monitoring was retained.
• Ensuring that DOH continue to provide useful high-quality data.
• Ensuring that funding or cost savings was considered in temporary closure of a
station or parameter.
As such, after a review of the air monitoring network, the state is requesting to
temporarily close the following stations within the next 18 months; 3-year design values
of each parameter from each station from 2016-2018, 2017-2019 and 2018-2020 are
included in Appendix B of this plan.
2.10.1 Pearl City (150032004) SLAMS
Pearl City, Oahu, Hawaii
Parameters: PM10, PM2.5 and PM2.5 Co-located
This site is located in a commercial and highly populated residential area and has
been operating since 1994. As discussed in Section 2.1 of this plan, PM10 data for
2020 showed the Honolulu MSA to be a low concentration area and, therefore, is
required to have one to two PM10 monitors. The state currently meets the minimum
PM10 monitoring requirements with three PM10 stations in the Honolulu MSA; with
the temporary closure of the Pearl City station, there will be two PM10 stations
remaining in the Honolulu MSA.
As discussed in Section 2.2 of this plan, the most recent 3-year design values in the
Honolulu MSA were less than 85% of any PM2.5 NAAQS and that the state currently
operates 4 PM2.5 monitors in the MSA, more than the minimum 1 monitor required
for the MSA. The co-located FRM PM2.5 sampler currently operated at the site will
be relocated to the Sand Island station.
2.10.2 Kihei (150090006) SLAMS
Kihei, Maui, Hawaii
Parameter: PM2.5
This site was established to monitor the impacts from sugar cane burning and has
been operating since 1999. With the last harvest season occurring in 2016, the
company shut down its sugar cane growing operations, sugar cane is no longer
burned and harvested, therefore monitoring is not necessary at this time. As
discussed in Section 2.2 of this plan, the most recent 3-year design values in the
Maui MSA were less than 85% of any PM2.5 NAAQS and with its smaller population,
no PM2.5 monitor is required for the Maui MSA.
2.10.3 Kahului (150090025) SPMS
Kahului, Maui, Hawaii
Parameter: PM2.5
This site was established to measure typical concentrations of air pollutants in areas
of high population density and has been operating since 2015. No PM2.5 monitor is
required for the Maui MSA.
2021 Annual Network Plan 23 State of Hawaii2.10.4 Niumalu (150070007) SPMS
Niumalu, Kauai, Hawaii
Parameters: NO2, SO2 and PM2.5
This site was established to measure the impacts from cruise ship emissions on
nearby communities and has been operating since April 2011. Since the
implementation of the new lower ECA fuel sulfur requirements for cruise ships, this
station has been providing information on the effects of lowered fuel sulfur on
ambient SO2. SO2 data at this site has consistently showed that although there is a
correlation to the cruise ships being in the harbor and increases in SO2 emissions,
the values have been well below the NAAQS.
NO2 values have also been consistent with the SO2 data in that it has shown that
although there is a correlation to the cruise ships being in the harbor and slight
increases in NO2 emissions, the values have been well below the NAAQS.
As discussed in Section 2.2 of this plan, with its smaller population, there are no
requirement to have a PM2.5 monitor in Kauai. PM2.5 data from this station have also
been well below the NAAQS.
2.10.5 Honaunau (150013032) SPMS
Honaunau, Hawaii
Parameter: PM2.5
This temporary site began sampling in August 2018 to monitor PM2.5 due to volcanic
emissions as a part of DOH’s response to the air quality issues caused by the 2018
LERZ eruption at the Kilauea volcano. The major reason for the request to close
this station is that it will be extremely difficult and costly to obtain electricity to the
monitor. The small rural communities served by the station will still be able to
access data from the Kona and Ocean View stations. There will still be 4 other
PM2.5 monitors remaining on the west side of Hawaii island.
2.10.6 Waiau (150034100)
DRR site, Oahu, Hawaii
Parameter: SO2
As previously discussed in detail in Section 2.7, the Waiau station began collecting
data on January 1, 2017, and since the end of 2019, has completed the required 3
years of data collection. DOH submitted a request to close this station and is waiting
for EPA’s review and approval, this site will continue to operate until approval is
granted.
2.11 Site Additions
There are no plans to add any sites in the next 18 months.
2021 Annual Network Plan 24 State of Hawaii2.12 Site Modifications
2.12.1 Leilani Community Association Center (150012025) SPMS
Pahoa, Hawaii
Parameters: H2S (non-criteria) and SO2
This station was relocated from its temporary location on this property to its current
location and has been operating there since September 20, 2020.
2.12.2 Kapolei (150030010) SLAMS/NCore
Kapolei, Oahu, Hawaii
Parameters: CO and SO2
The 2019 and 2020 network plans both included details regarding the relocation of
the current site to a previously approved area on the same property approximately
50 feet to the south of the current location. DOH has been recently notified by the
City and County of Honolulu Board of Water Supply (BWS), the owner of the
property, that the base yard project for the site is temporarily on hold and a timeline
to move forward has not been determined. Per Region 9, no formal relocation
request is needed if this site is only to be moved a short distance.
As stated previously in Section 2.10 of this plan, the state is proposing to reduce the
size of its air monitoring network. Since trace CO and trace SO2 are required to be
monitored at the NCore station, to reduce duplication, the CO and SO 2 monitors at
the Kapolei SLAMS site can be discontinued without losing any monitoring coverage
in the network.
2.12.3 Sand Island (150031004) SLAMS
Honolulu, Oahu, Hawaii
Parameter: PM2.5 FRM
The PM2.5 FRM sampler that is currently operating at the Pearl City station will be
relocated to the Sand Island station as the state is proposing to temporarily close the
Pearl City Station, as previously discussed in Section 2.10 of this plan.
Carrying over from the 2020 network plan, long-term locations have been selected for
these following sites, where currently the monitors are set up at temporary locations.
Some of these locations do not meet siting guidelines, which is one of the reasons they
will be re-located. Detailed site descriptions are included for four of the five temporary
stations. Pahoa was taken offline due to construction activities.
2.12.4 Keaau (150013027) SPMS; AQS ID for Long-term TBD
Kamehameha Schools Hawaii, Keaau, Hawaii
Parameters: PM2.5 and SO2
This station was selected to be sited in an open area near the Switch Gear Building
on the school campus. AQMS had set up a temporary monitoring station elsewhere
on campus in response to the LERZ emergency, approximately 650 meters to the
northwest of where the long-term station is to be placed. It has been monitoring for
PM2.5 and SO2 as a non-regulatory temporary station since June 14, 2018. AQMS
2021 Annual Network Plan 25 State of Hawaiiwill need to relocate the monitoring equipment to the selected long-term site once
the site is prepped, utilities obtained, and the installation of the monitoring station is
completed.
2.12.5 Naalehu-TP (150013028) SPMS and
Naalehu-TS (150013033) SPMS
Naalehu Volunteer Fire Station and
Naalehu Elementary School, Naalehu, Hawaii
Parameters: PM2.5 and SO2
The United States Geographical Survey Seismograph Building on the Naalehu
school campus was selected to monitor SO2 and PM2.5. The SO2 monitor has been
sampling at this location since September 9, 2018 as a non-regulatory temporary
station. However, AQMS decided to set up the PM2.5 monitor at the Naalehu
Volunteer Fire Station instead of on the school campus; sampling began June 19,
2018 and continues at this temporary location.
Due to the school’s decision to use the building for another purpose, monitoring will
be relocated to another location on school’s campus once an appropriate location is
identified.
2.12.6 Pahoa (AQS TBD)
Pahoa High School, 15-3038 Pahoa Village Road, Pahoa, Hawaii
Parameters: PM2.5 and SO2
The long-term site selected for the monitoring station at the Pahoa school is an open
area behind the school gymnasium. When the 2018 LERZ eruption began,
AQMS had set up a non-regulatory temporary station in another location on campus
to monitored for PM2.5, SO2 and H2S that operated from May 17, 2018 until
December 20, 2018. At the time of this plan’s publication, monitoring at the long-
term location has not been set up and there is currently no monitoring at the Pahoa
school.
2.12.7 Waikoloa-Temporary (150013030) SPMS
Waikoloa Elementary School, Waikoloa, Hawaii and
Waikoloa-Long-term (150012021)
DWS Lalamilo (Parker 610), TMK 3-6-8-002-019, Waikoloa, Hawaii
Parameters: PM2.5
The non-regulatory temporary site for the Waikoloa PM2.5 sampler is located at the
Waikoloa Elementary School has been in operation since June 29, 2018.
The long-term site was selected at a former DOH station (AQS 150012021) which
operated from 2012 to 2014. Since this was a former monitoring location,
installation of the sampler and powering the existing utility pole is all that is required
to complete the reestablishment of this long-term site. Awaiting AQMS to relocate
the temporary monitor to its long-term location.
There are no plans to modify any of the other current sites in the next 18 months.
2021 Annual Network Plan 26 State of Hawaii2.13 Summary of Network and Changes
Table 2-11 summarizes the state’s 2021 network monitors and planned changes. Since
it has been determined that no criteria monitors are currently required in the Maui MSA,
only monitors required for the Honolulu MSA are addressed in the table. Sections 2.10
to 2.12 detail station closures, additions and equipment or network modifications, and is
summarized in Table 2-12.
As indicated in table 2-11, the monitors used for all criteria pollutants are FRM or FEM
and follow the requirements of 40 CFR 58 and Appendices A, C, D, E and G. Hawaii’s
air monitoring network meets or exceeds the minimum required monitoring for each
parameter.
Table 2-11. Number of Monitors by Pollutant or Program
N/A = Not applicable
No. of Total Total Total Meets EPA
Pollutant/ SLAMS Co- in in Required Required Planned Planned
Program Only SPMS SLAMS/NCore located MSA1,2 State2 in MSA1 Minimum? Additions Closures
CO (FRM) 2 0 1 N/A 3 3 N/A N/A 0 1
NO2 (FRM) 1 1 --- N/A 1 2 N/A N/A 0 1
SO2 (FEM) 5 6 1 N/A 3 12 1 YES 1 2
O3 (FEM) 1 0 1 N/A 2 2 1 YES 0 0
NO/NOy N/A N/A 1 (NCore) N/A 1 1 1 YES 0 0
PM10 (FEM) 2 0 1 N/A 3 3 1-2 YES 0 1
PM2.5 (all are 2 FRM
4 12 1 4 173 1 YES 1 4
FEM) 1 FEM
1 (NCore/
PM2.5
0 0 Supplemental N/A 1 1 1 (NCore) YES 0 0
Speciation
Speciation)
PM10-2.5 N/A N/A 1 (NCore) N/A 1 1 1 (NCore) YES 0 0
H2S N/A 14 N/A N/A 0 1 N/A N/A 0 0
1
As promulgated in 40 CFR 58 Appendix D, the minimum monitoring requirements apply to Metropolitan Statistical Areas (MSA).
Currently, only the Honolulu MSA has requirements for minimum criteria pollutant monitoring.
2
Total refers to the number of primary monitors only and does not count co-located monitors.
3
One of the seventeen is using Method 170 and sixteen are using Method 209.
4
The H2S and SO2 monitors were relocated the final selected location on the property of the Leilani Community Association Center;
sampling began on September 20, 2020.
2021 Annual Network Plan 27 State of HawaiiTable 2-12. Summary of Network Changes
Site Affected Reason for
Site AQS ID
Type Parameters Closure/Addition/Modification
City and County of Honolulu
Station proposed for temporary closure:
This site is in a commercial and highly populated
residential area and has been operating since
1994. As discussed in Section 2.1 of this plan,
PM10 data for 2020 showed the Honolulu MSA to
be a low concentration area and, therefore, is
required to have one to two PM10 monitors. The
state currently meets the minimum PM10
monitoring requirements with three PM10 stations
in the Honolulu MSA; with the closure of the
Pearl City station, there will be two PM10 stations
PM10, remaining in the Honolulu MSA.
Pearl City 150032004 SLAMS PM2.5,
PM2.5 FRM As discussed in Section 2.2 of this plan, the
most recent 3-year design values in the Honolulu
MSA were less than 85% of any PM2.5 NAAQS
and that the state currently operates 4 PM2.5
monitors in the MSA, more than the minimum 1
monitor required for the MSA. The co-located
FRM PM2.5 sampler currently operated at the site
will be relocated to the Sand Island station.
To address staffing and resource shortages,
pending EPA approval, this site may be closed
sometime in the next 18 months.
Station to be closed:
This station began collecting data on January 1,
2017, to address the data requirements rule and
DRR/ since the end of 2019, has completed the
Waiau 150034100 SO2
SLAMS required 3 years of data collection. A request for
closure was submitted on May 15, 2020 and
pending EPA data review and approval, this site
may be closed sometime in the next 18 months.
Site modification:
The property where this station is located was
undergoing site renovations and construction to
become a base yard for BWS, the property
owner. Recently BWS notified CAB that the
construction of the base yard and the relocation
All,
Kapolei/ SLAMS/ of the station was on hold until further notice.
150030010 CO,
NCore NCore
SO2
Since trace CO and trace SO2 are required to be
monitored at the NCore station, the CO and SO2
monitors at the SLAMS site can be discontinued
with minimal impact. Upon EPA approval, the
sampling of CO and SO2 at the SLAMS site may
be discontinued within the next 18 months.
Site modification:
Pending EPA approval, the FRM co-located
Sand Island 150031004 SPMS PM2.5 sampler at the Pearl City station will be relocated
to Sand Island as DOH proposes to temporarily
close that station sometime within the next 18
months.
2021 Annual Network Plan 28 State of HawaiiYou can also read