OpenVirtualObjects (OVO): An open set of standardized and validated 3D household objects for virtual reality-based research, assessment, and ...
←
→
Page content transcription
If your browser does not render page correctly, please read the page content below
OpenVirtualObjects (OVO): An open set of standardized
and validated 3D household objects for virtual reality-based
             research, assessment, and therapy.

 Johanne Tromp1,2, Felix Klotzsche1,2, Stephan Krohn2,3, Mert Akbal1,4, Leonardo Pohl5, Eva
                    M. Quinque1,6, Julia Belger1,6, Arno Villringer1,2, Michael Gaebler1,2

     1
         Neurology Department, Max Planck Institute for Human Cognitive and Brain Sciences,
                                                     Leipzig, Germany
 2
     MindBrainBody Institute at the Berlin School of Mind and Brain, Humboldt-Universität zu
                                                  Berlin, Berlin, Germany
                             3
                                 Charité – Universitätsmedizin Berlin, Berlin, Germany
                      4
                          Hochschule der Bildenden Künste Saar, Saarbrücken, Germany
                                      5
                                          Freie Universität Berlin, Berlin, Germany
           6
               Clinic for Cognitive Neurology, University Hospital Leipzig, Leipzig, Germany

                                                  Corresponding authors:
                                             Johanne Tromp, Michael Gaebler
                                      tromp@cbs.mpg.de, gaebler@cbs.mpg.de

Keywords: Virtual Reality, 3D objects, stimuli, database, neuropsychology
2
Abstract
Virtual reality (VR) technology provides clinicians, therapists, and researchers with new
opportunities to observe, assess, and train behaviour in realistic yet well-controlled
environments. However, VR also comes with a number of challenges. For example, compared
to more abstract experiments and tests on 2D computer screens, VR-based tasks are more
complex to create, which can make it more expensive and time-consuming. One way to
overcome these challenges is to create, standardize, and validate VR content and to make it
openly available for researchers and clinicians. Here we introduce the OpenVirtualObjects
(OVO), a set of 124 realistic 3D household objects that people encounter and use in their
everyday lives. The objects were rated by 34 younger and 25 older adults for recognizability,
familiarity, details (i.e., visual complexity), contact, and usage (i.e., frequency of usage in daily
life). All participants also named and categorized the objects. We provide the data and the
experiment- and analysis code online. With OVO, we hope to facilitate VR-based research and
clinical applications. Easy and free availability of standardized and validated 3D objects can
support systematic VR-based studies and the development of VR-based diagnostics and
therapeutic tools.3
Introduction
Virtual reality (VR) technology provides computer-generated content based on a user’s
movement in or interaction with a simulated environment to enable an immersive experience
(Aukstakalnis & Blatner, 1992; Rizzo & Koenig, 2017). In non-immersive VR, users interact
with 3D computer graphics on a 2D screen, while in immersive VR, people are fully
“embedded” in the virtual environment through the use of stereoscopic head-mounted displays
(HMDs) and body-tracking sensors.
For users, VR enables interactive, immersive experiences. For clinicians and researchers,
VR provides new opportunities to observe, assess, and train behaviour in realistic environments
and with new measures, for example, to treat phobias (e.g., Morina et al., 2015), post-traumatic
stress disorder (e.g., Rizzo et al., 2010), or to rehabilitate attention, memory, and motor and
spatial skills (for an overview, see Rizzo & Koenig, 2017). In a recent overview of VR-based
solutions for the diagnostics and therapy of neurological diseases, Słyk and colleagues (2019)
argue that although VR is still relatively understudied, it is making visible progress.
VR can provide tailored trainings for different patient groups or even individual patients in
controlled environments that resemble the everyday life of patients. Classical diagnostics and
therapies often lack this resemblance or only achieve it at high costs. For example, spatial
memory (i.e., the capacity to recognize or recall relationships between objects in space) is often
assessed with paper-and-pencil tests like the Rey-Osterrieth Complex Figure Test (ROCF), in
which participants have to copy a complex line drawing and recall it from memory (Rey, 1941;
Osterrieth, 1944). In fundamental research, the mechanisms of working memory are regularly
investigated with tasks in which participants have to memorize abstract shapes presented on a
computer screen (e.g., Brady et al., 2016). Although many classical paradigms rely on
controlled, de-contextualized environments and stimuli, clinicians and researchers did develop
realistic tasks and experiments to study the behaviour of patients and participants in everyday
life situations: In the cooking task, for example, patients are asked to prepare a dish in a real
kitchen in the clinic, while the therapist continuously monitors their performance (e.g., Frisch
et al., 2012). However, these tasks are costly and time-consuming, because the therapist has to
be present at all times and the real-life environment has to be physically built or made available.
In addition, they often lack the experimental control necessary for systematic and reproducible
results, and they often do not allow for automatic (i.e., experimenter-independent) multi-
dimensional data collection.
VR could bridge the gap between the laboratory (i.e., systematic and controlled
environments and tasks) and everyday life (i.e., natural situations and behaviour). It allows for4 the systematic delivery of realistic yet well-controlled stimuli, real-time performance feedback, and a safe testing or training environment. From a clinical perspective, patients can also independently practice skills in a controlled environment outside the clinic and ideally at home (Rizzo & Koenig, 2017). An example of a successful clinical VR application is VR exposure therapy (VRET), in which “in virtuo” exposure can lead to changing one’s behaviour in real- life situations (Howard, 2017; Morina et al., 2015). Furthermore, executive functions, the higher-order cognitive processes required for performing complex tasks, have been assessed in healthy individuals and patients using action planning tasks in a virtual supermarket (Josman et al., 2008). VR provides precise outcome measures (e.g., information about the location and position of the head or other body parts), interactive dynamic experimental paradigms (e.g., using controllers or other methods for interaction with the environment) as well as high- resolution stimuli that can be completely controlled and easily matched for certain properties (e.g., colour, size). Using stimuli with heightened realism, it has been shown that people can store more real-world objects (e.g., bell, cookie) than abstract shapes (e.g., squares varying in colour and orientation) in memory, and they do so with more detail (Brady et al., 2016). This suggests that working memory capacity has been systematically underestimated in studies that used simple stimuli about which we have no previous knowledge. In addition, VR has been used to study spatial memory (e.g., Koenig et al., 2011), and it can be combined with neurophysiological measures such as electroencephalography (e.g., Klotzsche et al., 2018; Tromp et al., 2018). Although VR is a promising tool for research and clinical applications, it also has several disadvantages, and its use comes with several challenges. While the price of VR hardware (e.g., commercial HMDs like the Oculus Quest) has dropped substantially, it is still rather expensive and time-consuming to develop VR-based experiments and applications. There is little VR content freely available that is suitable for experimental research and clinical applications, and the content that is available commonly lacks the empirical validation warranted to ensure scientific rigor. For example, VR content that is designed for entertainment or educational purposes is often not suitable for research, because stimulus properties are not matched or the experience cannot be modified to fit specific research questions. In addition, after a VR-based experiment has been successfully designed, the additional dimensions of behavioural assessment increase the number and complexity of outcome measures – and thereby the “researcher degrees of freedom” (Simmons et al., 2011) – even more than in classical (computerized) tasks in the psychological and biomedical sciences (Ioannidis, 2005). This is especially problematic for the comparison of performance between different VR paradigms or
5

therapies, since even if the task is the same, there are many aspects of the VR experience (e.g.,
the environment, the interaction) that can cause different outcomes. To resolve some of these
issues, our group, in previous research, presented a new framework, ‘the VR-check’. This
framework can be used to aid systematic and comparative paradigm optimization in VR-based
research on the basis of several dimensions; including cognitive domain specificity, ecological
relevance, technical feasibility, user feasibility, user motivation, task adaptability, performance
quantification, immersive capacities, training feasibility, and predictable pitfalls (Krohn et al.,
2020).
   To further advance the standardization of VR-based experiments and applications (e.g., for
diagnostics and training) and to reduce the costs of VR-based research, we created
OpenVirtualObjects (OVO). OVO is a freely available set of 124 realistic 3D household objects
for VR-based research and clinical applications (e.g., diagnostics and rehabilitation). The
objects in the database were rated by younger and older adults on the dimensions of
recognizability, familiarity, details (i.e., visual complexity), contact, and usage (i.e., frequency
of usage in daily life). Participants also categorized and named the objects.
   OVO complements existing databases with 3D objects: For example, bigBIRD (Singh et al.,
2014) contains 100 high-quality objects and is mostly targeted at computer vision researchers,
but it does not contain norms relevant for experimental and clinical use. Also, Popic and
colleagues (2020(Popic et al., 2020)) provided a database of 121 objects normed for name,
familiarity and visual complexity. Finally, Peeters (2018) provides a standardized set of 147
3D objects (e.g., bike, table) normed by younger adults for name agreement, image agreement,
familiarity, and visual complexity. Names and lexical characteristics of the names are also
described. The OVO objects complement these data sets because they were specifically selected
and rated for their appearance in everyday life (i.e., household environments), and they were
rated on these properties by both younger and older adults. The selection of objects in OVO
aimed to increase the personal relevance of the objects – to maximize the link between the VR-
based experiments or applications and everyday life.
   In this paper, we describe how the objects were created and validated. We provide
descriptive statistics as well as information on the relations between the norms, and we present
the naming and category data for the objects. We also compare the norms to other databases.
Our goal is to provide clinical and fundamental research community with a validated resource
for their own VR-based applications as well as their intended sample.
6

                                              Methods
Participants
   Thirty-four younger (19 females; mean age: 28±4.6; range 20-38 years) and 25 older adults
(14 females; mean age: 70±5.0; range 62-82 years) participated in the study. The data from 3
subjects was discarded due to red-green blindness, early termination of the experiment, or
technical difficulties. All participants were native speakers of German, right-handed, and had
normal or corrected-to-normal vision. They provided written informed consent and were paid
for participation (9 €/hour). Ethical approval was granted by the ethics committee of the
Psychology Dept. at the Humboldt-Universität zu Berlin.

Materials
   As the basis, 124 copyright-free (CC-Zero) 3D objects were downloaded from open
platforms (e.g., www.blendswap.com). Selection criteria were (1) inanimateness and (2)
occurrence in household settings. A professional visual artist (Mert Akbal) edited the objects
using Blender version 2.79 (www.blender.org). The goal was to create a homogenous set of
objects with less than 20,000 vertices each and with minimal differences in size and other salient
features. Some object types (e.g., bottle, orange) appeared more than once (in different versions)
in the initial data set so that after the rating, the best version of the object could be selected. All
objects (124) in OVO are freely available (in .blend and .fbx format) online. In an additional
set, the objects were revised to facilitate usage in a real-time interactive VR experience by
reducing the number of vertices. The high-poly versions have 10,000-20,000 and the “low-
poly” versions have
7
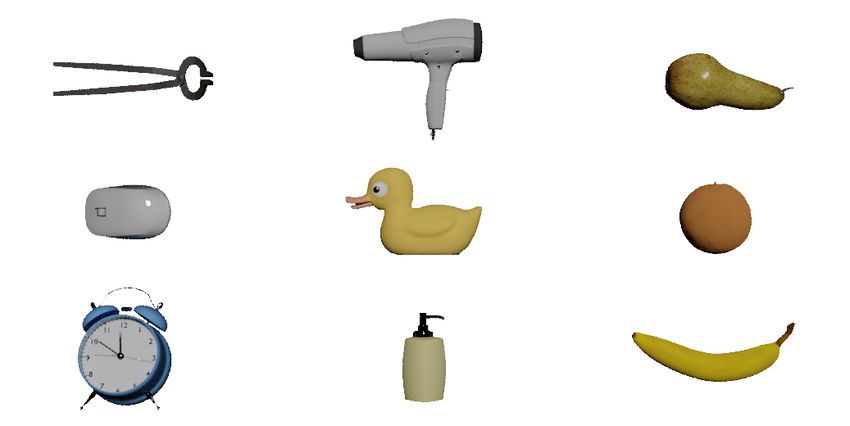
Fig 1. Nine example 3D household objects from the freely available OpenVirtualObjects
(OVO). https://edmond.mpdl.mpg.de/imeji/collection/7L7t07UXD8asG_MI
Apparatus
The experiment was created in Unity version 2017.4.5 (www.unity.com), exported as a
Linux standalone build, and run under Ubuntu 18.04 on desktop computers. Participants were
seated 55 cm in front of a 22-inch computer screen (EIZO S2202W) with a 1680 x 1050-pixel
resolution. The Unity code for the rating experiment is available in the OVO database to
facilitate the collection of additional ratings or to run rating studies for new objects.
Procedure
All ratings and names were collected in one experimental session. Before the experiment
started, participant provided informed written consent. Participants were instructed that they
would see several objects, which they should rate and name. The experiment consisted of five
‘scenes’, or phases, per object.
1) A randomly selected object rotated on a table around its central vertical axis with a speed
of 60° per second for 8 seconds, so that all sides of the object were seen.
2) Participants rated, by means of a slider on the screen, how well they recognized the object
(1 = not well; 100 = very well). Then they typed the name of the object and indicated
how certain they were of the name (1 = not certain, 100 = very certain). If they did not
know the name, they typed “11” and if they did not recognize the object, they typed “00”
for the name of the object and the certainty ratings were ignored.8
3) Participants selected the most appropriate category for the object from ten categories:
clothes; cosmetics; cutlery and dishes; decoration; food; office supplies; tools; toys;
kitchen utensils; unknown. They also rated how well the object fit the chosen category
(1 = not at all; 100 = very well).
4) Participants rated how familiar the object was to them (1 = not familiar; 100 = very
familiar) and how detailed (visually complex) it appeared to them (1 = not very detailed;
100 = very detailed).
5) Participants rated how often they encounter the object at home (“contact”) and how often
they use the object at home (i.e. “usage”), also on scales from 1 (never) to 100 (very
often).
Before the actual experiment, participants were presented with five practice scenes, in which
one object (a pineapple) was rated, which is not part of OVO. The objects were presented in
four blocks of 31 objects each. Between each block, participants were asked to take a break for
at least one and maximum five minutes. The experiment took 75 minutes on average. Apart
from the object in the practice trial, object presentation was randomized using the
"Random.Range" function in Unity so that numbers (corresponding to individual objects) were
chosen with equal probability from a finite set of numbers.
Analysis
Descriptives: The mean, standard deviation (SD), median, minimum and maximum were
calculated for each dimension (Recognizability, Familiarity, Details, Contact, Usage).
Normality was tested with Shapiro-Wilk tests. Non-parametric (Spearman’s rank) correlations
were used to calculate correlation coefficients between the dimensions. Adjustment for multiple
comparisons was implemented using Holm’s method.
Object names: For the naming data, we calculated the name agreement (NA, in %) and the
H-statistic (Snodgrass & Vanderwart, 1980). The two categories of naming failures (“11” if
they did not know the name, “00” if they did not recognize the object) were excluded from the
analysis. Misspellings were included as the correctly spelled name and elaborations (e.g., halbes
Brot [‘half bread’], Haarkamm [‘hairbrush’]) were counted as separate names. If participants
wrote down two distinct names for an object, only the first one counted. The NA is the
percentage of people that produced the modal name (i.e., the name given by the majority of
participants). The H-statistic is a different measure, which takes into account the frequency
distribution of the given names as well as number of alternative names. An object that was
given the same name from every participant in the sample would have an H-value of 0.00. An9
object that elicited two different names with exactly the same frequency would have an H-value
of 1.00. That is, the larger the H-value, the smaller the name agreement (Snodgrass &
Vanderwart, 1980). For a follow-up analysis, we additionally calculated the modal name per
object and then grouped all words that literally contained the modal name before recalculating
the H-statistic and the NA.
Object categories: For the semantic category analysis, we categorized the object based on
which category was most often chosen by the participants (for the younger and older adults
separately). Objects could only be assigned to one category. We calculated the number of
objects that were attributed to the given category and the percentage of agreement (i.e., the
percentage of participants that chose the objects in the category as belonging to that category).
So, if a given category has two objects A and B and for object A 90% of participants said the
items belonged to this category and for object B 60% put the item in this category, the average
agreement for the category will be 75%. Note that for some objects (e.g., apple), several
versions were rated, which will increase the number of objects in that category (e.g., food).
Comparison to other databases: For comparison and to facilitate the pooling of objects, we
provide the mean ratings across objects in our database together with those of two other 3D
object (Peeters, 2018; Popic et al., 2020) and three coloured-photograph databases (Adlington
et al., 2009; Brodeur et al., 2010; Moreno-Martínez & Montoro, 2012). The common
dimensions were the H-statistic (H), the NA (in %), Familiarity, and Details. Since for
Familiarity and Details, our objects were rated on a sliding scale from 1 to 100 and the other
databases used a 5-point scale, we divided our scores by 20. We acknowledge that rating on a
scale from 1 to 100 is different from rating on a 5-point scale, thus we only report these
measures and do not perform any statistical analyses.
Results
The summary statistics for the collected norms (Recognizability, Familiarity, Details,
Contact, and Usage) are presented in Table 1 for the younger and older adults separately. The
Shapiro-Wilk tests showed that the data were not normally distributed for the younger nor for
the older adults (all p-values < .05). Fig. 2 displays the ratings for each of the norms for the
younger adults, the older adults, and the complete sample.10
Table 1 Summary statistics for all dimensions
Recog Fam Details Contact Usage
Y O Y O Y O Y O Y O
M 83.15 86.65 78.09 85.17 59.39 64.53 51.66 64.60 44.95 60.08
SD 17.64 14.41 14.73 14.92 18.14 16.32 24.09 25.97 24.66 26.88
Median 90.44 91.88 79.94 89.12 62.71 68.20 54.71 69.64 42.74 60.08
Min 25.03 22.12 29.85 16.64 15.18 14.16 2.24 2.24 1.06 1.12
Max 99.68 98.36 99.50 99.64 86.11 91.00 95.06 99.16 94.47 99.60
Note. Y, Younger Adults; O, Older Adults; Recog, Recognizability; Fam, Familiarity
Fig. 2 Boxplots with individual data points for the object ratings for the entire sample (red) and
per age group (older: white, younger: blue) per dimension (1 = not, 100 = very). The horizontal
line represents the median.11
Correlation analysis
To explore the relationships between the different dimensions, Spearman correlation
analyses (Holm-corrected for multiple comparisons) were used (Table 2). For both samples,
there were significant correlations between Contact and Usage, between Familiarity and
Contact, and between Familiarity and Usage. Also, there was a positive correlation between
Details and Recognizability for both age groups. For the older but not for the younger adults,
Recognizability and Usage were significantly correlated.
Table 2 Correlation matrix for the younger (upper panel) and older (lower panel) adults
Recog Fam Details Contact Usage
Recog 1.00
Fam 0.69*** 1.00
Details 0.75*** 0.48*** 1.00
Contact 0.22 0.75*** 0.00 1.00
Usage 0.16 0.70*** -0.06 0.99*** 1.00
Recog Fam Details Contact Usage
Recog 1.00
Fam 0.71*** 1.00
Details 0.76*** 0.56*** 1.00
Contact 0.36*** 0.80*** 0.15 1.00
Usage 0.31** 0.77*** 0.11 0.98*** 1.00
Note. Recog, Recognizability; Fam, Familiarity; *p(corr) < .05, **p(corr) < .01, ***p(corr) <
.001 (multiple comparisons-corrected using Holm’s method).
Object names
The percentage of “no recognition” responses (i.e., “I do not recognize the object”, coded as
“00”) was 2.56 % for the younger and 2.47 % for the older adults. The amount of “no name”
responses (i.e., “I do not know the name of the object”, coded as “11”) was 1.91 % for the
younger and 1.43 % for the older adults.
The mean H-statistic for the younger adults was 1.86 (SD = 1.09) and the average NA was
59.36 % (SD = 25.72 %). For the older adult sample, the mean H-statistic was 2.12 (SD = 1.04)
and the average NA was 52.02 % (SD = 24.31 %). The H-statistic, modal names, NA, and the
percentage of “no recognition” (“00”) and “no name (“11”) responses per object can be found
in the online database (for the complete sample and separately for younger and older adults). In
the follow-up analysis, grouping together all names that contained the modal name, the mean12
H-statistic was 1.28 (SD = 1.11) and the average NA was 72.76 % (SD = 25.19 %) for the
younger adults. For the older adult sample, the mean H-statistic was 1.60 (SD = 1.19) and the
average NA was 63.98 % (SD = 27.64 %).
Object categories
Table 3 shows the distribution of objects over the semantic categories. “cosmetics" was the
category with most objects and “toys” with the least objects for both age groups. The objects in
the “toys” and “food” categories were most consistently (i.e., by the largest number of people)
categorized. Numerically, the younger adults categorized more objects as “unknown” than the
older adults.
For each object, we provide the modal category, what percentage of participants chose this
category (i.e., the percentage of agreement for this category), and which other categories were
chosen. We also provide data per object on how well the objects fit the chosen category in the
database online (1 = not at all; 100 = very well).
Table 3 Distribution of objects over the categories for younger and
older adults
Younger Older
Category count % agree count % agree
Clothes 9 82.68 8 80.50
Cosmetics 25 80.24 23 82.56
Decoration 14 74.16 15 72.00
Dishes/cutlery 8 69.85 8 70.00
Food 18 95.92 18 92.44
Kitchen supplies 12 69.36 15 69.60
Office supplies 10 77.35 9 80.44
Tools 12 80.64 15 71.20
Toys 6 83.82 6 92.67
Unknown 9 43.14 6 47.33
Comparison to other databases
Table 5 presents the comparison of ratings to other databases. The mean familiarity for OVO
was numerically comparable to the norms of Brodeur et al. (2010) and slightly higher than the
other databases (i.e., Adlington et al., 2009; Moreno-Martínez & Montoro, 2012; Peeters, 2018;13
Popic et al., 2020). The average visual complexity as well as the H-statistic were higher for
OVO compared to the other databases while the NA was lower.
Table 4 Overview of the standardized measures from the 3D objects in OVO (complete sample)
and comparable databases.
N Fam Details H NA (%)
OVO 123 4.05 3.08 2.26 54.88
Popic et al. (2020) 121 4.37 2.42 / 74.00
Peeters (2018) 147 3.20 2.69 1.05 74.99
Moreno-Martinez and Montero (2012) 360 3.56 2.55 0.94 72.00
Brodeur et al. (2010) 480 4 2.4 1.65 64.00
Adlington et al. (2009) 147 3.76 2.89 1.11 67.61
Mean ratings for familiarity, details (visual complexity) and name agreement. N, number of
items; Fam, Familiarity; H, H-statistic; NA, name agreement.14
Discussion
To support VR-based research, assessment, and therapy, we created OpenVirtualObjects
(OVO), a freely available set of 124 standardized 3D household objects, rated by healthy
younger and older adults. In this paper, we provided summary statistics and correlation
coefficients of these ratings as well as naming and sematic category information. We also
compared a selection of the norms with those of five existing databases that include 3D objects
or colored photographs (i.e., Adlington et al., 2009; Brodeur et al., 2010; Moreno-Martínez &
Montoro, 2012; Peeters, 2018; Popic et a., 2020).
Recognizability ratings were generally high for both age groups, suggesting that the objects
can be recognized well by both age groups. Familiarity ratings suggest that both groups were
used to (most of) the objects. The ratings for contact and usage showed a larger variance,
suggestion that OVO contains objects that people frequently encounter or use in their
households and objects they do not encounter or use often.
Although we did not statistically compare them, it should still be noted that, numerically,
older adults gave higher ratings than younger adults across the dimensions. It is difficult to
disentangle whether this relates to a general effect of age group on the use of the rating scale or
whether older adults really perceived the objects to be more recognizable, familiar, and visually
complex than the younger adults – or, for contact and usage, whether older adults indeed come
into contact and use the objects more frequently than younger adults. In other types of ratings,
older adults were shown to give more extreme ratings than younger adults, for example for
valence and arousal ratings of pictures (Grühn & Scheibe, 2008). In general, we advise OVO
users to select objects based on the ratings from the age group that best resembles their target
population.
The correlation analysis revealed that especially the dimensions contact and usage are highly
correlated for both samples. This indicates that the items that participants often came into
contact with, they also used often and vice versa, or that these dimensions measure the same
item property. The positive correlation between details and recognizability suggests that objects
with more details (i.e., higher visual complexity) were recognized better. This suggests for VR-
based studies that the quality of the stimulus in VR, in our case the objects, is related to the
recognizability of the object. Thus, for tasks that require the recognition of objects, researchers
should aim to use as high-quality representations of VR objects as possible (e.g., given
limitations in PC memory).15 The category data revealed that most objects could be categorized within the pre-determined categories, which covered large parts of the household (e.g., kitchen supplies, tools, food, cosmetics). OVO users can pick and choose particular categories to use the objects with the highest norms relevant to their research goals. Of note, the category “toys” is particular, as it contains miniature versions of non-household objects (e.g., a train). Outside the (virtual) household setting or context, it might not be clear that these items are toys. The database comparison showed that the familiarity ratings for OVO were comparable to or higher than for the other databases (i.e., Adlington et al., 2009; Brodeur et al., 2010; Moreno- Martínez & Montoro, 2012; Peeters, 2018; Popic et a., 2020). This emphasizes the complementarity or additional usefulness of OVO. Visual complexity was rated higher in OVO than in the other databases. This could be because 3D objects are often more complex than 2D images. However, OVO visual complexity ratings were also higher than those in Peeters (2018), even though these were rated in immersive VR. Researchers and clinicians should take the complexity ratings into account, especially for studies in which the visual properties of the stimuli have to be strictly controlled. Future studies will have to address the differences in visual complexity ratings between 2D and 3D objects, and the properties that contribute to visual complexity of 3D objects. The H-statistic was higher and the NA was lower for OVO than for the other databases, suggesting less uniform naming behaviour for the OVO objects. The strong variance in these statistics across OVO objects could be because, for some objects, participants entered detailed descriptions with only fine-grained deviations (e.g., mechanischer Wecker [‘mechanical alarm clock’] and Analogwecker [‘analogue alarm clock’]). To facilitate the comparison with the other databases, we treated these elaborations as distinct names in our main analysis. However, such strict conventions may not be necessary or appropriate for all studies using the OVO objects. In a follow-up analysis, we grouped all names that literally contain the modal name (i.e., summarized all elaborations under the modal name) and found that the resulting H- statistics and NA were in the range of those reported for other databases. For many studies such an account should be sufficient to ensure that an object was recognized as belonging to the concept described by the modal name. For researchers that require exact naming distinctions and high levels of name agreement, we suggest to filter the OVO database by defining a threshold for the H-statistic or the percentage of name agreement. We provide data and R script templates to perform such operations. In sum, we provide a set of 3D objects that are recognizable and familiar to both older and younger adults. Our set includes a variety of validated objects that are often encountered and used in a household setting. Various categories of household objects are represented in the
16

database and the familiarity scores are comparable to those of other databases. We invite
researchers and clinicians to choose their own set of objects based on the norms, age of the
rating group, and other properties that are most relevant for their purposes. We also provide all
scripts of the analyses described in this paper in the online database, so that users can easily
tailor the analyses to their needs and select the most appropriate set of objects.
   Although this database can provide a step forward in the standardization and optimization
of VR-based experimentation, it also has limitations. The rating study was conducted with
German participants, so the data might not be representative for other cultural settings (e.g.,
non-European). Also, it was done in 2D on a computer screen rather than in a fully immersive
VR environment. Thus, although the objects were 3D representations (and not pictures), they
were presented (rotating) in 2D. We chose this procedure for pragmatic reasons, namely to
increase the number of participants while still collecting all norms for all objects from each
participant. Furthermore, we wanted to ensure that the norms are not limited to a specific VR
headset (e.g., the Oculus Rift or the HTC Vive). We also did not systematically test for usability
of the objects in interactive, real-time applications. Some of the rated objects have a high
number of vertices, which increases the level of detail and the naturalistic look of the objects
but might lead to computational challenges in interactive and real-time scenarios. This will, to
a great extent, depend on the specific implementation and the hardware used and should be
tested during early stages of task development. As a first step to alleviate this challenge, we
also provide “low-poly” versions (< 10,000 vertices) of all the objects. It should be noted that
these were not part of the participant ratings we present above and that, despite the lowered
vertex counts, these objects might still be too graphically expensive for some tasks and
hardware setups. For future research, it would be beneficial to collect more norms using
immersive and interactive VR or to explicitly compare screen and HMD norms as well as high-
and low-poly versions of the same objects. These studies could be conducted with the Unity
code and the object versions provided in the database. Another limitation is that, in contrast to
Peeters (2018), we did not collect image agreement scores (i.e., scores of how well the object
fits the modal name it was given). Again, this was a pragmatic decision to reduce experiment
time and these norms can be easily collected with the existing experiment code, by providing
the modal names collected in OVO together with the objects, to a new group of participants.

                                           Conclusion
   VR provides new opportunities for researchers and clinicians to create realistic yet controlled
experiments and applications. However, it remains expensive and time-consuming to develop
and standardize VR content, which is necessary for reliable and replicable results obtained in
17
VR. In this paper, we presented OVO, a freely available set of 124 realistic 3D household
objects for VR-based testing, training, clinical diagnostics, and rehabilitation. Based on ratings
by healthy younger and older adults, we provide norms of recognizability, familiarity, visual
complexity, contact, and usage in daily life. We also report naming and category information.
All objects, data, and scripts (analysis and testing) are freely available online
(https://edmond.mpdl.mpg.de/imeji/collection/7L7t07UXD8asG_MI). We hope that the objects in
this database are useful in experimental, educational, and clinical settings – or in other situations
that require standardized 3D stimuli. We invite researchers to select objects according to their
research questions and target populations and to add more objects or norm values to the
database whenever possible. By creating and sharing high-quality, freely available VR content,
we can increase the amount and quality of VR-based experimental research and clinical
applications.
Data availability and ethics
The data supporting the conclusions of this article will be made available by the authors, without
undue reservation. The experiment code and dataset for this study can be found in the OVO
database (https://edmond.mpdl.mpg.de/imeji/collection/7L7t07UXD8asG_MI) and the analysis code
can be found on the OVO Gitlab (https://gitlab.gwdg.de/johanne.tromp01/ovo_analysis).
Written informed consent was obtained from the individual(s) for the publication of any
potentially identifiable images or data included in this article.
Author Contributions
JT, FK, SK, MA, EQ, JB looked for objects and JT, FK, SK, MG, EQ, JB designed the
experiment. LP, MA programmed and conducted the experiment. The analysis was done by
JT, FK, MG, LP and JT, FK, MG wrote the manuscript.
Funding
This project was funded by a grant (BMBF grant 13GW0206) from the German Federal
Ministry for Education and Research for the research consortium VReha – Virtual worlds for
digital diagnostics and cognitive rehabilitation.18
Acknowledgments
We would like to thank all members of the VReha team, including Paul Chojecki, Cade
McCall, Carsten Finke, and Angelika Thöne-Otto for their valuable input during the meetings
of the VReha - Virtual worlds for digital diagnostics and cognitive rehabilitation consortium.
References
Adlington, R. L., Laws, K. R., & Gale, T. M. (2009). The Hatfield Image Test (HIT): A new
picture test and norms for experimental and clinical use. Journal of Clinical and
Experimental Neuropsychology, 31(6), 731–753.
https://doi.org/10.1080/13803390802488103
Aukstakalnis, & Blatner. (1992). Silicon mirage; the art and science of virtual reality.
Peachpit Press.
Brady, T. F., Störmer, V. S., & Alvarez, G. A. (2016). Working memory is not fixed-capacity:
More active storage capacity for real-world objects than for simple stimuli.
Proceedings of the National Academy of Sciences, 113(27), 7459–7464.
https://doi.org/10.1073/pnas.1520027113
Brodeur, M. B., Dionne-Dostie, E., Montreuil, T., & Lepage, M. (2010). The Bank of
Standardized Stimuli (BOSS), a New Set of 480 Normative Photos of Objects to Be
Used as Visual Stimuli in Cognitive Research. PLoS ONE, 5(5), e10773.
https://doi.org/10.1371/journal.pone.0010773
Frisch, S., Förstl, S., Legler, A., Schöpe, S., & Goebel, H. (2012). The interleaving of actions
in everyday life multitasking demands. Journal of Neuropsychology, 6(2), 257–269.
https://doi.org/10.1111/j.1748-6653.2012.02026.x
Grühn, D., & Scheibe, S. (2008). Age-related differences in valence and arousal ratings of
pictures from the International Affective Picture System (IAPS): Do ratings become
more extreme with age? Behavior Research Methods, 40(2), 512–521.
https://doi.org/10.3758/BRM.40.2.512
Howard, M. C. (2017). A meta-analysis and systematic literature review of virtual reality
rehabilitation programs. Computers in Human Behavior, 70, 317–327.
https://doi.org/10.1016/j.chb.2017.01.013
Ioannidis, J. P. A. (2005). Why Most Published Research Findings Are False. PLoS Medicine,
2(8), e124. https://doi.org/10.1371/journal.pmed.002012419
Josman, N., Klinger, E., & Kizony, R. (2008). Performance within the virtual action planning
supermarket (VAP-S): An executive function profile of three different populations
suffering from deficits in the central nervous system. 7.
Klotzsche, F., Mariola, A., Hofmann, S., Nikulin, V. V., Villringer, A., & Gaebler, M. (2018).
Using EEG to Decode Subjective Levels of Emotional Arousal During an Immersive
VR Roller Coaster Ride. 2018 IEEE Conference on Virtual Reality and 3D User
Interfaces (VR), 605–606. https://doi.org/10.1109/VR.2018.8446275
Koenig, S. T., Crucian, G. P., Dünser, A., Bartneck, C., & Dalrymple-Alford, J. C. (2011).
Validity evaluation of a spatial memory task in virtual environments. 13.
Krohn, S., Tromp, J., Quinque, E. M., Belger, J., Klotzsche, F., Rekers, S., Chojecki, P., de
Mooij, J., Akbal, M., McCall, C., Villringer, A., Gaebler, M., Finke, C., & Thöne-
Otto, A. (2020). Multidimensional Evaluation of Virtual Reality Paradigms in Clinical
Neuropsychology: Application of the VR-Check Framework. Journal of Medical
Internet Research, 22(4), e16724. https://doi.org/10.2196/16724
Moreno-Martínez, F. J., & Montoro, P. R. (2012). An Ecological Alternative to Snodgrass &
Vanderwart: 360 High Quality Colour Images with Norms for Seven Psycholinguistic
Variables. PLoS ONE, 7(5). https://doi.org/10.1371/journal.pone.0037527
Morina, N., Ijntema, H., Meyerbröker, K., & Emmelkamp, P. M. G. (2015). Can virtual
reality exposure therapy gains be generalized to real-life? A meta-analysis of studies
applying behavioral assessments. Behaviour Research and Therapy, 74, 18–24.
https://doi.org/10.1016/j.brat.2015.08.010
Osterrieth, P. A. (1944). Le test de copie d’une figure complexe; contribution à l’étude de la
perception et de la mémoire. [Test of copying a complex figure; contribution to the
study of perception and memory.]. Archives de Psychologie, 30, 206–356.
Peeters, D. (2018). A standardized set of 3-D objects for virtual reality research and
applications. Behavior Research Methods, 50(3), 1047–1054.
https://doi.org/10.3758/s13428-017-0925-3
Popic, D., Pacozzi, S. G., & Martarelli, C. S. (2020). Database of virtual objects to be used in
psychological research. PLOS ONE, 15(9).
https://doi.org/10.1371/journal.pone.0238041
Rey, A. (1941). L’examen psychologique dans les cas d’encéphalopathie traumatique. (Les
problems.). [The psychological examination in cases of traumatic encepholopathy.
Problems.]. Archives de Psychologie, 28, 215–285.20
Rizzo, A. “Skip,” Difede, J., Rothbaum, B. O., Reger, G., Spitalnick, J., Cukor, J., & Mclay,
R. (2010). Development and early evaluation of the Virtual Iraq/Afghanistan exposure
therapy system for combat-related PTSD. Annals of the New York Academy of
Sciences, 1208(1), 114–125. https://doi.org/10.1111/j.1749-6632.2010.05755.x
Rizzo, A. “Skip,” & Koenig, S. T. (2017). Is clinical virtual reality ready for primetime?
Neuropsychology, 31(8), 877–899. https://doi.org/10.1037/neu0000405
Simmons, J. P., Nelson, L. D., & Simonsohn, U. (2011). False-Positive Psychology:
Undisclosed Flexibility in Data Collection and Analysis Allows Presenting Anything
as Significant. Psychological Science, 22(11), 1359–1366.
https://doi.org/10.1177/0956797611417632
Singh, A., Sha, J., Narayan, K. S., Achim, T., & Abbeel, P. (2014). BigBIRD: A large-scale
3D database of object instances. 2014 IEEE International Conference on Robotics and
Automation (ICRA), 509–516. https://doi.org/10.1109/ICRA.2014.6906903
Słyk, S., Zarzycki, M. Z., Kocwa-Karnaś, A., & Domitrz, I. (2019). Virtual reality in the
diagnostics and therapy of neurological diseases. Expert Review of Medical Devices,
16(12), 1035–1040. https://doi.org/10.1080/17434440.2019.1693892
Snodgrass, J. G., & Vanderwart, Mary. (1980). A standardized set of 260 pictures: Norms for
name agreement, image agreement, familiarity, and visual complexity. - PsycNET.
/doiLanding?doi=10.1037%2F0278-7393.6.2.174
Tromp, J., Peeters, D., Meyer, A. S., & Hagoort, P. (2018). The combined use of virtual
reality and EEG to study language processing in naturalistic environments. Behavior
Research Methods, 50(2), 862–869. https://doi.org/10.3758/s13428-017-0911-9You can also read