QTL Mapping of Fruit and Seed-related Traits in Watermelon Using Genotyping-by-Sequencingbased High-density Linkage Mapping
←
→
Page content transcription
If your browser does not render page correctly, please read the page content below
QTL Mapping of Fruit and Seed-related Traits in
Watermelon Using Genotyping-by-Sequencing-
based High-density Linkage Mapping
Meiling Gao ( gaomeiling0539@163.com )
College of Life Sciences, Agriculture and Forestry, Qiqihar University, Qiqihar https://orcid.org/0000-
0002-0150-2999
Xiaoxue Liang
Qiqihar University
Xiujie Liu
Qiqihar Horticulture Research Institute
Yu Guo
Qiqihar University
Hongguo Xu
Qiqihar University
Jixiu Liu
Qiqihar Horticultural Research Institute
Yue Gao
Qiqihar Horticultural Research Institute
Chengzhi Yuan
Qiqihar University
Feishi Luan
Northeast Agricultural University
Research article
Keywords: Watermelon, QTL mapping, Fruit quality, Fruit Size, Genotyping-by-Sequencing
DOI: https://doi.org/10.21203/rs.3.rs-107825/v1
License: This work is licensed under a Creative Commons Attribution 4.0 International License.
Read Full License
Page 1/23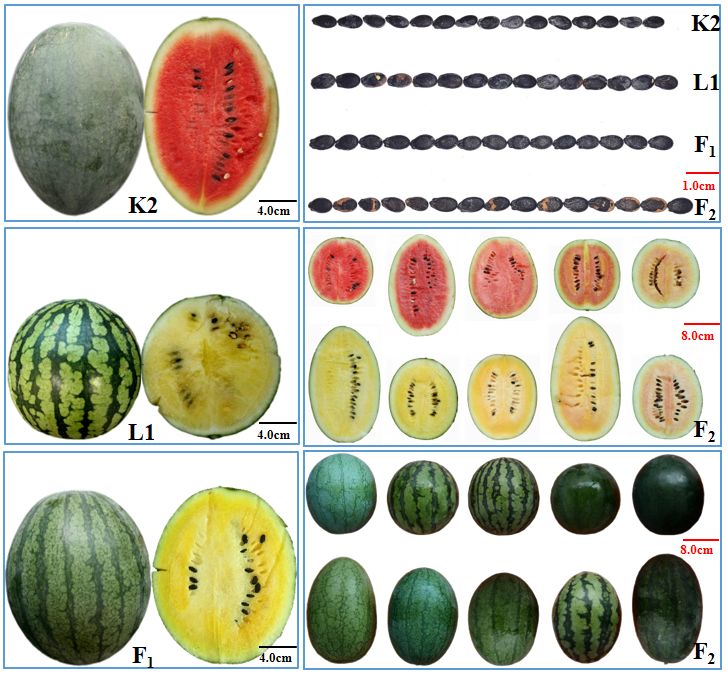
Abstract
Background

Watermelon is an important vegetable crop with dual use of both fruit and seeds. Understanding the
genetic basis of fruit quality and seed size-related traits is important for e cient marker-assisted
breeding in watermelon. Linkage mapping in watermelon segregating populations using genotyping-by-
sequencing (GBS) provides insights into genetic control of fruit- and seed-related traits and genome
collinearity in commercial watermelon cultivars.

Results

In the present study, we conducted QTL mapping of 12 horticulturally important traits on external and
internal fruit quality and seed size/weight using segregating populations derived a cross between two
commercial varieties. A high-density genetic map was developed with GBS which contained more than
6,000 SNP loci in 1,004 bins with a total map length of 1261.1 cM and average marker interval of 1.26 cM
or 329 kb. Phenotypic data of fruit rind color (RC), rind stripe pattern (RSP), esh color (FFC), fruit
diameter (FD), fruit length (FL), fruit shape index (FSI), fruit weight (FW), Brix content central (BCC), Brix
content edge (BCE), seed length (SL), width (SW), and weight (20SWT) were collected from two locations
in two years. QTL analysis identi ed 47 QTL for the 12 traits, of which 24 had moderate- or major-effects,
and 34 were novel QTL not identi ed in previous studies. The QTL for RSP were identi ed overlapped
with previous reports, and mapped the QTL to a small interval on chromosome 6. From the detected novel
QTL, we identify FD (qfd2.1), FL (q 2.1) co-located with FSI (qfsi2.1) QTL on chromosome 2, and the
minor QTL qfw3.2 co-located with previously reported fruit shape QTL (qfd3.1, q 3.1, qfsi3.1), and SW
(qsw10.1) co-located with 20SWT QTL (q20swt10.1) on chromosome 10, and 5 minor QTL (qbcc2.1,
qbcc5.1, qbce2.1, qbce2.2, qbce5.1) were found to be likely new locus for Brix content.

Conclusion

We conducted GBS consisting of 120 F2 individuals and developed a high-density linkage map with more
than 6,000 SNP loci in 1004 bins in watermelon. We identi ed 47 QTL for 12 fruit and seed related traits
including 34 novel QTL. Our work expands the molecular breeding toolbox for watermelon to improve the
yield and fruit quality.

Background
Watermelon (Citrullus lanatus, 2n = 2x = 22, family Cucurbitaceae) is a popular vegetable fruit crop.
Watermelon was originated in Africa, and now is growing worldwide [1]. New watermelon varieties with
enhanced fruit quality are needed to meet the increasing demands from consumers. Recent progress in
the development of genome assemblies and high-density genetic maps, and the use of of high-
throughput genotyping methods are accelerating QTL mapping and cloning studies in watermelon. For
example, genotyping-by-sequencing (GBS) [2] is being widely used in many crop plant for various marker-

                                                   Page 2/23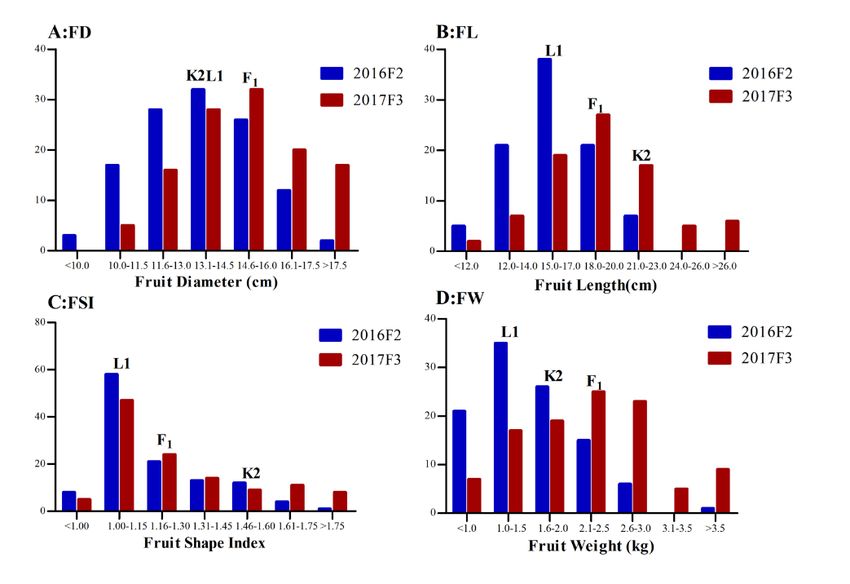
based studies [3–6]. In watermelon, GBS has recently been used to characterize collections of accessions
[7–9] and biparental populations [10–13].

Watermelon breeding traditionally focused on seed, fruit quality and morphological characteristics [14].
Due to the increasing availability of genetic and genomics resources in watermelon [15], signi cant
progress has been made in understanding the genetic basis of horticulturally important traits and
development of molecular markers [7–10, 13, 15–19]. For example, watermelon fruit rind color (RC) is
important since the appearance is one of the main determinants for consumer preference in the market,
which could be dark green or light green, light green-gray or yellow [14, 20–21]. Several studies
investigated the inheritance of watermelon RC, and identi ed molecular markers and candidate genes for
RC. For example, the yellow skin phenotype in watermelon was found to be controlled by genes on
chromosome 4 including the same locus of Dgo [22], yellow skin [23], Clyr [24]. The green skin was
proposed to be controlled by genes on chromosome 8 by the D [22], or qrc-c8-1 [13] loci, and ClCGMenG
has been identi ed as candidate gene for D/rc-c81 [25].

Watermelon rind stripe pattern (RSP) is another important appearance trait affecting buying habits of
consumers. Several studies investigated the inheritance of RSP [20, 26–30]. They include irregularly
distributed and randomly shaped whitish to green spots (m), pencilled lines on skin (p), spotted fruit rind
(Sp), yellow belly (Yb), stripe pattern (S), intermittent stripes (ins), blurred stripe margin (Csm), wide stripe
(gW), medium stripe (gM), narrow stripe (gN). Genes responsible for RSP have been identi ed on
chromosome 6 including locus of AT14-900 [31–32] associated with clearly de ned stripes/blurred
stripes, S [9, 19, 22] associated with stripe pattern/non-stripe pattern. A major-effect QTL RS8.1 for the
rind stripe width was located on chromosome 8 [33]. The chromosomal location of the S is unknown.

There are different colors of watermelon esh that are visually appealing. The main esh colors for
watermelon are white (Wf), pale yellow (py), canary yellow (C), orange (yo), pink (c), and red (Y), some C.
amarus accessions have light green esh color [20, 34–36]. Several studies in both bi-parental and
natural populations have identi ed the lycopene β-cyclase gene (LCYB, Cla97C04G070940) on
watermelon chromosome 4 that is responsible for the red esh color [19, 35–38]. These studies indicated
that the mutation in LCYB, which possibly leads to increased lycopene accumulation, results in the red
 esh color in most cultivars [39–41]. Other studies suggest that the regulation of expression of the PSY
gene for phytoene synthase may contribute to the transition from pale-colored to red, orange or yellow
 esh by increasing total carotenoid production [12, 42]. Limited work has been done on molecular
mapping of other esh colors in watermelon.

The content of soluble sugars is a major fruit quality trait of watermelon, which was under strong
selection during domestication and breeding[42]. Fruit sugar accumulation seems to be regulated by
quantitative trait loci [43]. In QTL mapping using segregating populations derived from the crosses
between a sweet-dessert watermelon line and the unsweet accessions, a major-effect QTL for Brix value,
QBRX2-1 was identi ed [15, 17]. 96 recombinant inbred lines derived from crossing sweet with unsweet

                                                    Page 3/23
varieties were resequenced, and a candidate gene (Cla00264) for the previously identi ed QBRX2-1 [15,
17] on chromosome 2 was identi ed, which is a C. lanatus tonoplast sugar transporter 2 (ClTST2) [43].
Fruit and seed sizes are also important target traits in watermelon breeding. The fruit shape of
watermelon may be round, oval, or elongated. A single gene (O/o) with incomplete dominance was
proposed to determine the difference between elongated and round fruits: OO, for elongated, Oo, for
blocky, and oo for round fruits, respectively [26, 45–46]. However, many later studies have suggested the
quantitative nature of fruit size and shape in watermelons [47–49]. After review of the literature, Pan et al.
(2020) suggested 15, 9, and 6 consensus QTL for watermelon fruit size, shape and weight, respectively
[50]. The seed size of watermelon varieties vary greatly which were classi ed into six groups: giant, big,
medium, small, tiny, and tomato seed [51]. Guo et al. (2020) reviewed the seed QTL in watermelon and
inferred 14 consensus QTL [1, 17, 52–55]. It should be noted that the QTL mapping studies on
watermelon seed size/weight are very limited. The genomic regions harboring these QTL are still very
large.
In watermelon, most QTL mapping studies for various horticultural traits used segregating populations
from crosses between exotic (wild) accessions and cultivated inbred lines. The inheritance of those traits
in populations derived from crosses among elite watermelon varieties has not been evaluated. The
objective of this study was to identify QTL underlying 12 fruit and seed-related traits in segregating
populations developed from two elite watermelon cultivars. Using GBS, we developed a high density
linkage map with more than 6000 SNP loci. Phenotypic data for 12 traits were collected in F2 and F3
populations from multi-year trials. Novel QTL were detected for a number of those traits.
Methods
Plant materials
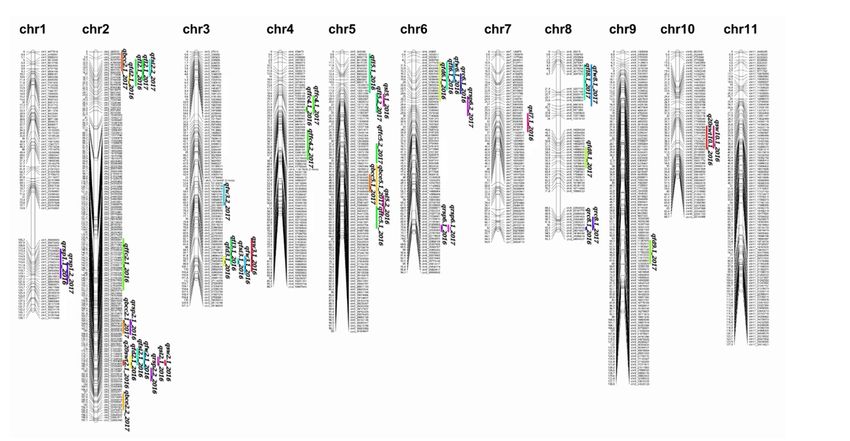
The two parental lines used in this study included K2 and L1 that are different in multiple fruit and seed
related traits. K2 is a Chinese variety setting oval shaped fruit with dark green, smooth rind and red esh.
L1 is a Japanese variety bearing round fruit with light green but striped rinds and yellow esh (Fig. 1).
Seeds of L1 are slightly larger than those of K2. Both inbred lines have medium size fruits and high
soluble solid contents that are widely accepted in Asian markets. Seeds of both lines were kindly provided
by the Qiqihar Horticultural Research Institute, Qiqihar, China.
An F2 population of 120 plants from K2 × L1 mating was used for developing a linkage map and initial
QTL mapping. Phenotypic data collection and validation of detected QTL in target chromosomal regions
were also conducted with 120 F2:3 families of the same population.
Phenotypic data collection of fruit and seed-related traits
Page 4/23Phenotypic data collection for the F2 and F2:3 populations were conducted in the greenhouses in summer
2016 (Experiment 2016F2) and in the open eld in summer 2017 (Experiment 2017F3) of the Qiqihar
Horticultural Research Institute (Qiqihar, Heilongjiang Province, China, 47°42´N, E123°99´), respectively.
The details of each experiment are provided in Supplemental Table S1. Data for 10 and 5 traits were
collected in F2 and F2:3 populations (total 12), respectively. Fruit and seed traits were measured on mature
fruits (>35 days after pollination). For F2, the data were collected from individual plants. For each F3
family, at least 8 plants were used for data collection (1 fruit per plant), and the family means were used
in QTL analysis.
Upon harvest, the fruits were rst visually scored for rind stripe pattern (RSP), and rind color (RC), then cut
open longitudinally to score for esh color (FFC). The RC of each fruit was scored categorically as light
green, dark green, or a mixture of dark green and light green, which was assigned a numerical value of 3,
1, and 2, respectively. RSP was scored as 1 for non-striped, 3 for striped, and 2 for the mixture of striped
and non-striped. Similarly, FFC of a fruit could be scored for 3 (yellow), 1 (red), or 2 (a mixture of the two).
Fruit weight (FW) was measured on a per fruit basis. Fruit shape index (FSI) was the ratio of FL (fruit
length from stem end to ower end) to FD (equatorial fruit diameter). The degree of Brix (BRX) was
measured using a refractometer (Atago Co., Ltd., Tokyo, Japan) from a juice sample collected from the
center (BCC) or the edge (BCE) of the fruit following Sandlin et al. (2012) [15]. Seeds were extracted from
each harvested fruit. The seed weight of each fruit was the mean from three replications of 20 fully
developed seeds (20SWT). Seed length (SL) and seed width (SW) were measured using a Vernier caliper
based on 20 randomly selected seeds per fruit. For each trait, the value of each F2 plant, or family mean
of each F2:3 family were used in QTL analysis.
Statistical analyses and graphical presentations of phenotypic data were performed using R (v3.2.3) with
the R Studio v1.0.143 interface. To obtain the correlation matrix among traits, the Pearson correlation
coe cients were calculated with the R package “Hmisc” [56].
Genotyping by sequencing and linkage map construction
Young leaves from individual F2 plants and parental lines were collected from 2016F2 trial for genomic
DNA extraction following established protocols [57]. Genotyping by sequencing (GBS) for the 120 F2
plants was performed on an Illumina Hi-Seq 4000 (Illumina, San Diego, CA) through commercial service
by Guangzhou Genedenovo Biotechnology Co., Ltd (http://www.genedenovo.com/) following
manufacturer’s protocols. The two parental lines, K2 and L1, were re-sequenced with Illumina Hi-Seq 2500
to ~20× coverage. The raw reads were sorted according to indices, and the high-quality SNPs between
parents were called by alignment against the 97103 watermelon draft genome 97103 (V1.0) [58]
(available at http://www.cucurbitgenomics.org/) using the Burrows-Wheeler Aligner (BWA) [59] and
VarScan2 [60].
Page 5/23For GBS data from the 120 F2 plants, variant calling was performed using 97103 V1.0 as the reference with the GATK’s Uni ed Genotyper, and the resulting SNPs/Indels were ltered using GATK’s Variant Filtration [61]. ANNOVAR [62] was used to annotate SNPs or InDels. The following criteria were used to lter for high quality SNP for linkage map development: (1) homozygous in F2 individuals and are congruent with parental lines; (2) reads depth coverage >4× in parental lines; 3) biallelic with aa×bb segregation pattern. SNPs showing distorted segregation were also excluded. The nal set of SNPs was used to de ne a bin in which all SNPs are co-segregating (no recombination) in the 120 F2 plants. A single variant with the lowest number of missing data was selected to represent each bin, and only bins with
To evaluate the mode of inheritance of RC, RSP and FFC in watermelon fruit, parents and F1 were grown
in parallel, evaluated for rind color, rind stripe pattern and esh color. The data regarding RC, RSP and FFC
were collected by visual analysis. The rind colors (RC) of the fruits of K2 and L1 were dark green and light
green, respectively. The F1 hybrid was intermediate between the parental hues. In the F2 generation, three
categories of rind colors could be recognized: dark green, light green, and irregular color patterns
consisting of mixed dark green and light green. In 2016F2 experiment, the F2 population separated into
83 plants with dark green rind (include plants that exhibit color consistent with F1) and 37 plants with
light green rind which was in agreement with a 3:1 ratio (χ2=2.178, P=0.14). Based on the segregation
among the 120 F2:3 families, 21, 37, and 62 were homozygous dark green, homozygous light green,
heterozygous at the rind color locus. These data further support a major-effect QTL underlying rind color
segregation in this population.

The rind stripe patterns (RSP) of the fruits of K2 and L1 are non-striped and striped, respectively. The F1
had rind stripe pattern but differs from L1 (Fig. 1). In the 2016F2 experiment, among the 120 F2
individuals, 92 (include individuals that exhibit striped consistent with F1) and 28 were striped and non-
striped, respectively which was consistent with the 3 to 1 segregation ratio (Table 1). Segregation in 120
F2:3 families revealed that 28 were homozygous non-striped, 37 were homozygous striped, and 55 were
heterozygous at the rind stripe pattern locus.

The esh color (FFC) of K2 and L1 fruits were red and pale yellow, respectively, while that of their F1 was
yellow or pale yellow (Fig. 1) suggesting dominance of the pale yellow esh color over red. yellow
(including mixed yellow and red color)there were 28 F2:3 families with red esh color, 66 with mixed
colors, and 26 with yellow (Table 2). Thus, all the segregation results suggested that rind color, rind stripe
pattern and esh color are largely simply inherited in this population. Nevertheless, additional QTL may
exist for each which could be evidenced from QTL mapping results (see below).

Fruit size/shape (FL, FD, and FSI) and weight (FW) data were collected in both F2 and F2:3 populations in
two years. The frequency distributions of the four traits in the two populations are illustrated in Fig. 2. In
both experiments, all four traits showed a largely normal distribution suggesting their quantitative nature.
But for FW, FL and FD, the population in 2017F3 shifted toward larger and heavier fruits which may be
due partially to differences in culture practices (Fig. 2; Table 2). In the 2017F3 experiment, plastic mulch
was used which may increase soil temperature, accelerate owering and fruit growth. Interestingly, while
FL of F1 was close to the mid-parental value, FW and FD was much larger than either parent suggesting
heterosis for them in this population. This may also suggest that FD contributes signi cantly to FW. In
addition, despite the different distributions of FL and FD between F2 and F2:3 populations, the frequency
distributions of FSI in the two experiments were highly consistent suggesting FSI is a more stable
indicator for fruit growth. Finally, for all the four traits in both experiments, transgressive inheritance was
obvious suggesting different genetic basis of these four traits in the two parental lines.

                                                   Page 7/23
Data for three seed traits (20SWT, SL and SW), and two Brix-related traits (BCC and BCE) were collected in
a single experiment. The frequency distribution for the ve traits is presented in Supplemental Fig. S1. All
showed largely normal distribution suggesting their quantitative inheritance nature.
We examined correlations among these traits, and the Pearson’s correlation coe cient matrix among
these traits is presented in Supplemental Fig. S2. As expected, correlations between fruit dimensions (FL
and FD) and FW are strong and positive. The correlation between FSI and FL was higher than with FD,
implying that length is the major determinant of fruit shape in this population, which could be seen from
closely linked QTL for these traits (below). The correlation between FD and FW was higher than that of
FL, which may be related to the transgressive inheritance of FD and FW. There was also a high correlation
between the BCC and BCE. Positive correlations among 20-SWT, SL and SW were signi cant and strong.
GBS data analysis and linkage map construction
Using Illumina high throughput sequencing, we sequenced the two watermelon elite inbred lines K2 and
L1. After SNP ltering, 76,970,496 and 68,785,644 high quality resequencing reads were mapped to the
97103 V1.0 watermelon reference genome for K2 and L1, representing 10,926, and 9,764 Mbp sequences,
respectively (see Supplemental Table S2 for main statistics). Thus the depth of coverage for K2 and L1
was approximately 25.7× and 22.9×, respectively. In total, 365,148 SNPs and 75,111 indels were identi ed
between K2 and L1.
Resequencing of 120 F2 plants resulted in 561,537,056 high quality reads (79,738 Mbp) representing
~1.56× coverage per plant (Table S2). After application of various ltering criteria, there were 13,762 high-
quality SNPs that were segregating in the 120 F2 plants, of which 6,164 followed aa×bb segregation
pattern, and were used in linkage analysis. Based on recombination events in the 120 F2 individuals,
1,004 recombinant bins were used to construct the genetic map. Main statistics of the bin genetic map
are summarized in Table 3, and graphically presented in Fig. 3. Details of the genetic map and marker
locations in the 97103 V1.0 draft genome assembly are presented in Supplemental Table S3. The total
length of the genetic map was 1261.1 cM in 11 linkage groups (chromosomes) with Chr2 being the
longest (197.1 cM, 146 mapped loci), and Chr10 the shortest (66.7 cM, 60 mapped loci). The main marker
interval was 1.26 cM. Physically, the map covered 90.29% of the watermelon genome, with on average
329 kb per bin (Table 3).
Alignment of mapped SNP loci along the physical length (97103 v1.0) of each chromosome is
graphically present in Supplemental Fig. S3 indicating uneven distribution of genetic recombination
along each chromosome. The genetic map and the watermelon reference genome was highly collinear
suggesting correct marker orders on the genetic map, which also implied no large structural changes
between the two parental lines that belong to two different market groups. There were still a few large
gaps (>2 Mbp) on the genetic map (total 29, Table S2). Nevertheless, overall, the linkage map developed
with GBS data and a moderate size segregation population (n=120 F2) in the present study was of high
Page 8/23quality and very well suited for QTL analysis in the present study and many other applications in the
future.
QTL for fruit and seed-related traits in watermelon
The values for 12 traits from F2 single plant or F3 family means were employed in QTL analysis.
Permutation tests indicated that the LOD thresholds to declare signi cant QTL among these traits varied
from 2.49 to 2.68. For convenience, we used LOD value of 2.5 for all traits. A global view of all QTL
detected across the 11 chromosomes is provided in Supplemental Fig. S4. More detailed chromosome
views of QTL for all traits are shown in supplemental Fig. S5 (detected in both experiments) and Fig. S6
(detected in only one experiment), respectively. Details of each detected QTL including map location, LOD
support value, % of phenotypic variance explained (PVE), additive/ dominance effects, as well as 1.5-LOD
support interval are provided in Table 4. Their chromosomal locations are visually illustrated in Fig. 3.
Each QTL was assigned a name; if multiple QTL for the same trait detected by different populations (F2
and F3) or experiments (2016F2 and 2017F3) were located at the same or nearby locations, the same
name was assigned. In total, 47 QTL were detected for the 12 traits including 2 each for RC, 20-SWT, and
BCC, 3 each for FSI, SW and BCE, 4 for SL, 5 each for FW and FFC, 6 each for RSP, FL and FD (Table 4).
QTL of rind color (RC) and rind stripe pattern (RSP)
The phenotypic variation of RC and RSP traits was evaluated in two environments (2016F2 and 2017F3).
Two QTL, qrc6.1 and qrc8.1 were detected for RC. The major-effect QTL qrc8.1 (PVE = 11.5-15.5%), was
identi ed in both 2016F2 and 2017F3 experiments (Table 4; Fig. S5). The minor-effect QTL qrc6.1 (PVE =
11.1%) was only detected in 2016F2. The allele from K2 of qrc8.1 contributed to intensifying RC, while
that of qrc6.1 contributed to weakening RC. Six QTL for RSP, qrsp1.1, qrsp1.2, qrsp2.1, qrsp2.2, qrsp6.1
and qrsp6.2 were detected from the two experiments (Table 4; Fig. S5). The two minor-effect QTL qrsp1.1
(PVE = 4.6%) and qrsp1.2 (PVE = 3.6%) were only detected in 2016F2 and 2017F3, respectively. The three
moderate-effect QTL, qrsp2.1 (PVE = 7.6%), qrsp2.2 (PVE = 8.0 %), and qrsp6.1 (PVE = 7.2%) were only
detected in one environment. The major effect QTL, qrsp6.2 (PVE = 33.5-37.7%) was detected in both. The
K2 alleles of qrsp1.1 and qrsp6.1 reduced RSP (negative additive effects) while all others promoted fruit
rind stripe.
QTL of fruit esh color (FFC)
Five QTL on three chromosomes were identi ed for fruit esh color (Table 4; Fig. S5). The QTL qffc4.1
was detected in both experiments; qffc2.1 and qffc5.2 were detected only in 2016F2, whereas qffc4.2 and
qffc5.1 were identi ed only in 2017F3. The three minor-effect QTL, qffc4.2, qffc5.1, and qffc5.2 could
explain 3.9-4.1% observed phenotypic variance; the moderate-effect QTL, qffc2.1 could explain 10.4%
phenotypic variations, and the major effect QTL, qffc4.1could explain 10.1-47.3% phenotypic variance. All
Page 9/23QTL had positive additive effects on fruit esh color. While qffc5.2 had positive dominance effect, the
rest had negative dominance effect.
QTL of fruit BRIX (BCC, BCE)
The data of Brix content were collected from only one season, from which ve QTL were detected (Table
4; Fig. S6). The two QTL for BCC, qbcc2.1 and qbcc5.1 had LOD support scores of 2.82 (PVE = 12.0%)
and 3.33 (PVE = 12.1%), respectively. Three BCE QTL detected in 2017F3 included qbce2.1 (PVE = 12.6%),
qbce2.2 (PVE = 9.2%), and qbce5.1 (PVE = 7.5%). The 3 Chr2, and 2 Chr5 QTL had positive, and negative
additive effects on Brix, respectively. The two QTL, qbcc5.1, and qbce5.1 were located in the same LOD
interval, which may belong to the same locus. This can explain the signi cant positive correlation
between BCC and BCE (Supplemental Fig. S2).
QTL of fruit size and shape (FD, FL, FSI, FW)
Thirteen QTL were detected for FL and FD in two experiments (Table 4; Fig. 4). Among the 6 FD QTL
(qfd2.1, qfd2.2, qfd3.1, qfd6.1, qfd8.1 and qfd9.1), qfd2.2 (PVE = 15.5%), and qfd3.1 (PVE = 15.0%)
detected in 2016F2 had the largest effects. However, both were not detected in 2017F3 experiment. The
minor-effect QTL qfd2.1 and qfd6.1 were only detected in 2016F2 and explained 7.7% and 6.5% of
phenotypic variance, respectively. The other two QTL, qfd8.1 (PVE = 7.2%) and qfd9.1 (PVE = 11.2%) were
only detected in 2017F3. The major-effect QTL qfd3.1 and the minor-effect QTL qfd6.1 had negative
additive effects on fruit diameter, while the other QTL had positive additive effects on fruit diameter. The
opposite effects of different QTL may explain the transgressive inheritance in F1 (Table 4). Among the 7
FL QTL, q 6.1 (PVE = 13.2%) and q 8.1 (PVE = 15.2%) were only detected in 2016F2 and 2017F3,
respectively. The two minor-effect QTL q 2.1 (PVE = 7.2-9.6%) and q 5.1 (PVE = 5.5-7.0%) were detected
in both years. The major-effect QTL q 3.1 (PVE = 19.7%) was only detected in 2016F2 with additive
effects on fruit elongation.
There was a signi cant correlation between FL and FD (Fig. S2), which could be explained by the co-
localization of FD and FL QTL on chromosomes 2, 3 and 6 (Table 4). We identi ed three QTL for FSI in
two experiments; the minor-effect QTL qfsi2.1 and qfsi2.2 were detected in 2017F3 and 2016F2,
respectively, and explained 9.8% and 4.2% of phenotypic variance, respectively; qfsi3.1 (PVE = 67.6%)
was the major-effect QTL and detected in 2016F2, which contributed to increased FSI value (positive
additive effects). The locations of all the three FSI QTL were consistent with those of either FL or, FD or
both.
Among the 5 FW QTL detected in the two environments, the major-effect QTL qfw6.1 (PVE = 15.1%) and
qfw8.1 (PVE = 14.0%) were detected in 2016F2 and 2017F3, respectively. The three minor-effect QTL,
qfw2.1, qfw3.1, and qfw3.2 could explain 8.6-9.4% phenotypic variance. The major-effect QTL qfw8.1
and the minor-effect QTL qfw2.1 had positive additive effects on fruit weight, while the other QTL had
Page 10/23negative additive effects on fruit weight. The opposite effects of different QTL may explain the
transgressive in heritance in F1 (Table 4). All ve FW QTL seemed to be co-localized with QTL for FL
and/or FD (Fig. S5), which was consistent with the signi cant positive correlation between FW and FL or
FD (Supplemental Fig. S2). Thus, FW variation is likely the result of pleiotropic effect of fruit size.
QTL of seed size and weight (SL, SD, 20-SWT)
Although the mean values for the two parental lines were similar, we detected four signi cant QTL for SL,
three for SW, and two for 20SWT in the 2016F2 experiment (Table 4; Fig. S6). Based on chromosomal
locations, qsw2.1, qswl2.1, and q20swt2.1 seemed to belong to the same locus underlying seed
size/weight. The three QTL was the most signi cant for SW, SL and 20SWT, respectively. The QTL qsw2.1
was located on chromosomes 2 between markers BIN0194 and BIN0196 with 164.76-167.71 cM
intervals, and explained 35.5% of PVE, with a high LOD value of 15.14. The QTL qsl2.1 (PVE = 43.5%) was
located between BIN0192 and BIN0196 (from 163.08 cM to 167.71 cM) with a high LOD value (16.95).
The QTL q20swt2.1 had a LOD score of 21.88, explaining 50.1% of the observed phenotypic variance in
this population. These three SL, SW, and 20SWT QTL on chromosome 2 were likely the same major-effect
QTL for seed size/weight. Two minor-effect QTL for SW, qsw3.1 and qsw10.1, together explained 18.2%
of the PVE values. Three minor-effect QTL for SL qsl5.1, qsl5.2 and qsl7.1 together explained 16.7% of
PVE. The minor-effect QTL for 20SWT, q20swt10.1 explained 9.0% of the PVE values.
Discussion
A linkage map based on the cross of two elite commercial
varieties
In the present study, we developed a high-density genetic map using an F2 population derived from two
elite watermelon varieties K2 and L1, which are popular in the China and Japan markets. Cultivated
watermelons are known to have narrow genetic base, and low marker polymorphism is a constraint for
genetic map development in pre-genomics era [68-70]. The map developed in the present study had 1004
bins that spanned 1261.1 cM with an average bin interval of 326 kb (Table 3, Table S4). The # of mapped
loci (bins) from our study was somewhat lower than maps developed in several previous studies [10,13].
This was reasonable because the two previous maps were developed using populations derived from
crosses between wild and cultivated-type watermelons. Several previous studies reported the
chromosome rearrangements between the wild and cultivated-type watermelons on chromosomes 1 and
11 [7,8,10,13], which could be due to incorrect assembly of the reference genome, genetic rearrangement
or assembly errors [71]. The marker orders of these mapped loci were consistent with their physical
locations on the 97103 v1.0 draft genome assembly (Fig. S3) suggesting no major structural changes
between K2 and L1 genomes.
Page 11/23Genetic basis of fruit rind color and stripe pattern in
watermelon
Fruit rind color and strip patterns are important fruit external quality traits for watermelon. Most
watermelon varieties have green or dark green colors (or grey) with or narrow or wide stipes. Several
previous studies have shown that watermelon rind color is controlled by a single gene on Chr8 with dark
green being dominant to light green [13,22,29]. More recently, Li et al. (2019) identi ed a candidate gene
(ClCG08G017810 or ClCGMenG) for this locus that encodes 2-phytyl-1,4-beta-naphthoquinone
methyltransferase [25]. In our study, we consistently detected a major-effect QTL, qrc8.1 on Chr8 (PVE
~15%) in both years (Table 4; Fig. S5). In the 97103 v1.0 assembly, chromosome 8 is not intact and
contains a nearly 262 kb deletion on this chromosome, comprising 34 additional genes at this
chromosomal region in ‘Charleston Gray’. ClCGMenG was from 29869645 to 29901009 on chromosome
8 according to the ‘Charleston Gray’ watermelon reference genome. However, the 1.5-LOD interval of
qrc8.1 was from 24,074,857 to 24,644,537 (Table 4). Thus our QTL detected in this study seem not in the
same region as reported by Li et al. (2019) [25]. Further evidence is needed to prove this. In addition, in
2016F2, we identi ed a moderate-effect QTL qrc6.1 that could explain 11.1% observed phenotypic
variance (Table 4). Therefore, the gene associated with watermelon rind color in this study merits further
investigation.
The rind stripe of watermelon fruit was previously described as a monogenic trait named S [26], but to our
knowledge it has not been cloned. In this study, we detected six QTL for rind stripe pattern, which
explained 3.57-37.65% of the phenotypic variance. A major-effect QTL on this trait, qrsp6.2 was delimited
to a region of 887 kb on chromosome 6 (Table 4; Fig. S5), which was consistent with previous studies in
which watermelon rind stripe is controlled by the S locus on chromosome 6 [9,19,22]. However, further
experiments are necessary to demonstrate the identity of qrsp6.2.
QTL for fruit esh color and fruit Brix in watermelon
Flesh color is probably the most visually appealing trait for watermelon. A major-effect QTL was
identi ed in the F2 population which was located in an interval of ~ 645 kb. We also identi ed three
minor-effect QTL (qffc4.2, qffc5.1, qffc5.2) and one moderate-effect QTL (qffc2.1) for esh color in this
study (Table 4; Fig. S5). Previous studies have shown that esh color is controlled by several genes, so
the appearance of mixed colors may be due to the re-combination of genes controlling the expression of
different pigments [35]. The major-effect QTL detected herein seems to be consistent with early work,
which suggest that the LCYB (Cla97C04G070940) gene [19,35-38] leads to increased lycopene
accumulation, resulting in the red esh color in most cultivars [39-41]. Therefore, the new QTL and the
new gene associated with watermelon esh color will require further investigation.
Watermelon fruit is mainly consumed as a dessert; high sugar content and thus high soluble solids is a
desired characteristic with special importance in watermelon breeding. Interestingly, of the two elite
Page 12/23parental lines we used in this study, the soluble solid content of K2 was only slightly higher than L1
(Table 2). We detected ve soluble solid content QTL, two for BCC (qbcc2.1, qbcc5.1) and three for BCE
(qbce2.1, qbce2.2, qbce5.1) (Table 4; Fig. S6). Based on their LOD intervals, qbcc2.1, qbce2.1 and qbce2.2
were not co-localized whereas qbcc5.1 and qbce5.1 were located in the same interval on Chr5 hinting
they may be the same locus for soluble solid content. In previous work, a major QTL for Brix value,
QBRX2-1 was identi ed on chromosome 2 between nucleotides 17,657,266 and 18,454,759 [15,17,43].
The QTL detected in the present study was located in an interval outside the ClTST2 (Cla000264)the
candidate gene for Brix value [43]. Therefore, the gene associated with watermelon sugar accumulation in
this study will provide novel QTL and require further investigation.
QTL for fruit size and shape in watermelon
Several QTL mapping studies have been conducted in watermelon to understand the genetic basis of
fruit shape variation [1,15,30,54,74]. Pan et al. (2020) reviewed fruit size and shape QTL in the
watermelon, from which consensus QTL were inferred including 9 ‘consensus’ FSI QTL on 7
chromosomes (2, 3, 5, 7, 8, 9 and 10) [50]. Among them, the major-effect FSI QTL on chromosome 3,
ClFSI3.1, has been detected in all QTL mapping studies in watermelon, which is the O locus of
watermelon proposed long time ago [14,26,50]. Dou et al. (2018) identi ed a candidate gene for the
O/ClFSI3.1 locus which is a homolog of the tomato SUN [1] gene (ClSun25-26-27a or Cla011257) [74].
Dou et al. (2018) found that the round fruit shape is due to a 159-bp deletion in the coding region of
Cla011257 [74]. This nding was con rmed by Maragal et al. (2019) and Legendre et al. (2020) who
reported also a novel allele at this locus [75-76].
In this study, we identi ed 20 QTL for FL, FD, FSI and FW (Table 4). Among them, qfsi3.1 had the highest
effect (LOD = 32.0; PVE = 67.6%). Other three major-effect QTL, qfw3.2, qfd3.1, and q 3.1 were co-
localized with qfsi3.1 suggesting a single QTL at this locus is responsible for all four traits, and this QTL
plays the most important role in control of fruit shape in this population. Based on the chromosomal
location, qfsi3.1 is likely the same as the O/ ClSun25-26-27a suggesting that the round fruit shape in
majority of cultivated watermelon varieties is controlled by the O locus.
Fruit weight (FW) is apparently correlated with fruit size, which is also an important component for fruit
yield. The two FW QTL (qfw2.1, qfw3.2) are co-localized with consensus FSI QTL (qfsi2.2, qfsi3.1,
respectively indicating a close correlation between them (Table 4; Fig. S5). In published studies of fruit
size/shape traits, the major QTL for FL and FW in cucumber were co-localized on the same chromosome
[50], which was similar to our results. Almost all FW QTL are co-localized with consensus FS QTL
indicating a close correlation between them in cucumber. In addition, we compared the genomic regions
underlying the 20 QTL for fruit size and shape from our study with consensus FS and FW QTL inferred by
Pan et al. (2020) [50], we found that there are 14 novel QTL (qfd2.1, qfd6.1, qfd8.1, qfd9.1, q 2.1, q 5.2,
q 6.1, q 8.1, qfsi2.1, qfw3.1, qfw3.2, qfw6.1, qfw8.1) not identi ed in previous studies.
Page 13/23QTL for seed size and weight in watermelon
In this study, QTL analysis identi ed nine QTL for SL, SW and 20-SWT with 4, 3, and 2 for SL, SW, and 20-
SWT, respectively (Table 4; Fig. S6). Guo et al. (2020) reviewed the genetic architecture of seed size
variation in watermelon, and inferred 14 consensus QTL on seed size and which are distributed on 7 of
the 11 watermelon chromosomes [1,17,52-55]. Among them, qsl5.1, qsl5.2, qsl7.1, qsw3.1, qsw10.1,
q20swt10.1 were not identi ed in previous studies. Especially, the QTL on chromosome 6, was identi ed
in most studies with F2 and RILs populations derived from different seed size materials, suggesting that
this QTL may play the most important role in seed size/weight determination [17,54,55,76]. Interestingly,
we detected a major-effect QTL (PVE = 35.5-50.1%) for SL, SW, and 20SWT (20 seed weight) on
chromosome 2 by two watermelon inbred lines with medium size seeds, and we detected none QTL on
chromosome 6. Indeed, the major-effect QTL was probably the same one detected in multiple previous
studies controlling seed size variation in watermelon [1,17,76]. So the QTL on chromosome 2 may control
medium size seed variation in watermelon.
Conclusion
In the present work, we constructed a high-density genetic map in watermelon based on the GBS method.
Combined the high-throughput sequencing and strict ltering pipeline, we identi ed high-quality SNPs in
F2 population and created a high-density genetic map that contained 1004 bin markers evenly distributed
across the 11 watermelon chromosomes. The genetic map spanned 1261.1 cM with an average distance
of 1.26 cM between adjacent markers, and 47 QTL for fruit and seed-related traits were mapped. The
location of these QTL in narrow genomic intervals could facilitate cloning of the underlying genes and
their use in breeding programs by marker-assisted selection. Since the mapping population was
developed from commercial cultivars, avoiding the negative consequences associated to linkage drag
when using exotic material as donors. Results from this study will lay the foundation for further ne
mapping, marker-assisted selection and map-based gene cloning in watermelon.
Abbreviations
FW, fruit weight; FFC, fruit esh color; RC, rind color; RSP, rind stripe pattern; BCC, brix content central; BCE,
brix content edge; SL, seed length; SW, seed width; 20SWT, 20-seed weight; FD, fruit diameter; FL, fruit
length; FSI, fruit shape index.
Declarations
Ethics approval and consent to participate
The research on watermelon QTL mapping in the manuscript has been conducted under the guidance of
international ethical standards. All research protocols were conducted with the approval of the Qiqihar
University, China.
Page 14/23Consent to publish
All authors are agree and gave their consent to publish this manuscript.
Availability of data and materials
All data pertinent to this study have been provided in supplemental materials of this manuscript.
Competing interests
There are no known con icts of interest associated with this publication and there has been no
signi cant nancial support for this work that could have in uenced its outcome.
Funding
This work was supported by the National Natural Science Foundation of China (31972437 31772334
31401891), the Natural Science Foundation of Heilongjiang Province (LC2018015), and the Fundamental
Research Funds of Heilongjiang Provincial Universities (135209106) to MG. Funds were used the design
of the study and collection, analysis, and interpretation of data and in writing the manuscript. All the
expenses come in conducted the experiment was supported by National Natural Science Foundation of
China, the Natural Science Foundation of Heilongjiang Province and the Fundamental Research Funds of
Heilongjiang Provincial Universities.
Authors' Contributions
MG conceived the research, designed the experiments. XL performed the research, analyzed the data, and
prepared draft of the manuscript. XL, YG, HX, JL, YG, and CY participated in data collection, FL provided
theoretical guidance. All authors are agree and gave their consent to publish this manuscript.
Acknowledgements
We thank the college of life sciences, agriculture and forestry, Qiqihar University, China and Qiqihar
Horticultural Research Institute, China for the assistance.
References
1. Kim KH, Hwang JH, Han DY, Park M, Kim S, Choi D, et al. Major quantitative trait loci and putative
candidate genes for powdery mildew resistance and fruit-related traits revealed by an intraspeci c
genetic map for watermelon (Citrullus lanatus lanatus). PLoS One. 2015;10: e0145665.
Page 15/232. Elshire RJ, Glaubitz JC, Sun Q, Poland JA, Kawamoto K, Buckler ES, et al. A robust, simple
genotyping-by-sequencing (GBS) approach for high diversity species. PLoS One. 2011;6: e19379.
3. DeLeon TB, Linscombe S, Subudhi PK. Molecular dissection of seedling salinity tolerance in rice
(Oryza Sativa) using a high-density GBS-based SNP linkage map. Rice. 2016;9:52.
4. Li HH, Vikram P, Singh RP, Kilian A, Carling J, Song J, et al. A high density GBS map of bread wheat
and its application for dissecting complex disease resistance traits. BMC Genomics. 2015;16:216.
5. Poland JA, Brown PJ, Sorrells ME, Jannink JL, Yin T. Development of high-density genetic maps for
barley and wheat using a novel two-enzyme genotyping-by-sequencing approach. PLoS One.
2012;7:e32253.
6. Chen ZL, Wang BB, Dong XM, Liu H, Ren LH, Chen J, et al. An ultra-high density bin-map for rapid
QTL mapping for tassel and ear architecture in a large F2 maize population. BMC Genomics.
2014;15:433.
7. Nimmakayala P, Abburi VL, Bhandary A, Abburi L, Vajja VG, Reddy R, et al. Use of VeraCode 384-plex
assays for watermelon diversity analysis and integrated genetic map of watermelon with single
nucleotide polymorphisms and simple sequence repeats. Mol Breed. 2014;34:537-548.
8. Reddy UK, Nimmakayala P, Levi A, Abburi VL, Saminathan T, Tomason YR, et al. High-resolution
genetic map for understanding the effect of genome-wide recombination rate on nucleotide diversity
in watermelon. G3. 2014;4:2219-2230.
9. Wu S, Wang X, Reddy U, Sun H, Bao K, Gao L, et al. Genome of 'Charleston Gray', the principal
American watermelon cultivar, and genetic characterization of 1,365 accessions in the U.S. National
Plant Germplasm System watermelon collection. Plant Biotechnol J. 2019;17:2246-2258.
10. Ren RS, Ray R, Li PF, Xu JH, Zhang M, Liu G, et al. Construction of a high density DArTseq SNP-based
genetic map and identi cation of genomic regions with segregation distortion in a genetic
population derived from a cross between feral and cultivated-type watermelon. Mol Genet Genomics.
2015;290:1457.
11. Shang JL, Li N, Li NN, Xu Y, Ma SW, Wang JM. Construction of a high-density genetic map for
watermelon (Citrullus lanatus) based on large-scale SNP discovery by speci c length ampli ed
fragment sequencing (SALF-seq). Sci Hortic-Amsterdam. 2016;203:38-46.
12. Branham S, Vexler L, Meir A, Tzuri G, Frieman Z, Levi A, et al. Genetic mapping of a major
codominant QTL associated with β-carotene accumulation in watermelon. Mol Breed. 2017;37:146.
13. Li BB, Lu XQ, Dou JL, Aslam A, Gao L, Zhao SJ, et al. Construction of a high-density genetic map and
mapping of fruit traits in watermelon (Citrullus Lanatus) based on whole-genome resequencing. Int J
Mol Sci. 2018;19:3268.
14. Guner N, Wehner TC. The genes of watermelon. Hortscience. 2004;39:1175-1182.
15. Sandlin K, Prothro J, Heesacker A, Khalilian N, Okashah R, Xiang W, et al. Comparative mapping in
watermelon [Citrullus lanatus (thunb.) Matsum et Nakai]. Theor Appl Genet. 2012;125:1603-1618.
Page 16/2316. Ren Y, Zhao H, Kou Q, Jiang J, Guo S, Zhang H, et al. A high resolution genetic map anchoring
scaffolds of the sequenced watermelon genome. PLoS One. 2012;7:e29453.
17. Ren Y, McGregor C, Zhang Y, Gong G, Zhang H, Guo S, et al. An integrated genetic map based on four
mapping populations and quantitative trait loci associated with economically important traits in
watermelon (Citrullus lanatus). BMC Plant Biol. 2014;14:33.
18. Zhu HY, Song PY, Koo DH, Guo LQ, Li YM, Sun SR, et al. Genome wide characterization of simple
sequence repeats in watermelon genome and their application in comparative mapping and genetic
diversity analysis. BMC Genomics. 2016;17(1):557.
19. Guo SG, Zhao SJ, Sun HH, Wang X, Wu S, Lin T, et al. Resequencing of 414 cultivated and wild
watermelon accessions identi es selection for fruit quality traits. Nat Genet. 2019;51:1616-1623.
20. Gusmini G, Wehner TC. Qualitative inheritance of rind pattern and esh color in watermelon. J Hered.
2006;97:177-185.
21. Kumar R, Wehner TC. Discovery of second gene for solid dark green versus light green rind pattern in
watermelon. J Hered. 2011;102:489-493.
22. Park SW, Kim KT, Kang SC, Yang HB. Rapid and practical molecular marker development for rind
traits in watermelon. Hortic Environ Biote. 2016;57:385-391.
23. Dou JL, Lu XQ, Ali A, Zhao SJ, Zhang L, He N, et al. Genetic mapping reveals a marker for yellow skin
in watermelon (Citrullus lanatus). PLoS One. 2018;13:e0200617.
24. Liu D, Yang H, Yuan Y, Zhu H, Zhang M, Wei X, et al. Comparative transcriptome analysis provides
insights into yellow rind formation and preliminary mapping of the Clyr (yellow rind) gene in
watermelon. Front Plant Sci. 2020;11:192.
25. Li BB, Zhao SJ, Dou JL, Aslam A, Gebremeskel H, Gao L, et al. Genetic mapping and development of
molecular markers for a candidate gene locus controlling rind color in watermelon. Theor Appl Genet.
2019;132:2741-2753.
26. Weetman LM. Inheritance and correlation of shape, size, and color in the watermelon, Citrullus
vulgaris Iowa Agr Expt Sta Res Bul. 1937;228:342-350.
27. Poole CF. Genetics of cultivated cucurbits. J Hered. 1944;35:122-128.
28. Rhodes BB. Genes affecting foliage color in watermelon. J Hered. 1986;77:134-135.
29. Yang HB, Park S, Park Y, Lee GP, Kang SC, Kim YK. Linkage analysis of the three loci determining rind
color and stripe pattern in watermelon. Kor J Hort Sci Technol. 2015;33:559-565.
30. Lou LL, Wehner TC. Qualitative inheritance of external fruit traits in watermelon. Hortscience.
2016;51:487-496.
31. Gama RN, Santos CA, Dias RC, Alves JC, Nogueira TO. Microsatellite markers linked to the locus of
the watermelon fruit stripe pattern. Genet Mol Res. 2015;14:269-276.
32. Kim H, Han D, Kang J, Choi Y, Levi A, Lee GP, et al. Sequence-characterized ampli ed polymorphism
markers for selecting rind stripe pattern in watermelon (Citrullus lanatus). Hortic Environ Biote.
2015;56:341-349.
Page 17/2333. Zhang ZP, Zhang YN, Sun L, Qiu G, Sun YJ, Zhu ZC, et al. Construction of a genetic map for, Citrullus
lanatus, based on CAPS markers and mapping of three qualitative traits. Sci Hortic-Amsterdam.
2018;233:532-538.
34. Perkins-Veazie P, Collins JK, Davis AR, Roberts W. Carotenoid content of 50 watermelon cultivars. J
Agr Food Chem. 2006;54:2593-2597.
35. Bang H, Davis AR, Kim S, Leskovar DI, King SR. Flesh color inheritance and gene interactions among
canary yellow, pale yellow, and red watermelon. J Am Soc Hortic Sci. 2010;135:362-368.
36. Wang C, Qiao A, Fang X, Sun L, Gao P, Davis AR, et al. Fine mapping of lycopene content and esh
color related gene and development of molecular marker–assisted selection for esh color in
watermelon (Citrullus lanatus). Front Plant Sci. 2019;10:1240.
37. Bang H, Kim S, Leskovar D, King S. Development of a codominant CAPS marker for allelic selection
between canary yellow and red watermelon based on SNP in lycopene β-cyclase (LCYB) gene. Mol
Breed. 2007;20:63-72.
38. Liu S, Gao P, Wang XZ, Davis AR, Baloch AM, Luan FS. Mapping of quantitative trait loci for lycopene
content and fruit traits in Citrullus lanatus. Euphytica. 2015;202:411-426.
39. Nakkanong K, Yang JH, Zhang MF. Carotenoid accumulation and carotenogenic gene expression
during fruit development in novel interspeci c inbred squash lines and their parents. J Agr Food
Chema. 2012;60:5936-5944.
40. Grassi S, Piro G, Lee JM, Zheng Y, Fei ZJ, Dalessandro G, et al. Comparative genomics reveals
candidate carotenoid pathway regulators of ripening watermelon fruit. BMC Genomics. 2013;14:781.
41. Lv P, Li N, Liu H, Gu HH, Zhao WE. Changes in carotenoid pro les and in the expression pattern of the
genes in carotenoid metabolisms during fruit development and ripening in four watermelon cultivars.
Food Chem. 2015;174:52-59.
42. Guo S, Sun H, Zhang H, Liu J, Ren Y, Gong G, et al. Comparative transcriptome analysis of cultivated
and wild watermelon during fruit development. PLoS One. 2015;10:e0130267.
43. Ren Y, Guo S, Zhang J, He H, Sun H, Tian S, et al. A tonoplast sugar transporter underlies a sugar
accumulation QTL in watermelon. Plant Physiol. 2018;176:836-850.
44. McKay JW. Factor interaction in Citrullus. J Hered. 1936;27:110-112.
45. Poole CF, Grimball PC. Interaction of sex, shape, and weight genes in watermelon. J Agric Res.
1945;71:533-552.
46. Tanaka T, Wimol S, Mizutani T. Inheritance of fruit shape and seed size of watermelon. J Jpn Soc
Hortic Sci. 1995;64:543-548.
47. Gusmini G, Wehner TC. Foundations of yield improvement in watermelon. Crop Sci. 2005;45:141-146.
48. Gusmini G, Wehner TC. Heritability and genetic variance estimates for fruit weight in watermelon.
Hortscience. 2007;42:1332-1336.
49. Kumar R, Wehner TC. Quantitative analysis of generations for inheritance of fruit yield in
watermelon. Hortscience. 2013;48:844-847.
Page 18/2350. Pan YP, Wang YH, McGregor C, Liu S, Luan FS, Gao ML, et al. Genetic architecture of fruit size and
shape variation in cucurbits: a comparative perspective. Theor Appl Genet. 2020;133:1-21.
51. Yongjae K, Taejin Y, Younghoon P, Yongjik L, Suncheol K, Yongkwon K, et al. Development of near
isogenic lines with various seed sizes and study on seed size-related characteristics in watermelon.
Korean J Breed Sci. 2009;41:403-411.
52. Guo Y, Gao M, Liang X, Xu M, Liu X, Zhang Y, et al. Quantitative trait loci for seed size variation in
cucurbits - A review. Front Plant Sci. 2020;11:304.
53. Meru G, McGregor C. Genetic mapping of seed traits correlated with seed oil percentage in
watermelon. Hortscience. 2013;48:955-959.
54. Liu CQ, Gao P, Luan FS. Construction of a genetic linkage map and QTL analysis of fruit-associated
traits in watermelon. Sci Agric Sin. 2014;47:2814-2829.
55. Li N, Shang JL, Wang JM, Zhou D, Li NN, Ma SW. Fine mapping and discovery of candidate genes for
seed size in watermelon by genome survey sequencing. Sci Rep. 2018;8:843-854.
56. Pereira L, Ruggieri V, Pérez S, Alexiou KG, Fernández M, Jahrmann T, et al. QTL mapping of melon
fruit quality traits using a high-density GBS-based genetic map. BMC Plant Biol. 2018;18:324.
57. Gao ML, Hu LL, Li YH, Weng YQ. The chlorophyll-de cient golden leaf mutation in cucumber is due to
a single nucleotide substitution in CsChlI for magnesium chelatase I subunit. Theor Appl Genet.
2016;129:1961-1973.
58. Guo S, Zhang J, Sun H, Salse J, Lucas WJ, Zhang H, et al. The draft genome of watermelon (Citrullus
lanatus) and resequencing of 20 diverse accessions. Nat Genet. 2013;45:51-58.
59. Li H, Durbin R. Fast and accurate short read alignment with burrows-wheeler transform.
Bioinformatics. 2009;25:1754-1760.
60. Koboldt DC, Zhang QY, Larson DE, Shen D, Mclellan MD, Lin L, et al. VarScan 2: somatic mutation
and copy number alteration discovery in cancer by exome sequencing. Genome Res. 2012;22:568-
576.
61. DePristo MA, Banks E, Poplin R, Garimella KV, Maguire JR, Hartl C, et al. A framework for variation
discovery and genotyping using next-generation DNA sequencing data. Nat Genet. 2011;43:491-498.
62. Wang K, Li MY, Hakonarson H. ANNOVAR: functional annotation of genetic variants from high-
throughput sequencing data. Nucleic Acids Res. 2010;38:e164-e164.
63. Broman KW, Wu H, Sen S, Churchill GA. R/qtl: QTL mapping in experimental crosses. Bioinformatics.
2003;19:889-890.
64. Weng Y, Colle M, Wang Y, Yang L, Rubinstein M, Sherman A, et al. QTL mapping in multiple
populations and development stages reveals dynamic QTL for fruit size in cucumbers of different
market classes. Theor Appl Genet. 2015;128:1747-1763.
65. Churchill GA, Doerge RW. Empirical threshold values for quantitative trait mapping. Genetics.
1994;138:963-971.
Page 19/2366. Doerge RW, Churchill GA. Permutation tests for multiple loci affecting a quantitative character.
Genetics. 1996;142:285-294.
67. Bo KL, Ma Z, Chen JF, Weng YQ. Molecular mapping reveals structural rearrangements and
quantitative trait loci underlying traits with local adaptation in semi-wild Xishuangbanna cucumber
(Cucumis sativus var. xishuangbannanesis Qi et Yuan). Theor Appl Genet. 2015;128,25-39.
68. Hashizume T, Shimamoto I, Harushima Y, Yui M, Sato T, Imai T, et al. Construction of a linkage map
for watermelon (Citrullus lanatus (Thunb.) Matsum & Nakai) using random ampli ed polymorphic
DNA (RAPD). Euphytica. 1996;90(3):265-273.
69. Levi A, Thomas CE, Zhang X, Joobeur T, Dean RA, Wehner TC, et al. A genetic linkage map for
watermelon based on randomly amplifed polymorphic DNA markers. J Am Soc Hortic Sci.
2001;126:730-737.
70. Levi A, Thomas C, Trebitsh T, Salman A, King J, Karalius J, et al. An extended linkage map for
watermelon based on SRAP, AFLP, SSR, ISSR, and RAPD markers. J Am Soc Hortic Sci.
2006;131(3):393-402.
71. Zhang Q, Liu CY, Liu YF, VanBuren R, Yao XH, Zhong CH, et al. High-density interspeci c genetic maps
of kiwifruit and the identi cation of sex-speci c markers. DNA Res. 2015;22:367-375.
72. Wehner TC. Gene list for watermelon. Cucurbit Genet Coop Rep (2007) 30: 96-120
73. Henderson WR, Scott GH, Wehner TC. Interaction of esh color genes in watermelon. J Hered.
1998;89:50-53.
74. Dou JL, Zhao SJ, Lu XQ, He N, Zhang L, Ali Aslam, et al. Genetic mapping reveals a candidate gene
(ClFS1) for fruit shape in watermelon (Citrullus lanatus). Theor Appl Genet. 2018;131:947-958.
75. Maragal S, Rao ES, Lakshmana Reddy DC. Genetic analysis of fruit quality traits in prebred lines of
watermelon derived from a wild accession of Citrullus amarus. Euphytica. 2019;215:199.
76. Legendre R, Kuzy J, Mcgregor C. Markers for selection of three alleles of ClSun25-26-27a (cla011257)
associated with fruit shape in watermelon. Mol Breed. 2020;40:19.
77. Prothro J, Sandlin K, Abdel-Haleem H, Bachlava E, Mcgregor C. Main and epistatic quantitative trait
loci associated with seed size in watermelon. J Am Soc Hortic Sci. 2012;137:452-457.
Tables
Due to technical limitations, table 1, table 2, table 3 and table 4 are available as a download in the
Supplemental Files section.
Figures
Page 20/23Figure 1
Morphological differences of two parental lines used in the present study. Fruits of K2 are oval shaped
with smooth, dark green rind, and red esh; Fruits of L1 are round with striped rind and yellow esh. The
seeds of K2 are uniformly dark, and those from L1 are stippled but slightly larger.
Page 21/23Figure 2
Frequency distribution of rind color (RC), rind stripe pattern (RSP), esh color (FFC), fruit weight (FW), fruit
diameter (FD), fruit length (FL) and fruit shape index (FSI) among 120 K2× L1 F2:3 families in two
experiments (2016F2 and 2017F3). Arrows indicated corresponding values of K2, L1 and their F1.
Page 22/23Figure 3
Genetic map containing detected QTL and major loci. The map distance is given on the left in cM from
the top of each chromosome. Vertical bars delimit positions of QTL in terms of 1.5-LOD interval. FW, fruit
weight; FFC, fruit esh color; RC, rind color; RSP, rind stripe pattern; BCC, brix content central; BCE, brix
content edge; SL, seed length; SW, seed width; 20SWT, 20-seed weight; FD, fruit diameter; FL, fruit length;
FSI, fruit shape index.
Supplementary Files
This is a list of supplementary les associated with this preprint. Click to download.
SupplTablesS1S3.xlsx
SuppFig.S1S6.pptx
Tables14.xlsx
Page 23/23You can also read