Evolution of Flavylium-Based Color Systems in Plants: What Physical Chemistry Can Tell Us
←
→
Page content transcription
If your browser does not render page correctly, please read the page content below

International Journal of
               Molecular Sciences

Article
Evolution of Flavylium-Based Color Systems in Plants:
What Physical Chemistry Can Tell Us
Fernando Pina 1, * , Alfonso Alejo-Armijo 1 , Adelaide Clemente 2 , Johan Mendoza 1 , André Seco 1 ,
Nuno Basílio 1 and António Jorge Parola 1

                                             1   LAQV—REQUIMTE, Departamento de Química, Faculdade de Ciências e Tecnologia,
                                                 Universidade Nova de Lisboa, 2829-516 Caparica, Portugal; aaa00010@red.ujaen.es (A.A.-A.);
                                                 johanmen2a@gmail.com (J.M.); am.seco@campus.fct.unl.pt (A.S.); nuno.basilio@fct.unl.pt (N.B.);
                                                 ajp@fct.unl.pt (A.J.P.)
                                             2   cE3c—Centre for Ecology, Evolution and Environmental Changes, Faculdade de Ciências,
                                                 Universidade de Lisboa, Campo Grande, 1749-016 Lisboa, Portugal; maclemente@fc.ul.pt
                                             *   Correspondence: fp@fct.unl.pt

                                             Abstract: Anthocyanins are the basis of the color of angiosperms, 3-deoxyanthocyanins and sphag-
                                             norubin play the same role in mosses and ferns, and auronidins are responsible for the color in
                                             liverworts. In this study, the color system of cyanidin-3-O-glucoside (kuromanin) as a represen-
                                             tative compound of simpler anthocyanins was fully characterized by stopped flow. This type of
                                             anthocyanin cannot confer significant color to plants without intra- or intermolecular interactions,
                                             complexation with metals or supramolecular structures as in Commelina communis. The anthocyanin’s
                                             color system was compared with those of 3-deoxyanthocyanins and riccionidin A, the aglycone of
                                             auronidins. The three systems follow the same sequence of chemical reactions, but the respective

                                      thermodynamics and kinetics are dramatically different.

Citation: Pina, F.; Alejo-Armijo, A.;
                                             Keywords: anthocyanins; 3-deoxyanthocyanins; auronidins; color of plants evolution
Clemente, A.; Mendoza, J.; Seco, A.;
Basílio, N.; Parola, A.J. Evolution of
Flavylium-Based Color Systems in
Plants: What Physical Chemistry Can
Tell Us. Int. J. Mol. Sci. 2021, 22, 3833.   1. Introduction
https://doi.org/10.3390/ijms22083833               The thesis presented in this work is that the anthocyanin system that confers color to
                                             angiosperms, starred by different molecules, was previously used by liverworts, mosses,
Academic Editor: Maurizio Battino            and ferns. By the anthocyanin system, we mean the flavylium cation, quinoidal base,
                                             hemiketal, and cis- and trans-chalcones, and the chemical reactions that interconvert them.
Received: 25 February 2021                   The estimates for the origin of mosses fall within the Cambrian to Ordovician period [1],
Accepted: 2 April 2021
                                             and those of liverworts within the Ordovician to Early Devonian period [2,3], but several
Published: 7 April 2021
                                             competing hypotheses have hindered estimates of a consensual age for these groups [4].
                                             Ferns originated in the Early-Mid Devonian [5] and angiosperms during the Lower Creta-
Publisher’s Note: MDPI stays neutral
                                             ceous, possibly earlier (Scheme 1) [6]. The color systems used by these plants are based on
with regard to jurisdictional claims in
                                             furanoflavylium cations (liverworts), 3-deoxyanthocyanidins and sphagnorubin (mosses
published maps and institutional affil-
                                             and ferns), and anthocyanins (angiosperms). The color system of anthocyanins is unique
iations.
                                             in versatility when compared with those of furanoflavylium and 3-deoxyanthocyanins.
                                                   Color is ubiquitous in nature and anthocyanins are the largest class of water-soluble
                                             compounds present in the plant kingdom responsible for a range of colors in plants, from
                                             orange-red to purple-blue hues. Anthocyanins are glycosylated forms of anthocyanidins,
Copyright: © 2021 by the authors.
                                             normally occurring as 3-glycosides or 3,5-diglycosides (Scheme 2). Different types of
Licensee MDPI, Basel, Switzerland.
                                             monosaccharides (e.g., glucose, galactose, rhamnose, and arabinose) and disaccharides
This article is an open access article
                                             (e.g., rutinose, sambubiose, and sophorose) can be attached to the flavylium core, and
distributed under the terms and
                                             these sugars can also be acylated with cinnamic acids (e.g., caffeic, coumaric, ferulic, and
conditions of the Creative Commons
                                             sinapic acids) or aliphatic acids (e.g., acetic, malic, oxalic, and succinic acids) [7]. Related
Attribution (CC BY) license (https://
                                             to anthocyanins are 3-deoxyanthocyanidins, found in mosses and ferns, sphagnorubins
creativecommons.org/licenses/by/
4.0/).
                                             found in peat moss [8,9], and auronidins (furanoflavylium derivatives) (Scheme 2) [10].

Int. J. Mol. Sci. 2021, 22, 3833. https://doi.org/10.3390/ijms22083833                                             https://www.mdpi.com/journal/ijms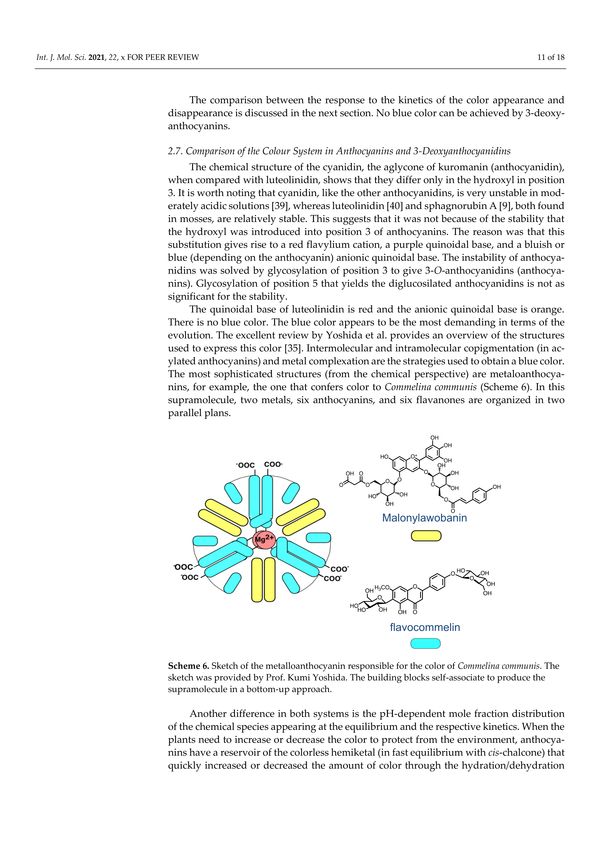
Int. J. Mol. Sci. 2021, 22, 3833                                                                                               2 of 18

                                   Andersen and Davies, questioned whether “auronidins might contribute to the remarkable
                                   ability of liverworts to survive in extreme environments on land, and their discovery calls
                                   into question the possible pigment status of the first land plants” [10].

                                   Scheme 1. Estimated origin of liverworts, mosses, ferns, and angiosperms. Jason Hollinger, Charles
                                   Peterson, Peter and Joyce Grace, Sarah Vanderweele, Camelia TWU, and Rafael Medina are credited
                                   for the photographs presented in Scheme 1, depicting several plant species.
Int. J. Mol. Sci. 2021, 22, 3833                                                                                                3 of 18

                                   Scheme 2. The flavylium cation of auronidins, 3-deoxyanthocyanins, sphagnorubins, and anthocyanins.

                                        We devoted the past two decades to the study of the kinetics and thermodynamics
                                   of the natural anthocyanins, 3-deoxyanthocyanins, and the related synthetic flavylium
                                   compounds. Following these studies, we investigated the kinetics and thermodynamics of
                                   furanoflavylium compounds [11,12] and, more recently, riccionidin A, the aglycone of the
                                   auronidin-20 -neohesperidoside reported by Andersen and Davies [10,13]. In this work we
                                   investigate the three color systems used by plants auronidins, 3-deoxyanthocyanins, and
                                   anthocyanins—providing physicochemical arguments to suggest that the three color sys-
                                   tems in these families of plants had a chemical evolution. Some similarities and differences
                                   between the three systems have previously been reported by some of the authors [13]. In
                                   this work, we focus essentially on the higher potentialities of the anthocyanin color system
                                   when compared to the other two systems. The newly reported theoretical corpus based
                                   on the reverse pH jumps followed by stopped flow, which has been used to characterize
                                   malvidin-3-O-glocoside (oenin) [14], was applied to cyanidin-3-O-glucoside (kuromanin).
                                   This work reflects the chemical aspects of the plants color systems and do not regards
                                   phylogenetic issues, which can be found in specialized publications [15,16].

                                   2. Results and Discussion
                                   2.1. The Color System of Anthocyanins. The Case of Cyanidin-3-O-Glucoside (Kuromanin)
                                        The color system of kuromanin is shown in Scheme 3.

                                   Scheme 3. Multistate of chemical species of the anthocyanin kuromanin in acidic medium. At
                                   sufficiently high proton concentrations, the system converges to the flavylium cation: Kn = kn /k−n
                                   (n = a, h, t, i).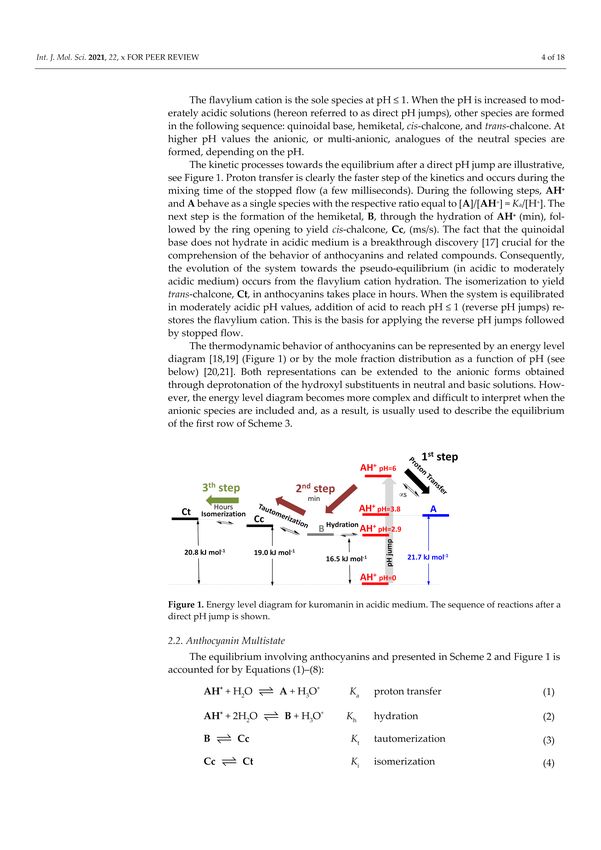
Int. J. Mol. Sci. 2021, 22, 3833                                                                                             4 of 18

                                        The flavylium cation is the sole species at pH ≤ 1. When the pH is increased to
                                   moderately acidic solutions (hereon referred to as direct pH jumps), other species are
                                   formed in the following sequence: quinoidal base, hemiketal, cis-chalcone, and trans-
                                   chalcone. At higher pH values the anionic, or multi-anionic, analogues of the neutral
                                   species are formed, depending on the pH.
                                        The kinetic processes towards the equilibrium after a direct pH jump are illustrative,
                                   see Figure 1. Proton transfer is clearly the faster step of the kinetics and occurs during the
                                   mixing time of the stopped flow (a few milliseconds). During the following steps, AH+
                                   and A behave as a single species with the respective ratio equal to [A]/[AH+ ] = Ka /[H+ ].
                                   The next step is the formation of the hemiketal, B, through the hydration of AH+ (min),
                                   followed by the ring opening to yield cis-chalcone, Cc, (ms/s). The fact that the quinoidal
                                   base does not hydrate in acidic medium is a breakthrough discovery [17] crucial for the
                                   comprehension of the behavior of anthocyanins and related compounds. Consequently,
                                   the evolution of the system towards the pseudo-equilibrium (in acidic to moderately acidic
                                   medium) occurs from the flavylium cation hydration. The isomerization to yield trans-
                                   chalcone, Ct, in anthocyanins takes place in hours. When the system is equilibrated in
                                   moderately acidic pH values, addition of acid to reach pH ≤ 1 (reverse pH jumps) restores
                                   the flavylium cation. This is the basis for applying the reverse pH jumps followed by
                                   stopped flow.

                                   Figure 1. Energy level diagram for kuromanin in acidic medium. The sequence of reactions after a
                                   direct pH jump is shown.

                                        The thermodynamic behavior of anthocyanins can be represented by an energy level
                                   diagram [18,19] (Figure 1) or by the mole fraction distribution as a function of pH (see
                                   below) [20,21]. Both representations can be extended to the anionic forms obtained through
                                   deprotonation of the hydroxyl substituents in neutral and basic solutions. However, the
                                   energy level diagram becomes more complex and difficult to interpret when the anionic
                                   species are included and, as a result, is usually used to describe the equilibrium of the first
                                   row of Scheme 3.

                                   2.2. Anthocyanin Multistate
                                       The equilibrium involving anthocyanins and presented in Scheme 2 and Figure 1 is
                                   accounted for by Equations (1)–(8):

                                                       AH+ + H2 O       A + H3 O +         Ka    proton transfer                (1)

                                                         AH+ + 2H2 O       B + H3 O+            Kh   hydration                  (2)
                                                                 B    Cc      Kt        tautomerization                         (3)
                                                                 Cc   Ct           Ki     isomerization                         (4)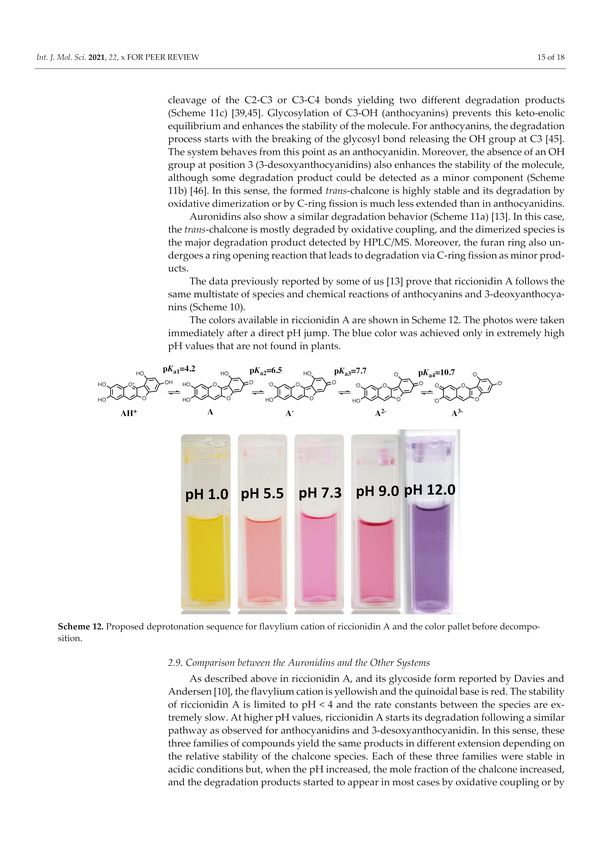
Int. J. Mol. Sci. 2021, 22, 3833                                                                                           5 of 18

                                       Extending to higher pH values:

                                                    A + H2 O      A− + H3 O+            KA/A−       proton transfer           (5)

                                                     B + H2 O      B− + H3 O+           KB/B−      proton transfer            (6)

                                                   Cc + H2 O      Cc− + H3 O+           KCc/Cc−       proton transfer         (7)

                                                   Ct + H2 O      Ct− + H3 O+           KCt/Ct−      proton transfer          (8)
                                       This complex system can be dramatically simplified to a polyprotic acid given by
                                   Equations (9)–(12):
                                                             AH+ + H2 O       CB + H3 O+
                                                                                                                     (9)
                                                            Ka0 = Ka + Kh + Kh Kt + Kh Kt Ki
                                                                    CB = [A] + [B] + [Cc] + [Ct]                            (10)
                                                                  CB + H2 O           CB− + H3 O+
                                                         00     KA/A− Ka +KB/B− Kh +KCc/Cc− Kh Kt +KCt/Ct− Kh Kt Ki         (11)
                                                       Ka =                           Ka0

                                                                CB− = [A− ] + [B− ] + [Cc− ] + [Ct− ]                       (12)
                                        The fact that this complex system can be simplified considering the flavylium cation
                                   in equilibrium with its conjugated forms CB and CB− allows the mathematical treatment
                                   to be simplified.
                                        In anthocyanins and many other flavylium-derived multistate of species, the iso-
                                   merization is clearly the slowest process of the kinetics and a pseudo-equilibrium can
                                   be defined as a transient state obtained before significant formation of trans-chalcone
                                   (Equations (1)–(3) and Equations (5)–(7)) and the respective pseudo-equilibrium constants
                                   defined by Equations (13)–(16):

                                                                  AH+ + H2 O           CB^ + H3 O+
                                                                                                                            (13)
                                                                        Ka^ = Ka + Kh + Kh Kt

                                                                        CB^ = [A] + [B] + [Cc]                              (14)
                                                                CB^ + H2 O            CB^− + H3 O+
                                                                         KA/A− Ka +KB/B− Kh +KCc/Cc− Kh Kt                  (15)
                                                               Ka^^ =                   Kˆa

                                                                   CB^− = [A− ] + [B− ] + [Cc− ]                            (16)
                                       During the 3rd step of the kinetics in Figure 1, all species except Ct are in equilibrium.

                                   2.3. How to Calculate All Equilibrium Constants. Reverse pH Jumps: A New Paradigm
                                         The most accurate method to determine the equilibrium constants reported in Scheme 3
                                   is based on the reverse pH jumps (defined by the addition of acid to ensure pH ≤ 1 of
                                   equilibrated solutions, or pseudo-equilibrated, at higher pH values) [22] monitored by
                                   stopped flow [23]. In Figure 2a, the trace of a typical reverse pH jump is shown. Three
                                   amplitudes are observed. The first is due to the flavylium cation absorption resulting from
                                   the conversion of all quinoidal bases (neutral and anionic) during the mixing time of the
                                   stopped flow together with some flavylium that is in equilibrium prior to the pH jump
                                   (for lower pH values). The amplitude of the faster kinetic step results from the conversion
                                   of hemiketal (neutral and anionic) into flavylium cation, because at pH ≤ 1 the change of
                                   regime causes the hydration/dehydration to be faster than the tautomerization [22,24]. The
                                   final amplitude corresponds to the formation of more flavylium cation from cis-chalcone
                                   (neutral and anionic) via hemiketal. Normalization of these amplitudes to the unit directly
                                   yields the mole fraction distribution of these species at the pseudo-equilibrium as shown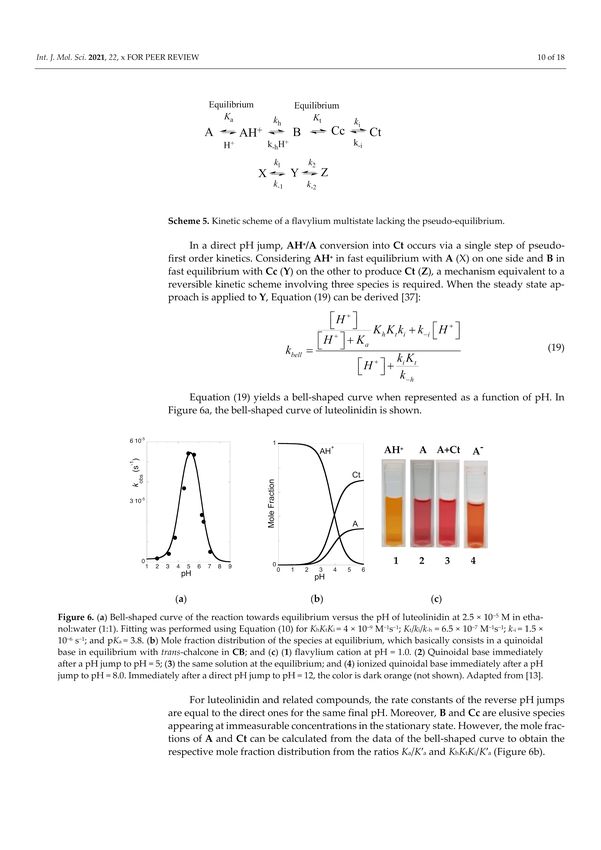
Int. J. Mol. Sci. 2021, 22, 3833                                                                                                    6 of 18

                                   in Figure 2b. The experimental data obtained for kuromanin in Figures 2 and 3 was used
                                   to calculate the equilibrium constants reported in Figure 1 according to the mathematical
                                   expressions derived in [23]. Once these constants were obtained, the energy level diagram
                                   can be constructed considering that ∆G◦ = RT lnK, where ∆G◦ is the Gibbs free energy,
                                   R is the ideal gas constant, T is the absolute temperature (Kelvin degrees), and K is the
                                   equilibrium constant of the chemical reaction [18,19].

                                   Figure 2. (a) Trace of a reverse pH jump of a pseudo-equilibrated solution of kuromanin at
                                   pH = 5.1 followed at 512 nm by stopped flow showing the three observed amplitudes; (b) mole
                                   fraction distribution at the pseudo-equilibrium, obtained after reverse pH jumps as in (a) for different
                                   pH values.

                                   Figure 3. (a) Trace of a reverse pH jump of an equilibrated solution of kuromanin at pH = 5.1 followed
                                   at 509 nm by standard spectrophotometer; (b) mole fraction distribution of trans-chalcone at the
                                   equilibrium; and (c) mole fraction distribution of all AH+ , CB, and CB− species at the equilibrium.

                                       The mole fraction of Ct and Ct− was calculated by following the reverse pH jumps
                                   through a standard spectrophotometer, as shown in Figure 3a. Extending to a series of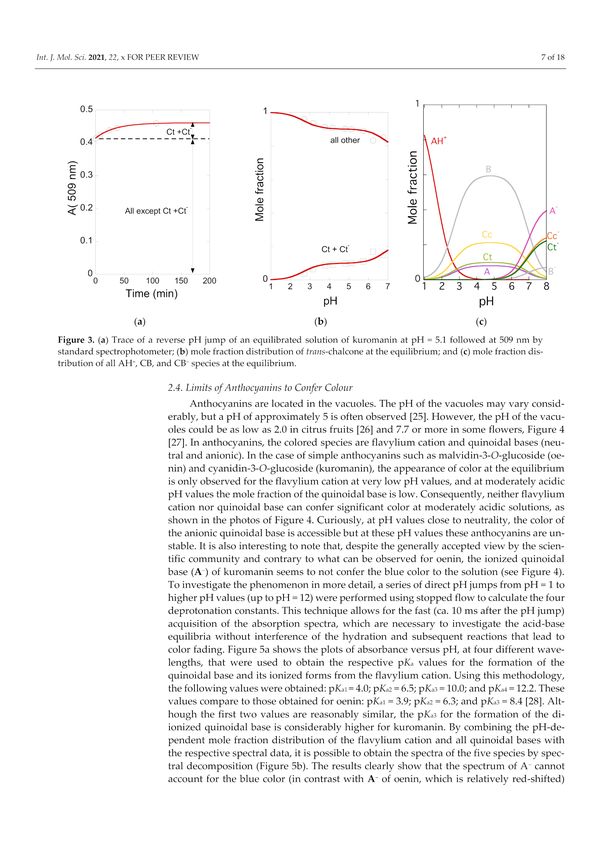
Int. J. Mol. Sci. 2021, 22, 3833                                                                                           7 of 18

                                   pH jumps from different pH values, the mole fraction distribution of Ct was calculated
                                   (Figure 3b), and the mole fractions of AH+ , A+A− , B+B− , and Cc+Cc− were recalculated
                                   for the equilibrium, discounting the equilibrium of Ct and Ct− (Figure 3c). Table 1 shows
                                   the equilibrium constants of kuromanin and the mole fraction distribution of all species at
                                   the equilibrium are presented in (Figure 3c). It should be emphasized that the constants
                                   regarding the anionic species have higher uncertainty because of the propagation of the
                                   error law (depending on the equilibrium constants of the neutral species) and due to the
                                   instability of the simpler anthocyanins at higher pH values, in particular, to determine the
                                   mole fractions of Ct.

                                   Table 1. Equilibrium constants of kuromanin.

                                        pK 0 a          pK^a            pKa                  Kh              Kt          Ki
                                         2.7             2.8             3.8         1.2 ×   10−3   M−1     0.36        0.50
                                       pKA/A−          pKB/B−         pKCc/Cc−          pKCt/Ct−
                                         6.15            7.8             6.8                 6.5

                                   2.4. Limits of Anthocyanins to Confer Colour
                                        Anthocyanins are located in the vacuoles. The pH of the vacuoles may vary consider-
                                   ably, but a pH of approximately 5 is often observed [25]. However, the pH of the vacuoles
                                   could be as low as 2.0 in citrus fruits [26] and 7.7 or more in some flowers, Figure 4 [27].
                                   In anthocyanins, the colored species are flavylium cation and quinoidal bases (neutral
                                   and anionic). In the case of simple anthocyanins such as malvidin-3-O-glucoside (oenin)
                                   and cyanidin-3-O-glucoside (kuromanin), the appearance of color at the equilibrium is
                                   only observed for the flavylium cation at very low pH values, and at moderately acidic
                                   pH values the mole fraction of the quinoidal base is low. Consequently, neither flavylium
                                   cation nor quinoidal base can confer significant color at moderately acidic solutions, as
                                   shown in the photos of Figure 4. Curiously, at pH values close to neutrality, the color
                                   of the anionic quinoidal base is accessible but at these pH values these anthocyanins are
                                   unstable. It is also interesting to note that, despite the generally accepted view by the
                                   scientific community and contrary to what can be observed for oenin, the ionized quinoidal
                                   base (A− ) of kuromanin seems to not confer the blue color to the solution (see Figure 4).
                                   To investigate the phenomenon in more detail, a series of direct pH jumps from pH = 1 to
                                   higher pH values (up to pH = 12) were performed using stopped flow to calculate the four
                                   deprotonation constants. This technique allows for the fast (ca. 10 ms after the pH jump)
                                   acquisition of the absorption spectra, which are necessary to investigate the acid-base
                                   equilibria without interference of the hydration and subsequent reactions that lead to color
                                   fading. Figure 5a shows the plots of absorbance versus pH, at four different wavelengths,
                                   that were used to obtain the respective pKa values for the formation of the quinoidal base
                                   and its ionized forms from the flavylium cation. Using this methodology, the following
                                   values were obtained: pKa1 = 4.0; pKa2 = 6.5; pKa3 = 10.0; and pKa4 = 12.2. These values
                                   compare to those obtained for oenin: pKa1 = 3.9; pKa2 = 6.3; and pKa3 = 8.4 [28]. Although
                                   the first two values are reasonably similar, the pKa3 for the formation of the di-ionized
                                   quinoidal base is considerably higher for kuromanin. By combining the pH-dependent
                                   mole fraction distribution of the flavylium cation and all quinoidal bases with the respective
                                   spectral data, it is possible to obtain the spectra of the five species by spectral decompo-
                                   sition (Figure 5b). The results clearly show that the spectrum of A− cannot account for
                                   the blue color (in contrast with A− of oenin, which is relatively red-shifted) and that this
                                   color can only be expressed by A2− and A3− , which appear only at very basic pH values.
                                   As these conditions do not seem feasible in biological systems, the results suggest that
                                   kuromanin can only express the blue color when complexed with metal cations or by
                                   another mechanism that may shift the third and fourth pKa to lower values.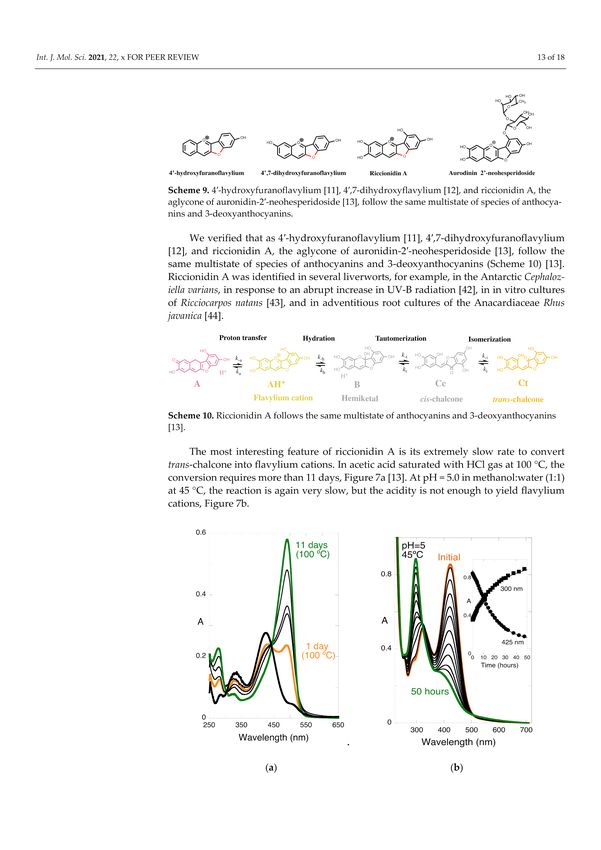
Int. J. Mol. Sci. 2021, 22, 3833                                                                                               8 of 18

                                   Figure 4. (a) Mole fractions at the pseudo-equilibrium of the colored forms of oenin (b) and kuro-
                                   manin; in this case the blue color is observed only for the dianionic quinoidal base (not shown).

                                   Figure 5. (a) Mole fraction distribution of the kuromanin (1.5 × 10⁻⁵ M) flavylium cation and
                                   quinoidal base species obtained 10 ms after a direct pH jump followed by stopped flow; pKa1 = 4.0;
                                   pKa2 = 6.5; pKa3 = 10.0; pKa4 = 12.2; (b) Spectral decomposition achieved for obtained pKa values.

                                         To overcome the limits of simpler anthocyanins to confer color, different strategies are
                                   used in nature. One of the most studied is copigmentation, defined by Robinson as the mod-
                                   ifications of the anthocyanin absorption spectrum caused by colorless compounds, such as
                                   amino acids, sugars, and flavonoids [1,2,29,30]. Copigmentation could be intermolecular
                                   and/or intramolecular, as observed in acylated anthocyanins [31–33]. Other strategies
                                   used in nature are self-association [34] and metal complexation [35]. Summarizing, the
                                   stabilization of the colored species is usually driven by several noncovalent interactions,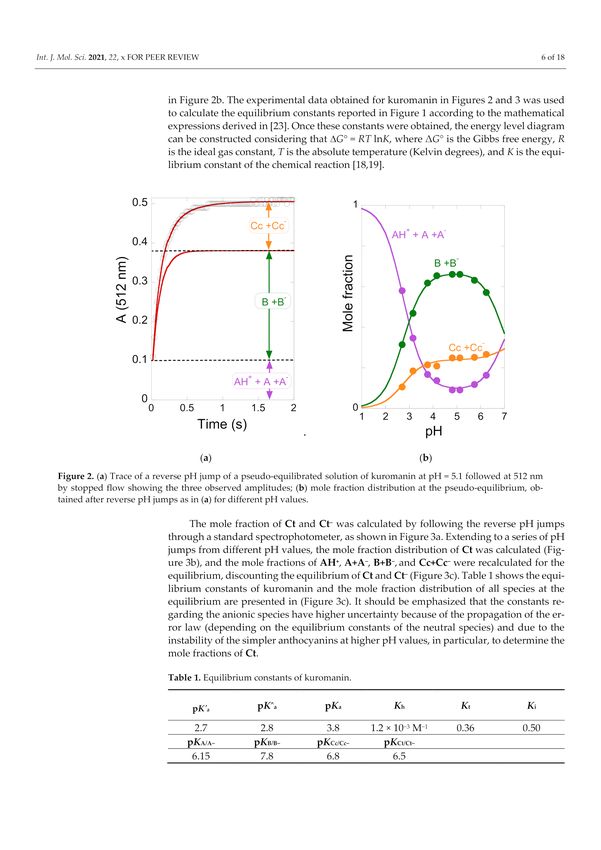
Int. J. Mol. Sci. 2021, 22, 3833                                                                                              9 of 18

                                   such as hydrogen bonding, van-der-Waals, π–π stacking, metal–ligand interactions, and
                                   hydrophobic-driven associations [33].

                                   2.5. The Kinetics of the Multistate
                                        The magnitude of the rates of the interconversion between the several species of
                                   the anthocyanins multistate is shown in Figure 1. After a direct pH jump, for example,
                                   to pH = 6, the quinoidal base is formed, with a rate that is faster than the mixing time
                                   of the stopped-flow, requiring other techniques, such as temperature jumps [17] or flash
                                   photolysis [36], to be observed. In the following kinetic steps AH+ and A are in equilibrium,
                                   at the respective ratio equal to [A]/[AH+ ] = Ka /[H+ ]. The disappearance of AH+ and A
                                   towards the equilibrium is a biexponential process in which the 2nd and 3rd steps exhibit
                                   different lifetimes, respectively minutes and hours. As the tautomerization is faster than
                                   the hydration at the pH values reached in direct pH jumps, the second step is controlled by
                                   the last.
                                        The expression that accounts for the 2nd step was achieved in a straightforward
                                   manner considering that the species AH+ and A on one side and B and Cc on the other are
                                   in fast equilibrium during the hydration step, in Equation (5) [37]:

                                                                                             [H+ ]           1
                                            k2nd(direct) = χ AH + k h + χ B k −h H + =                           k −h H +

                                                                                             +
                                                                                                     kh +                      (17)
                                                                                          [ H ] + Ka      1 + Kt

                                        Here, χ AH + and χ B are the mole fraction of AH+ in its equilibrium with A and the
                                   mole fraction of B in its equilibrium with Cc, respectively. At the end of the 2nd step, the
                                   system reaches the pseudo-equilibrium. The 3rd step is controlled by the isomerization
                                   and, due to the difference between the rates between of the 2nd and 3rd steps, AH+ , A, B,
                                   and Cc can be considered to be in equilibrium (that was defined as pseudo-equilibrium):

                                                                                             Kh Kt
                                                   k3rd(direct) = χCc k i + k −i =                          k i + k −i         (18)
                                                                                     [H+ ] + K
                                                                                             a + Kh + Kh Kt

                                   where χCc is the mole fraction of Cc at the pseudo-equilibrium.
                                        Some conclusions may be drawn regarding the thermodynamics and kinetics of the
                                   anthocyanin system. At the equilibrium, the red, purple, and blue colors are potentially
                                   available, but some strategies should be used by the plants to give expression to these
                                   colors; for example, intramolecular and/or intermolecular copigmentation in acylated
                                   anthocyanins and supramolecular structures such as the one that gives the blue color to
                                   Commelina communis, as reported by Nagoya’s group [35,38].

                                   2.6. The Colour System of 3-deoxyanthocyanins
                                        As shown in Scheme 4, 3-deoxyanthocyanins follow the same multistate of species
                                   of anthocyanins but the isomerization is not the slowest kinetic step towards equilibrium.
                                   The situation is summarized in Scheme 5 [37].

                                   Scheme 4. Kinetic scheme of luteolinidin.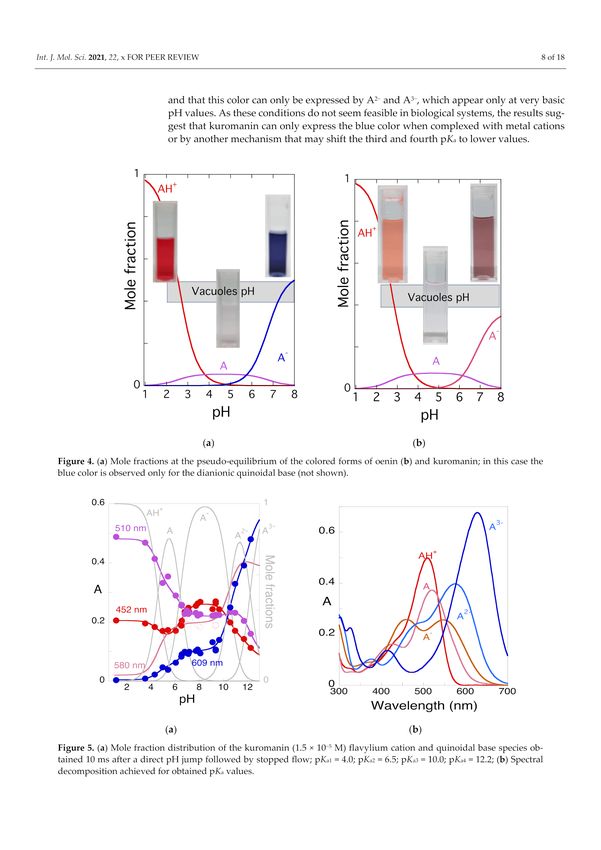
Int. J. Mol. Sci. 2021, 22, 3833                                                                                                 10 of 18

                                   Scheme 5. Kinetic scheme of a flavylium multistate lacking the pseudo-equilibrium.

                                        In a direct pH jump, AH+ /A conversion into Ct occurs via a single step of pseudo-first
                                   order kinetics. Considering AH+ in fast equilibrium with A (X) on one side and B in
                                   fast equilibrium with Cc (Y) on the other to produce Ct (Z), a mechanism equivalent to
                                   a reversible kinetic scheme involving three species is required. When the steady state
                                   approach is applied to Y, Equation (19) can be derived [37]:

                                                                                [ H+ ]
                                                                                       K Kk
                                                                             [ H + ]+Ka h t i
                                                                                                + k −i [ H + ]
                                                                  k bell =                      k i Kt
                                                                                                                                    (19)
                                                                                    [H+ ] +     k −h

                                       Equation (19) yields a bell-shaped curve when represented as a function of pH. In
                                   Figure 6a, the bell-shaped curve of luteolinidin is shown.

                                   Figure 6. (a) Bell-shaped curve of the reaction towards equilibrium versus the pH of luteolin-
                                   idin at 2.5 × 10⁻⁵ M in ethanol:water (1:1). Fitting was performed using Equation (10) for
                                   Kh Kt Ki = 4 × 10⁻⁹ M−1 s−1 ; Kt /ki /k-h = 6.5 × 10⁻⁷ M−1 s−1 ; k-i = 1.5 × 10⁻⁶ s−1 ; and pKa = 3.8.
                                   (b) Mole fraction distribution of the species at equilibrium, which basically consists in a quinoidal
                                   base in equilibrium with trans-chalcone in CB; and (c) (1) flavylium cation at pH = 1.0. (2) Quinoidal
                                   base immediately after a pH jump to pH = 5; (3) the same solution at the equilibrium; and (4) ionized
                                   quinoidal base immediately after a pH jump to pH = 8.0. Immediately after a direct pH jump to
                                   pH = 12, the color is dark orange (not shown). Adapted from [13].

                                         For luteolinidin and related compounds, the rate constants of the reverse pH jumps
                                   are equal to the direct ones for the same final pH. Moreover, B and Cc are elusive species
                                   appearing at immeasurable concentrations in the stationary state. However, the mole
                                   fractions of A and Ct can be calculated from the data of the bell-shaped curve to obtain the
                                   respective mole fraction distribution from the ratios Ka /K0 a and Kh Kt Ki /K0 a (Figure 6b).
                                         The comparison between the response to the kinetics of the color appearance and disap-
                                   pearance is discussed in the next section. No blue color can be achieved by 3-deoxyanthocyanins.
Int. J. Mol. Sci. 2021, 22, 3833 11 of 18
2.7. Comparison of the Colour System in Anthocyanins and 3-Deoxyanthocyanidins
The chemical structure of the cyanidin, the aglycone of kuromanin (anthocyanidin),
when compared with luteolinidin, shows that they differ only in the hydroxyl in posi-
tion 3. It is worth noting that cyanidin, like the other anthocyanidins, is very unstable
in moderately acidic solutions [39], whereas luteolinidin [40] and sphagnorubin A [9],
both found in mosses, are relatively stable. This suggests that it was not because of the
stability that the hydroxyl was introduced into position 3 of anthocyanins. The reason
was that this substitution gives rise to a red flavylium cation, a purple quinoidal base, and
a bluish or blue (depending on the anthocyanin) anionic quinoidal base. The instability
of anthocyanidins was solved by glycosylation of position 3 to give 3-O-anthocyanidins
(anthocyanins). Glycosylation of position 5 that yields the diglucosilated anthocyanidins is
not as significant for the stability.
The quinoidal base of luteolinidin is red and the anionic quinoidal base is orange.
There is no blue color. The blue color appears to be the most demanding in terms of the
evolution. The excellent review by Yoshida et al. provides an overview of the structures
used to express this color [35]. Intermolecular and intramolecular copigmentation (in
acylated anthocyanins) and metal complexation are the strategies used to obtain a blue
color. The most sophisticated structures (from the chemical perspective) are metaloantho-
cyanins, for example, the one that confers color to Commelina communis (Scheme 6). In
this supramolecule, two metals, six anthocyanins, and six flavanones are organized in two
parallel plans.
Scheme 6. Sketch of the metalloanthocyanin responsible for the color of Commelina communis. The
sketch was provided by Prof. Kumi Yoshida. The building blocks self-associate to produce the
supramolecule in a bottom-up approach.
Another difference in both systems is the pH-dependent mole fraction distribution of
the chemical species appearing at the equilibrium and the respective kinetics. When the
plants need to increase or decrease the color to protect from the environment, anthocyanins
have a reservoir of the colorless hemiketal (in fast equilibrium with cis-chalcone) that
quickly increased or decreased the amount of color through the hydration/dehydration
reaction (Scheme 7). In contrast, 3-deoxyanthocyanins have equilibrium between the
colored species flavylium cation/quinoidal base and trans-chalcone (Scheme 8). The
appearance/disappearance of color takes place through the interconversion of AH+ /A and
Ct and follows the kinetic curve of Figure 6a, whereas in anthocyanins it is the much faster
hydration reaction that controls this process.Int. J. Mol. Sci. 2021, 22, 3833 12 of 18
Scheme 7. Conversion rates between the colorless reservoir in anthocyanins and the colored species.
Scheme 8. In 3-deoxyanthocyanins there is no reservoir of colorless species. B and Cc are the steady
state species with undetectable concentrations during the kinetics between the colored species and Ct.
2.8. The Colour System of Auronidins
Auronidin-20 -neohesperidoside was extracted from the liverwort Marchantia polymor-
pha by Davies and Andersen [10], who named these molecules auronidins. In recent years,
we studied the thermodynamics and kinetics of the so-called furanoflavylium compounds,
a term used by Seshadri to designate the compounds shown in Scheme 9 [41].
Scheme 9. 40 -hydroxyfuranoflavylium [11], 40 ,7-dihydroxyflavylium [12], and riccionidin A, the
aglycone of auronidin-20 -neohesperidoside [13], follow the same multistate of species of anthocyanins
and 3-deoxyanthocyanins.
We verified that as 40 -hydroxyfuranoflavylium [11], 40 ,7-dihydroxyfuranoflavylium [12],
and riccionidin A, the aglycone of auronidin-20 -neohesperidoside [13], follow the sameInt. J. Mol. Sci. 2021, 22, 3833 13 of 18
multistate of species of anthocyanins and 3-deoxyanthocyanins (Scheme 10) [13]. Riccioni-
din A was identified in several liverworts, for example, in the Antarctic Cephaloziella varians,
in response to an abrupt increase in UV-B radiation [42], in in vitro cultures of Ricciocarpos
natans [43], and in adventitious root cultures of the Anacardiaceae Rhus javanica [44].
Scheme 10. Riccionidin A follows the same multistate of anthocyanins and 3-deoxyanthocyanins [13].
The most interesting feature of riccionidin A is its extremely slow rate to convert
trans-chalcone into flavylium cations. In acetic acid saturated with HCl gas at 100 ◦ C, the
conversion requires more than 11 days, Figure 7a [13]. At pH = 5.0 in methanol:water (1:1)
at 45 ◦ C, the reaction is again very slow, but the acidity is not enough to yield flavylium
cations, Figure 7b.
Figure 7. (a) Conversion of the trans-chalcone of riccionidin A in acetic acid saturated with HCl gas
at 100 ◦ C. (b) Spectral variations of the trans-chalcone at pH = 5.0 in methanol:water (1:1) at 45 ◦ C,
[Ct]= 5.0 × 10⁻⁵ M. The same behavior is observed in the pH range 1 < pH < 6. Adapted from [13].
It was possible to identify the species AH+ , A, B, Cc, and Ct by HPLC/MS [13] before
decomposition (Scheme 11a) confirming that the multistate of species is the same as that
of anthocyanins (Scheme 11c) and 3-deoxyanthocyanins (Scheme 11b). Moreover, the
degradation products of these three families appeared to be similar (Scheme 11).Int. J. Mol. Sci. 2021, 22, 3833 14 of 18
Scheme 11. Thermal degradation pathways of (a) anthocyanidins, (b) 3-deoxyanthocyanidins, and
(c) auronidins.
The degradation process of anthocyanidins starts with the keto-enol equilibrium
involving C3-OH in hemiketal and chalcones species. The formation of the α-diketone
species from the chalcones allows the easily oxidative C-ring fission of the molecule by
the cleavage of the C2-C3 or C3-C4 bonds yielding two different degradation products
(Scheme 11c) [39,45]. Glycosylation of C3-OH (anthocyanins) prevents this keto-enolic
equilibrium and enhances the stability of the molecule. For anthocyanins, the degradation
process starts with the breaking of the glycosyl bond releasing the OH group at C3 [45]. TheInt. J. Mol. Sci. 2021, 22, 3833 15 of 18
system behaves from this point as an anthocyanidin. Moreover, the absence of an OH group
at position 3 (3-desoxyanthocyanidins) also enhances the stability of the molecule, although
some degradation product could be detected as a minor component (Scheme 11b) [46]. In
this sense, the formed trans-chalcone is highly stable and its degradation by oxidative
dimerization or by C-ring fission is much less extended than in anthocyanidins.
Auronidins also show a similar degradation behavior (Scheme 11a) [13]. In this
case, the trans-chalcone is mostly degraded by oxidative coupling, and the dimerized
species is the major degradation product detected by HPLC/MS. Moreover, the furan
ring also undergoes a ring opening reaction that leads to degradation via C-ring fission as
minor products.
The data previously reported by some of us [13] prove that riccionidin A follows the
same multistate of species and chemical reactions of anthocyanins and 3-deoxyanthocyanins
(Scheme 10).
The colors available in riccionidin A are shown in Scheme 12. The photos were taken
immediately after a direct pH jump. The blue color was achieved only in extremely high
pH values that are not found in plants.
Scheme 12. Proposed deprotonation sequence for flavylium cation of riccionidin A and the color
pallet before decomposition.
2.9. Comparison between the Auronidins and the Other Systems
As described above in riccionidin A, and its glycoside form reported by Davies and
Andersen [10], the flavylium cation is yellowish and the quinoidal base is red. The stability
of riccionidin A is limited to pH < 4 and the rate constants between the species are extremely
slow. At higher pH values, riccionidin A starts its degradation following a similar pathway
as observed for anthocyanidins and 3-desoxyanthocyanidin. In this sense, these three
families of compounds yield the same products in different extension depending on the
relative stability of the chalcone species. Each of these three families were stable in acidic
conditions but, when the pH increased, the mole fraction of the chalcone increased, and the
degradation products started to appear in most cases by oxidative coupling or by C-ring
fission degradation. As a suggestion for future work, it would be interesting to verify
if auronidins are able to form associations by copigmentation or yield metal complexes,
because there is a catechol in ring A that could link to metals. The furano ring prevents the
attachment of the sugar in position 3 and the glycosylation occurs in position 20 . Synthetic
flavylium compounds bearing a hydroxyl in position 20 are able to form flavanones fromInt. J. Mol. Sci. 2021, 22, 3833 16 of 18
the mono-anionic chalcones [47]. Another perspective for future studies would be to
compare the Davies and Andersen auronidin-20 -neohesperidoside [10] with the results
obtained for riccionidin A, and to identify the role of the sugar.
3. Experimental
Thermodynamic and Kinetic Studies
The direct pH jumps were carried out by mixing a stock solution of kuromanin in HCl
0.1 M (3 × 10⁻⁵ M) with a solution containing NaOH 0.1 M and Theorell and Stenhagen
universal buffer at the desired final pH using the stopped flow (SX20, Applied Photo-
physics; Surrey, UK) spectrometer equipped with a PDA.1/UV photodiode array detector.
The direct pH jumps were also carried out by adding a small aliquot of a concentrated
stock solution of the anthocyanin (pH = 1) into a 3 mL cuvette with water, with enough
NaOH to neutralize the stock solution’s acid, and universal buffer at the desired final pH.
Spectroscopic measurements were performed using Milli-Q water at a constant temper-
ature of 20 ± 1 ◦ C using Varian-Cary 100 Bio or Varian-Cary 5000 spectrophotometers.
Reverse pH jumps were carried out by stopped flow (pseudo-equilibrated solutions) and
common spectrophotometer (equilibrated solutions), adding enough HCl to reach pH = 1 in
equilibrated solution of the anthocyanidin/anthocyanin at different pH values. The final
pH of the solutions was measured in a Radiometer Copenhagen PHM240 pH/ion meter
(Brønshøj, Denmark).
4. Conclusions
The physical chemistry of riccionidin A and 3-deoxyanthocyanins unequivocally
shows that the former was significantly less versatile than the latter. Although anthocyanins
are limited a priori to express color by themselves, they have a complete color pallet
available and can give expression to these colors by means of intra- and intermolecular
copigmentation, coordination with metals, and the combination of these effects, as in the
case of metalloanthocyanins. It is clear that the color systems have evolved from auronidins
to 3-deoxyanthocyanins to anthocyanins, by widening the color range they can cover. We
hope the results reported in this work can contribute to the current discussion regarding
the phylogenetic hypotheses about the divergence between mosses and liverworts, and
between this group and vascular plants.
Author Contributions: Conceptualization, F.P. and A.J.P.; methodology, F.P., J.M. and N.B.; validation,
F.P., A.A.-A., A.C., J.M., N.B. and A.J.P.; formal analysis, F.P., J.M. and A.S.; investigation, A.A.-A., J.M.
and A.S.; resources, F.P., N.B. and A.J.P.; writing—original draft preparation, F.P. and A.C.; writing—
review and editing, A.A.-A., A.C., J.M., N.B. and A.J.P.; visualization, F.P., A.A.-A., A.C., J.M., A.S.
and A.J.P.; supervision, F.P. and A.J.P.; project administration, F.P., N.B. and A.J.P.; funding acquisition,
N.B. and A.J.P. All authors have read and agreed to the published version of the manuscript.
Funding: This research was funded by the Associated Laboratory for Sustainable Chemistry, Clean
Processes and Technologies LAQV through national funds from UIDB/50006/2020. N.B. acknowl-
edges FCT for the contract CEECIND/00466/2017. A.A.-A. is grateful for the post-doctoral fellow-
ship from Fundación Alfonso Martín Escudero and A.S. acknowledges his doctoral grant from FCT
(2020.07313.BD).
Conflicts of Interest: The authors declare no conflict of interest.
References
1. Morris, J.L.; Puttick, M.N.; Clark, J.W.; Edwards, D.; Kenrick, P.; Pressel, S.; Wellman, C.H.; Yang, Z.; Schneider, H.;
Donoghue, P.C.J. The timescale of early land plant evolution. Proc. Natl. Acad. Sci. USA 2018, 115, E2274–E2283. [CrossRef]
[PubMed]
2. Heinrichs, J.; Hentschel, J.; Wilson, R.; Feldberg, K.; Schneider, H. Evolution of leafy liverworts (Jungermanniidae, Marchantio-
phyta): Estimating divergence times from chloroplast DNA sequences using penalized likelihood with integrated fossil evidence.
Taxon 2007, 56, 31–44. [CrossRef]
3. Cooper, E.D.; Henwood, M.J.; Brown, E.A. Are the liverworts really that old? Cretaceous origins and Cenozoic diversifications in
Lepidoziaceae reflect a recurrent theme in liverwort evolution. Biol. J. Linn. Soc. 2012, 107, 425–441. [CrossRef]Int. J. Mol. Sci. 2021, 22, 3833 17 of 18
4. Puttick, M.N.; Morris, J.L.; Williams, T.A.; Cox, C.J.; Edwards, D.; Kenrick, P.; Pressel, S.; Wellman, C.H.; Schneider, H.;
Pisani, D.; et al. The interrelationships of land plants and the nature of the ancestral embryophyte. Curr. Biol. 2018, 28, 733–745.e2.
[CrossRef] [PubMed]
5. Pryer, K.M.; Schuettpelz, E.; Wolf, P.G.; Schneider, H.; Smith, A.R.; Cranfill, R. Phylogeny and evolution of ferns (monilophytes)
with a focus on the early leptosporangiate divergences. Am. J. Bot. 2004, 91, 1582–1598. [CrossRef]
6. Herendeen, P.S.; Friis, E.M.; Pedersen, K.R.; Crane, P.R. Palaeobotanical redux: Revisiting the age of the angiosperms. Nat. Plants
2017, 3, 17015. [CrossRef]
7. Clifford, M.N. Anthocyanins—Nature, occurrence and dietary burden. J. Sci. Food Agric. 2000, 80, 1063–1072. [CrossRef]
8. Vowinkel, E. Cell-wall pigments of peat mosses. 2. Structure of sphagnorubin. Chem. Ber. Recl. 1975, 108, 1166–1181. [CrossRef]
9. Berland, H.; Andersen, Ø.M. Characterization of a natural, stable, reversible and colourful anthocyanidin network from sphagnum
moss based mainly on the yellow trans-chalcone and red flavylium cation forms. Molecules 2021, 26, 709. [CrossRef]
10. Berland, H.; Albert, N.W.; Stavland, A.; Jordheim, M.; McGhie, T.K.; Zhou, Y.; Zhang, H.; Deroles, S.C.; Schwinn, K.E.;
Jordan, B.R.; et al. Auronidins are a previously unreported class of flavonoid pigments that challenges when anthocyanin
biosynthesis evolved in plants. Proc. Natl. Acad. Sci. USA 2019, 116, 20232–20239. [CrossRef]
11. Alejo-Armijo, A.; Parola, A.J.; Pina, F. pH-dependent multistate system generated by a synthetic Furanoflavylium compound: An
ancestor of the anthocyanin multistate of chemical species. ACS Omega 2019, 4, 4091–4100. [CrossRef]
12. Alejo-Armijo, A.; Basilio, N.; Freitas, A.A.; Maçanita, A.L.; Lima, J.C.; Parola, A.J.; Pina, F. Ground and excited state properties of
furanoflavylium derivatives. Phys. Chem. Chem. Phys. 2019, 21, 21651–21662. [CrossRef]
13. Alejo-Armijo, A.; Mendoza, J.; Parola, A.J.; Pina, F. Chemical evolution of the colour systems generated by riccionidin A,
3-deoxyanthocyanidins and anthocyanins. Phytochemistry 2020, 174, 11. [CrossRef]
14. Oliveira, J.; Azevedo, J.; Teixeira, N.; Araújo, P.; de Freitas, V.; Basílio, N.; Pina, F. On the limits of anthocyanins co-pigmentation
models and respective equations. J. Agric. Food Chem. 2021, 69, 1359–1367. [CrossRef]
15. Piatkowski, B.T.; Imwattana, K.; Tripp, E.A.; Weston, D.J.; Healey, A.; Schmutz, J.; Shaw, A.J. Phylogenomics reveals convergent
evolution of red-violet coloration in land plants and the origins of the anthocyanin biosynthetic pathway. Mol. Phylogenet. Evol.
2020, 151, 106904. [CrossRef]
16. Davies, K.M.; Jibran, R.; Zhou, Y.; Albert, N.W.; Brummell, D.A.; Jordan, B.R.; Bowman, J.L.; Schwinn, K.E. The evolution of
flavonoid biosynthesis: A bryophyte perspective. Front. Plant Sci. 2020, 11, 7. [CrossRef]
17. Brouillard, R.; Dubois, J.-E. Mechanism of the structural transformations of anthocyanins in acidic media. J. Am. Chem. Soc. 1977,
99, 1359–1364. [CrossRef]
18. Pina, F.; Melo, M.J.; Maestri, M.; Ballardini, R.; Balzani, V. Photochromism of 40 -Methoxyflavylium Perchlorate. A
“write−lock−read−unlock−erase” molecular switching system. J. Am. Chem. Soc. 1997, 119, 5556–5561. [CrossRef]
19. Basílio, N.; Pina, F. Chemistry and photochemistry of anthocyanins and related compounds: A thermodynamic and kinetic
approach. Molecules 2016, 21, 1502. [CrossRef]
20. Brouillard, R.; Iacobucci, G.A.; Sweeny, J.G. Chemistry of anthocyanin pigments. UV-visible spectrophotometric determination of
the acidity constants of apigeninidin and three related 3-deoxyflavylium salts. J. Am. Chem. Soc. 1982, 104, 7585–7590. [CrossRef]
21. Brouillard, R.; Delaporte, B.; Dubois, J.E. Chemistry of anthocyanin pigments. Relaxation amplitudes in pH-jump experiments. J.
Am. Chem. Soc. 1978, 100, 6202–6205. [CrossRef]
22. McClelland, R.A.; Gedge, S. Hydration of the flavylium ion. J. Am. Chem. Soc. 1980, 102, 5838–5848. [CrossRef]
23. Mendoza, J.; Basílio, N.; De Freitas, V.; Pina, F. New procedure to calculate all equilibrium constants in flavylium compounds:
Application to the copigmentation of anthocyanins. ACS Omega 2019, 4, 12058–12070. [CrossRef] [PubMed]
24. Pina, F. Anthocyanins and related compounds. Detecting the change of regime between rate control by hydration or by
tautomerization. Dye. Pigment. 2014, 102, 308–314. [CrossRef]
25. Felle, H.H. pH Regulation in anoxic plants. Ann. Bot. 2005, 96, 519–532. [CrossRef] [PubMed]
26. Echeverria, E.; Burns, J.; Felle, H. Compartmentation and cellular conditions controlling sucrose breakdown in mature acid lime
fruits. Phytochemistry 1992, 31, 4091–4095. [CrossRef]
27. Yoshida, K.; Kondo, T.; Okazaki, Y.; Katou, K. Cause of blue petal colour. Nature 1995, 373, 291. [CrossRef]
28. Araújo, P.; Basílio, N.; Fernandes, A.; Mateus, N.; De Freitas, V.; Piña, F.; Oliveira, J. Impact of lignosulfonates on the ther-
modynamic and kinetic parameters of malvidin-3-o-glucoside in aqueous solutions. J. Agric. Food Chem. 2018, 66, 6382–6387.
[CrossRef]
29. Trouillas, P.; Sancho-Garcia, J.-C.; De Freitas, V.; Gierschner, J.; Otyepka, M.; Dangles, O. Stabilizing and modulating color by
copigmentation: Insights from theory and experiment. Chem. Rev. 2016, 116, 4937–4982. [CrossRef]
30. Robinson, G.M.; Robinson, R. A survey of anthocyanins. I. Biochem. J. 1931, 25, 1687–1705. [CrossRef]
31. Müller-Maatsch, J.; Bechtold, L.; Schweiggert, R.M.; Carle, R. Co-pigmentation of pelargonidin derivatives in strawberry and red
radish model solutions by the addition of phenolic fractions from mango peels. Food Chem. 2016, 213, 625–634. [CrossRef]
32. Iwashina, T. Contribution to flower colors of flavonoids including anthocyanins: A review. Nat. Prod. Commun. 2015, 10, 529–544.
[CrossRef]
33. Mendoza, J.; Oliveira, J.; Araújo, P.; Basílio, N.; Teixeira, N.; Brás, N.F.; Pina, F.; Yoshida, K.; De Freitas, V. The peculiarity of
malvidin 3-O-(6-O-p-coumaroyl) glucoside aggregation. Intra and intermolecular interactions. Dye. Pigment. 2020, 180, 108382.
[CrossRef]Int. J. Mol. Sci. 2021, 22, 3833 18 of 18
34. Qian, B.-J.; Liu, J.-H.; Zhao, S.-J.; Cai, J.-X.; Jing, P. The effects of gallic/ferulic/caffeic acids on colour intensification and
anthocyanin stability. Food Chem. 2017, 228, 526–532. [CrossRef]
35. Yoshida, K.; Mori, M.; Kondo, T. Blue flower color development by anthocyanins: From chemical structure to cell physiology. Nat.
Prod. Rep. 2009, 26, 884–915. [CrossRef]
36. Maçanita, A.L.; Moreira, P.F.; Lima, J.C.; Quina, F.H.; Yihwa, C.; Vautier-Giongo, C. Proton transfer in anthocyanins and related
flavylium salts. determination of ground-state rate constants with nanosecond laser flash photolysis. J. Phys. Chem. A 2002, 106,
1248–1255. [CrossRef]
37. Pina, F. Chemical applications of anthocyanins and related compounds. a source of bioinspiration. J. Agric. Food Chem. 2014, 62,
6885–6897. [CrossRef]
38. Hondo, T.; Yoshida, K.; Nakagawa, A.; Kawai, T.; Tamura, H.; Goto, T. Structural basis of blue-colour development in flower
petals from Commelina communis. Nature 1992, 358, 515–518. [CrossRef]
39. Cabrita, L.; Petrov, V.; Pina, F. On the thermal degradation of anthocyanidins: Cyanidin. RSC Adv. 2014, 4, 18939–18944. [CrossRef]
40. Melo, M.J.; Moura, S.; Roque, A.; Maestri, M.; Pina, F. Photochemistry of luteolinidin—“Write-lock-read-unlock-erase” with a
natural compound. J. Photochem. Photobiol. A Chem. 2000, 135, 33–39. [CrossRef]
41. Chakravarty, G.; Seshadri, T.R. Study of 3,2-furanoflavylium chlorides. Indian J. Chem. 1964, 2, 319.
42. Snell, K.R.S.; Kokubun, T.; Griffiths, H.; Convey, P.; Hodgson, D.A.; Newsham, K.K. Quantifying the metabolic cost to an Antarctic
liverwort of responding to an abrupt increase in UVB radiation exposure. Glob. Chang. Biol. 2009, 15, 2563–2573. [CrossRef]
43. Kunz, S.; Becker, H. Cell Wall pigment formation of in vitro cultures of the liverwort Ricciocarpos natans. Z. Nat. C 1995, 50,
235–240. [CrossRef]
44. Taniguchi, S.; Yazaki, K.; Yabu-Uchi, R.; Kawakami, K.-Y.; Ito, H.; Hatano, T.; Yoshida, T. Galloylglucoses and riccionidin A in
Rhus javanica adventitious root cultures. Phytochemistry 2000, 53, 357–363. [CrossRef]
45. Wang, F.; Li, H.; Qin, Y.; Mao, Y.; Zhang, B.; Deng, Z. Effects of heat, ultrasound, and microwave processing on the stability and
antioxidant activity of delphinidin and petunidin. J. Food Biochem. 2019, 43, e12818. [CrossRef] [PubMed]
46. Yang, L.; Dykes, L.; Awika, J.M. Thermal stability of 3-deoxyanthocyanidin pigments. Food Chem. 2014, 160, 246–254. [CrossRef]
[PubMed]
47. Petrov, V.; Gomes, R.; Parola, A.J.; Jesus, A.; Laia, C.A.; Pina, F. 20 -Hydroxyflavylium: Introducing flavanones into the flavylium
network of chemical reactions. Tetrahedron 2008, 64, 714–720. [CrossRef]You can also read