The Role of Co-Deleted Genes in Neurofibromatosis Type 1 Microdeletions: An Evolutive Approach - MDPI
←
→
Page content transcription
If your browser does not render page correctly, please read the page content below
G C A T
T A C G
G C A T
           genes
Article
The Role of Co-Deleted Genes in Neurofibromatosis
Type 1 Microdeletions: An Evolutive Approach
Larissa Brussa Reis 1,2 , Andreia Carina Turchetto-Zolet 2 , Maievi Fonini 1 ,
Patricia Ashton-Prolla 1,2,3 and Clévia Rosset 1, *
 1   Laboratório de Medicina Genômica, Centro de Pesquisa Experimental, Hospital de Clínicas de Porto Alegre,
     Porto Alegre, Rio Grande do Sul 90035-903, Brazil; brussareis@gmail.com (L.B.R.);
     maievifonini@hotmail.com (M.F.); pprolla@gmail.com (P.A.-P.)
 2   Programa de Pós-Graduação em Genética e Biologia Molecular, Departamento de Genética, UFRGS,
     Porto Alegre, Rio Grande do Sul 91501-970, Brazil; aturchetto@gmail.com
 3   Serviço de Genética Médica do Hospital de Clínicas de Porto Alegre (HCPA), Porto Alegre,
     Rio Grande do Sul 90035-903, Brazil
 *   Correspondence: crosset@hcpa.edu.br; Tel.: +55-51-3359-7661

 Received: 28 June 2019; Accepted: 16 September 2019; Published: 24 October 2019

 Abstract: Neurofibromatosis type 1 (NF1) is a cancer predisposition syndrome that results from
 dominant loss-of-function mutations mainly in the NF1 gene. Large rearrangements are present in
 5–10% of affected patients, generally encompass NF1 neighboring genes, and are correlated with
 a more severe NF1 phenotype. Evident genotype–phenotype correlations and the importance of
 the co-deleted genes are difficult to establish. In our study we employed an evolutionary approach
 to provide further insights into the understanding of the fundamental function of genes that are
 co-deleted in subjects with NF1 microdeletions. Our goal was to access the ortholog and paralog
 relationship of these genes in primates and verify if purifying or positive selection are acting on
 these genes. Fourteen genes were analyzed in twelve mammalian species. Of these, four and ten
 genes showed positive selection and purifying selection, respectively. The protein, RNF135, showed
 three sites under positive selection at the RING finger domain, which may have been selected to
 increase efficiency in ubiquitination routes in primates. The phylogenetic analysis suggests distinct
 evolutionary constraint between the analyzed genes. With these analyses, we hope to help clarify the
 correlation of the co-deletion of these genes and the more severe phenotype of NF1.

 Keywords: genotype–phenotype correlations;               microdeletions;     neurofibromatosis type 1;
 phylogenetic analysis

1. Introduction
     Neurofibromatosis type 1 (NF1) (OMIM # 162200) is an autosomal dominant tumor predisposition
syndrome affecting both sexes in all ethnic groups, with an estimated incidence of one per 3000 [1].
NF1 results from dominant loss-of-function (haploinsufficiency) mutations mainly in the NF1 gene,
but this is not the only mutational event that explains the phenotype. NF1 clinical diagnosis is based
on criteria approved by the National Institutes of Health Consensus Development Conference [2].
The NF1 phenotype is extremely variable and one possible explanation for this variation is a large
number of different mutations in different regions of the NF1 gene [3]. Nearly 20% of NF1 mutations
are single or multiexon deletions or duplications; 5–10% of these NF1 deletions are known as
microdeletions, surrounding NF1 and its bordering genes. Four types of microdeletions (type 1, 2, 3,
and atypical) have been identified and are different in breakpoint location and size [4]. Patients with
microdeletions have been described to have a higher risk of malignant peripheral nerve sheath

Genes 2019, 10, 839; doi:10.3390/genes10110839                                     www.mdpi.com/journal/genes
Genes 2019, 10, 839 2 of 13
tumors, lower average intelligence, connective tissue dysplasia, skeletal malformations, dysmorphic
facial features, cardiovascular malformations, and a higher burden of cutaneous neurofibromas and
previous onset of benign neurofibromas [5–9]. Some authors suggest that increased malignancy
may be elucidated by variations in the expression of tumor suppressor genes placed in co-deleted
regions [10,11], as some of the genes in the deletion interval may have tumor suppressive functions.
The analysis of conserved domains in genes in this cluster indicates that many of these genes are
presumably involved in the regulation of cell growth and morphology [12]. NF1 clinical symptoms are
variable even when comparing individuals with NF1 microdeletions, probably due to the variability
characteristic of all patients with NF1, regardless of the type of NF1 gene mutation involved, but also
due to changes in deletion size and breakpoint location [13]. Nonetheless, some variability in expression
of the clinical symptoms has been detected even within the group of patients that are hemizygous
for the same number of genes [14], which could be explained by the expression level of non-deleted
genes, as well as by environmental factors. All these findings make the study of genotype–phenotype
correlations and the determination of the importance of the co-deleted genes difficult. For this reason,
a new approach to investigate the importance of these genes has been proposed by this study, using
evolutionary and phylogenetic analyses.
Evolutionary analyses take into account the natural selection, which includes purifying or negative
selection and positive selection or neutrality. Most of the genes are affected by purifying selection
that decreases the frequency of mutations that disadvantage carriers in a given environment [15,16].
Interspecies neutrality tests use data concerning the divergence between closely related species
to detect relatively ancient selective events. Interspecies tests include the non-synonymous and
synonymous (dN/dS) test that detects selection acting on protein-coding loci by comparing the ratio of
non-synonymous (dN) to synonymous (dS) substitutions [17]. Phylogenetic analyses are important
because they enrich our understanding of how genes, genomes, and species evolve. The evolutionary
history of living species is usually inferred through the phylogenetic analysis of molecular and
morphological information using assorted mathematical models.
In the present study we employed an evolutionary approach to provide further insights into
the understanding of the fundamental function of genes that are co-deleted in patients with NF1
microdeletions. Our main goal was to access the ortholog and paralog relationship of these genes in
primates and verify if purifying or positive selection are acting on these genes. With these analyses,
we hope to help to clarify the correlation of the co-deletion of these genes and the more severe
phenotype of NF1.
2. Methodology
2.1. Background
In a previous study conducted by our group ninety-three unrelated NF1 probands who met the
NIH diagnostic criteria were recruited at the Oncogenetics clinics of the Hospital de Clínicas de Porto
Alegre, located in the state of Rio Grande do Sul, southern Brazil. The study was approved by the
Institutional Ethics Committee Board of Hospital de Clínicas de Porto Alegre, under registration number
13-0260, Clinical evaluation and molecular characterization were enrolled in these patients. We found
large gene rearrangements in four patients (6%) by multiplex ligation-dependent probe amplification
(MLPA) analysis followed by confirmation using chromosomal microarray [18]. One patient presented
the classical 1.4 Mb type 1 microdeletion, spanning from SUZ12P1 to LRRC37B, including 22 genes
(16 functional). Two patients showed a similar deletion, but their breakpoints differed slightly (one
within CRLF3 intron 1 and SUZ12 intron 5, including 19 genes and spanning 1.15 Mb and the other
within CRLF3 intron 4 and the SUZ12 gene, including 18 genes and spanning 1.13 Mb). Finally,
one patient showed an atypical microdeletion, with breakpoints between SUZ12P1 and LRRC37BP,
spanning 890 kb and 15 genes. The fourteen genes deleted in at least one of the four patients wereGenes 2019, 10, 839 3 of 13
selected for the phylogenetic and selection analyses in this study: CRLF3, ATAD5, TEFM, ADAP2,
RNF135, NF1, OMG, EVI2B, EVI2A, RAB11FIP4, COPRS, UTP6, SUZ12, and LRRC37B.
2.2. Genes and Organisms Selected for Analysis
The following fourteen genes that are frequently co-deleted in NF1 patients with microdeletions
were included in the analyses: cytokine receptor like factor 3 (CRLF3), ATPase family AAA domain
containing 5 (ATAD5), transcription elongation factor, mitochondrial (TEFM), ArfGAP with dual PH
domains 2 (ADAP2), ring finger protein 135 (RNF135), neurofibromin 1 (NF1), oligodendrocyte myelin
glycoprotein (OMG), ecotropic viral integration site 2B (EVI2B), ecotropic viral integration site 2A
(EVI2A), RAB11 family interacting protein 4 (RAB11FIP4), coordinator of PRMT5 and differentiation
stimulator (COPRS), UTP6 small subunit processome component (UTP6), SUZ12 polycomb repressive
complex 2 subunit (SUZ12), and leucine rich repeat containing 37B (LRRC37B). As the focus of
evolutionary analysis was to perform evolutionary analysis of the deleted genes in primates, our ingroup
included eight primate species (Homo sapiens, Pan troglodytes, Pongo abelii, Gorilla gorilla gorilla, Nomascus
leucogenys, Macaca mulatta, Callithrix Jacchus, and Tarsius syrichta). The Canis lupus familiaris, Bos taurus,
Mus musculus, and Rattus norvegicus were used as outgroup. All the included species have their
complete genome sequence available in online databases.
2.3. Sequence Alignment and Phylogenetic Analyses
In order to obtain gene sequences in the organisms described above, BlastX was performed for
each gene from each organism in the Ensembl Databases (EMBL-EBI and Wellcome Trust Sanger
Institute) and the National Center for Biotechnology Information (NCBI) using human sequences
encoding the 14 genes as queries. The human genes are located in the frequently deleted region
of chromosome 17 and were obtained from the Metazome database (Joint Genome Institute and
Center for Integrative Genomics) and confirmed in NCBI. Full-length coding sequencing (CDS) and
protein sequences were aligned using MUSCLE [19] implemented in MEGA 7.0 [20] with default
parameters. The multiple alignments were manually inspected and edited when necessary in the final
analysis. The phylogenetic relationships were reconstructed following nucleotide and protein sequence
alignments using a Bayesian method carried out in BEAST v1.8.4 [21]. JModelTest 2.1 [22] and ProTest
2.4 [23] were used to select the best model of nucleotides and protein evolution. The birth-death process
was selected as a tree prior to Bayesian analysis, and it was run for 10,000,000 generations with Markov
chain Monte Carlo (MCMC) algorithms for both amino acid and nucleotide sequences. Tracer v1.6 [24]
was used to verify the convergence of the Markov chains and the adequate effective sample sizes (>200)
and the normal distribution curve. Trees off the curve were burned by tree annotator with a posterior
probability limit of 0.005. Trees were visualized and edited using FigTree v1.4.3 [25].
2.4. Selection Analysis
Using the alignments of each gene and the respective phylogenetic trees as inputs, the rates of
nonsynonymous to synonymous substitutions (dN/dS or ω), homogeneity, and positive selection
could be determined using maximum-likelihood models in the program CodeML in PAML v4.9 [26].
First, we used the models allowing ω to vary among sites (site models). The most effective models
were: the basic model (M0), which estimates uniform ω ratio among all sites; the site models including
M1 (nearly neutral), M2 (selection), M3 (discrete), M7 (beta distribution, ω > 1 disallowed) and M8
(beta distribution, ω > 1 allowed). The likelihood-ratio test (LRT) test is obtained by calculating twice
the log-likelihood difference between the alternative and null models (2∆L). The LRT was performed
between the following pairs of the models: M0 vs. M3; M1 vs. M2, and M7 vs. M8. These LRT statistics
approximately follow a chi-square distribution, and the number of degrees of freedom is equal to the
number of additional parameters in the more complex model [27]. A significantly higher likelihood
of the alternative model compared to the null model suggests positive selection. CodeML was also
used to estimate different values of ω among the sites and branches according to the branch site modelGenes 2019, 10, 839 4 of 13
comparing the alternative model (model = 2, Nsites = 2, fix_omega = 0, and omega = 0) with its
null model (model = 2, Nsites = 2, fix_omega = 1, and omega = 1) [28]. The model assumes that the
Genes 2019, 10 4
branches in the phylogeny are divided in the foreground (the one of interest for which positive selection
is expected)
selection and background
is expected) and background (those(those
not expected to exhibit
not expected positive
to exhibit selection).
positive selection).We
Weset
setCodeML
CodeMLto
estimate branch lengths by using random starting points (fix_blenght = −1).
to estimate branch lengths by using random starting points (fix_blenght = −1). All models were run All models were run
using
using
the F3x4the F3x4 option
option for expected
for expected codoncodon frequencies
frequencies basedbased on third
on third codoncodon positions.
positions. Finally,
Finally, thethe naive
naive
empirical Bayes (NEB) and the Bayes empirical bayes (BEB) approaches were
empirical Bayes (NEB) and the Bayes empirical bayes (BEB) approaches were used to calculate the used to calculate the
posteriorprobability
posterior probability(PP)
(PP)ofofeach
eachsite
sitebelonging
belongingtotothe
thesite
siteclass
classofofpositive
positiveselection
selectionwithin
withineach
each
alternative model.
alternative model.
3. 3. Results
Results
3.1. Phylogenetic Relationships of the Co-Deleted Genes
3.1. Phylogenetic Relationships of the Co-Deleted Genes
The clinical features of all previously analyzed patients are shown in Table S1 and described in
The clinical features of all previously analyzed patients are shown in Table S1 and described in full
full in Rosset et al., 2018 [18]. The deletions found in the patients are shown in Figure S1. One patient
in Rosset et al., 2018 [18]. The deletions found in the patients are shown in Figure S1. One patient showed
showed a typical type one deletion and the other three patients showed a typical NF1 microdeletions.
a typical type one deletion and the other three patients showed a typical NF1 microdeletions.
In order to investigate the presence of the missing genes in the microdeletion region of NF1
In order to investigate the presence of the missing genes in the microdeletion region of NF1
patients in other organisms, the fourteen human genes CRLF3, ATAD5, TEFM, ADAP2, RNF135, NF1,
patients in other organisms, the fourteen human genes CRLF3, ATAD5, TEFM, ADAP2, RNF135, NF1,
OMG, EVI2B, EVI2A, RAB11FIP4, COPRS, UTP6, SUZ12, and LRRC37B were used as query in BLAST
OMG, EVI2B, EVI2A, RAB11FIP4, COPRS, UTP6, SUZ12, and LRRC37B were used as query in BLAST
searches against the genomes of seven primates and another four mammalian species. The results
searches against the genomes of seven primates and another four mammalian species. The results
showed that three genes were found deleted in primate species, such as ATAD5 in Pongo abelli, RNF135
showed that three genes were found deleted in primate species, such as ATAD5 in Pongo abelli,
in Nomascus leucogenys, and LRRC37B in Callithrix Jacchus. Figure 1 shows the deleted genes in humans
RNF135 in Nomascus leucogenys, and LRRC37B in Callithrix Jacchus. Figure 1 shows the deleted genes
and in the comparative species.
in humans and in the comparative species.
Figure 1. Deleted genes analyzed in this study and in comparative species used for the phylogenetic
Figure 1. Deleted genes analyzed in this study and in comparative species used for the phylogenetic
analysis. Blue squares represent patients with NF1 microdeletions: patient 1, patient 2, patient 3,
analysis. Blue squares represent patients with NF1 microdeletions: patient 1, patient 2, patient 3, and
and patient 4, respectively. Brown squares represent ingroup species: Homo sapiens, Pan troglodytes,
patient 4, respectively. Brown squares represent ingroup species: Homo sapiens, Pan troglodytes, Pongo
Pongo abelii, Gorilla gorila gorila, Nomascus leucogenys, Macaca mulatta, Callithri Jacchus e Tarsius syrichata,
abelii, Gorilla gorila gorila, Nomascus leucogenys, Macaca mulatta, Callithri Jacchus e Tarsius syrichata,
respectively. Green squares represent outgroup species: Canis lúpus familiaris, Bos taurus, Mus musculus e
respectively. Greenrespectively.
Rattus norvegicus, squares represent outgroup
Deleted genes species:
in each speciesCanis lúpus familiaris,
are represented Boscircles.
with dark taurus,Asterisk
Mus
musculus
indicatese Rattus norvegicus,
that the respectively.
Tarsius syrichata RNF135 Deleted genes
gene, and in each
Canis species
lupus are represented
LRRC37B with dark
are absent because their
circles. Asterisk indicates that
sequences are mostly incomplete. the Tarsius syrichata RNF135 gene, and Canis lupus LRRC37B are absent
because their sequences are mostly incomplete.
The search for deleted gene sequences in the databases NCBI and Esembl reveals that all genes are
The search
located for deleted
in the same gene sequences
chromosomal unity inin the databases
humans. NCBI
The other and Esembl
species reveals
show some that all
different genes
locations,
are located in the same chromosomal unity in humans. The other species show some different
locations, such as Nomascus leucogenys that has only CRLF3 and ADAP2 on chromosome 14 and other
genes on chromosome 19, and Mus musculus that has all genes on chromosome 10 with the exception
of COPRS that is located on chromosome 16. The chromosomal locations of all genes in the analyzed
species are shown in Table S2. The best models of nucleotides and protein alignments obtained byGenes 2019, 10, 839 5 of 13
such as Nomascus leucogenys that has only CRLF3 and ADAP2 on chromosome 14 and other genes
on chromosome 19, and Mus musculus that has all genes on chromosome 10 with the exception of
COPRS that is located on chromosome 16. The chromosomal locations of all genes in the analyzed
species are shown in Table S2. The best models of nucleotides and protein alignments obtained
by JModelTest 2.1 and ProTest 2.4 are shown in Table S3. Phylogenetic analysis was performed
for each gene of the ingroup and outgroup species. In general, trees with nucleotide and amino
acid sequences showed similar topologies. However, the order of organisms was not always the
same and the posterior probabilities were higher in the most phylogenies reconstructed based on
nucleotide sequences (Figures S2–S13). Only RNF135 and LRRC37B genes showed better values in
the trees imputed with their amino acid sequences (Figures S14 and S15). Additionally, these two
genes showed considerable variation among their sequences in the species studied, (red cells from
Table S3). The results concerning LRRC37B trees are difficult to interpret since this gene has several
pseudogenes in different species and it is not possible to infer if all these sequences are functional.
LRRC37B, UTP6, and EVI2B trees grouped Homo sapiens and Pan troglodytes, and Mus musculus and
Rattus norvegicus, however, they did not group Canis lupus familiaris and Bos Taurus. SUZ12 trees did
not group Homo sapiens and Pan troglodytes, instead the tree grouped Homo sapiens and Gorilla gorilla
gorilla. COPRS trees grouped Homo sapiens and Pan troglodytes and did not group Canis lupus familiaris
and Bos taurus and Mus musculus and Rattus norvegicus. Nucleotide and amino acid trees generated
with ATAD5, ADAP2, NF1, OMG, EVI2A, and TEFM sequences showed all clades in correct positions.
Only ATAD5 gene was deleted in Pongo abeli.
CRLF3 is probably a negative regulator of cell cycle [12] and was conserved in all analyzed
species. However, the trees do not show Homo sapiens and Pan troglodytes with a common ancestor.
Nucleotide sequence tree grouped Homo sapiens and Gorilla gorilla gorilla, whereas amino acid tree
grouped Homo sapiens and Pongo abelii. Nucleotide tree showed better posterior values but did
not group Bos taurus and Canis lupus familiaris. Finally, RNF135 nucleotide and amino acid trees
did not group Homo sapiens and Pan troglodytes; both grouped Bos taurus and Canis lupus familiaris
and Mus musculus and Rattus norvegicus. This gene was not found in Nomascus leucogenys and was
incomplete in Tarsius syrichta. Moreover, the RNF135 gene could act as a transcription factor, due to the
presence of zinc finger domains and the lower conservation found outside the sequence corresponding
to protein domains, a common feature in transcription factors.
3.2. Selection Analysis of the Co-Deleted Genes
All genes presented a statistically significant value for M3 × M0 analysis, indicating ω heterogeneity
among all sites (Table 1). RNF135, UTP6, LRRC37B, and EVI2B showed statistically significant values
for the comparison between the M8 × M7 models (p < 0.005, p < 0.025, p < 0.001, and p < 0.025,
respectively), indicating positive selection. In addition, LRRC37B was the only gene that also presented
a statistically significant difference in the comparison of M2 × M1 models (Table 1). The naive empirical
Bayes (NEB) and Bayes empirical bayes (BEB) analyses demonstrated which sites are under selection
(Tables S4–S7), however, presented statistically significant values only for sites in the RNF135 gene.
Twenty-seven amino acid sites showed positive selection, with statistical significance for the NEB
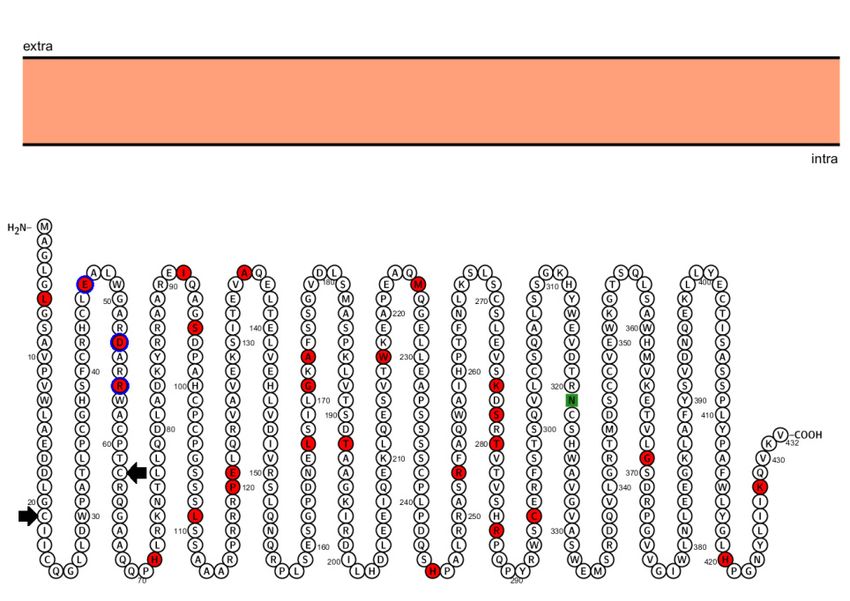
model (21 sites with I-value >0.005 and 6 sites with p-value >0.001) (Table S4). Figure 2 shows the
positively selected sites and positions, including sites located in the RING finger domain of RNF135.Genes 2019, 10, 839 6 of 13
Table 1. CodeML analysis of the entire dataset using the site models.
Gene Family Model/Likelihood Comparison Parameters/Significance
M0/-3789,882728 M3 vs. M0 2∆L = 31.37 (df = 4)/pGenes 2019, 10, 839 7 of 13
Table 1. Cont.
Gene Family Model/Likelihood Comparison Parameters/Significance
M0/-2792,694611 M3 vs. M0 2∆L = 44.45 (df = 4)/p < 0.001 *
M1/-2771,253237 M2 vs. M1 2∆L = 1.32 (df = 2)/p < 0.99
M2/-2770,590286 M8 vs. M7 2∆L = 4.28 (df = 2)/p < 0.1
EVI2A
M3/-2770,464944
M7/-2772,654596
M8/-2770,510367
M0/-5998,097719 M3 vs. M0 2∆L = 71.86 (df = 4)/p < 0.001 *
Genes 2019, 10 M1/-5964,792227 M2 vs. M1 2∆L = 1.85 (df = 2)/p < 0.1 7
M2/-5963,862998 M8 vs. M7 2∆L = 6.25 (df = 2)/p < 0.025 *
EVI2B
M3/-5962,167576
M7/-5965,886294
M7/-5965,886294
M8/-5962,759212
M8/-5962,759212
M0/-8519,576811 M3 vs. M0 2ΔL = 214.76 (df = 4)/p < 0.001 *
M1/-8500,408316
M0/-8519,576811 M2M3 vs. vs.
M1 M0 2ΔL = 0214.76
2∆L (df =< 0.99
(df = 2)/p 4)/p < 0.001 *
M1/-8500,408316
M2/-8500,408316 M8M2 vs. vs.
M7 M1 = 3.27= (df
2ΔL 2∆L 0 (df = 2)/p
= 2)/p < 0.99
< 0.1
RAB11FIP4
M2/-8500,408316
M3/-8412,192643 M8 vs. M7 2∆L = 3.27 (df = 2)/p < 0.1
RAB11FIP4
M3/-8412,192643
M7/-8412,081211
M7/-8412,081211
M8/-8410,442254
M8/-8410,442254
M0/-4523,914053 M3 vs. M0 2ΔL = 95.54 (df = 4)/p < 0.001 *
M0/-4523,914053
M1/-4479,041925 M2M3 vs. vs.
M1 M0 2∆L= =2.70
2ΔL 95.54
(df(df = 4)/p
= 2)/p < 0.1< 0.001 *
M1/-4479,041925
M2/-4477,690271 M8M2 vs. vs.
M7 M1 2ΔL2∆L = 2.70
= 3.91 2)/p=Genes 2019, 10, 839 8 of 13
The CRLF3, ATAD5, ADAP2, NF1, SUZ12, OMG, EVI2A, RAB11FIP4, TEFM, and CORPS genes
did not present statistically significant values for the comparisons of M2 × M1 and M8 × M7 models,
indicating that they may be under purifying selection (Table 1).
4. Discussion
Tumor occurrence in NF1 follows the two hit mechanism proposed by Knudson in 1971 for
retinoblastoma. The first hit corresponds to the germ line mutation (haploinsufficiency) that is
enough to cause the initial NF1 symptoms. The second hit is somatic and stimulates tumorigenesis in
specific tissues involved in NF1 disease [29]. Only a few genotype–phenotype correlations have been
established to date in NF1 [30–32]. One of the most evident is associated with NF1 microdeletions,
independent of the second hit acquisition. The architecture of the genomic regions flanking the NF1
gene in 17q11.2 in humans is characterized by low copy repeats (LCRs). LCRs predisposes to large
deletions mediated by mutational mechanisms occurring in the germline of an unaffected parent or
during mitotic postzygotic cell divisions [33]. Initially, the breakpoints of large rearrangements were
characterized by microdeletion junction-specific PCR assay of 54 NF1 patients. The recombinant event
occurred in 46% of cases in a recombination hotspot region of the flanking NF1REPs, also causing three
intervals of recombinant events [34]. Later, four types of microdeletions (type 1, 2, 3, and atypical) were
identified; the most frequent type of microdeletion is type 1 NF1 deletion which encompass 1.4 Mb and
include 14 protein-coding genes as well as four microRNA genes (Figure S1) [35–37]. The non-allelic
homologous recombination (NAHR) events causing type 1 NF1 deletions are mediated by the low copy
repeats, NF1-REPa, and NF1-REPc [36]. Type 2 deletions encompass only 1.2 Mb and are associated
with hemizygosity for 13 protein-coding genes. They are also mediated by NAHR but their breakpoints
are located within SUZ12 and its highly homologous pseudogene SUZ12P1 which flank NF1-REPc
and NF1-REPa, respectively (Figure S1) [37]. Type 3 NF1 deletions are very rare; these 1.0 Mb deletions
occur in only 1–4% of all patients with gross NF1 deletions and are mediated by NAHR between
NF1-REPb and NF1-REPc leading to hemizygosity for a total of nine protein-coding genes (Figure S1).
Atypical large NF1 deletions do not exhibit recurrent breakpoints and are variable considering the
number of genes located within the deleted region [38].
In our previously studied cohort [18], one of the NF1 probands showed the well described NF1 type
1 microdeletion. Although the other three patients showed NF1 deletion breakpoints similar to type 2
and type 3 microdeletions, they were considered atypical (Table S2 and Figure S1). One gene in the
region between NF1-REPa and NF1-REPb, which is variably included in microdeletions and is deleted
in four of our patients, is ring finger protein 135 (RNF135). RNF135 codifies a protein that contains a
RING finger domain at the N terminus and a B30.2/SPRY domain at the C terminus. RING domains
are specialized zinc-finger motifs that can have ubiquitin and sumo ligase activity [39]. RNF135
loss-of-function mutations, as well as an NF1-REPa to NF1-REPb deletion including this gene, have
been implicated in an overgrowth syndrome which includes tall stature, macrocephaly, dysmorphic
features, and variable additional features, including learning disability [39]. The dysmorphic facial
character as seen in patients with NF1 microdeletions is generally missing in patients with intragenic
NF1 mutations. One of the patients from our previous study (Table S1) had an NF1 deletion including
NF1-REPa to NF1-REPb and RNF135 and had several dysmorphic features as well as tall stature.
However, since only the study conducted by Douglas et al. (2007) [39] analyzed patients with intragenic
RNF135 mutations but lacking NF1 microdeletions, more studies are necessary to assess the role of
RNF135 co-deletion in NF1. In our study, a different approach was applied to try to elucidate the
importance of this gene in NF1 microdeletions. The phylogenetic analysis revealed the evolutionary
relationships of each gene among the primate species analyzed. These results showed that some genes
are not in agreement with the species tree, suggesting distinct evolutionary constraint between them,
which could be expected for genes that present divergence of function during species evolution and
are under distinct selection pressure. The distinct statistical values for clades on the phylogenies
considering nucleotide and protein sequences could be explained by the differences in nucleotide andGenes 2019, 10, 839 9 of 13
protein variation. These differences could be explained by the high synonymous substitution found for
some genes. The phylogenetic trees were used to estimate the dN/dS value for molecular evolutionary
rate analysis and revealed a distinct selection pattern for each gene. Most genes are under purifying or
negative selection, but some present some positively selected sites.
Our results indicate that there is heterogeneity of ω between the sites of all analyzed genes in the
different species. This indicates that, in the same position, the amino acids vary among the different
groups investigated. Four genes present evidence of being under positive selection (RNF135, UTP6,
LRRC37B, and EVI2B), which possibly increased their adaptive values. Of these, the only gene that
presented statistically significant differences for its sites in the NEB model was RNF135 (Table S4).
The protein RNF135 showed twenty-seven sites under positive selection, and three of them are located
in the RING finger domain of the protein. The second positively selected residue is a glutamic acid, with
a negative net charge in humans and other primates (Macaca mulatta, Callithrix Jacchus, Pongo abelii, and
Pan troglodytes). In organisms that are phylogenetically more distant to humans (e.g., Mus musculus),
this site has a positively charged amino acid. The third residue is an aspartic acid, a negative amino
acid in the human protein. In the primates Pan troglodytes, Pongo abelii, and Macaca mulatta, the neutral
amino acid glicine was selected; in Mus musculus the amino acid in this position is an arginine. Finally,
the fourth selected residue is an arginine in humans and other main primates; in Mus musculus, a valine,
a polar hidrofobic amino acid, is in this position. These differences in amino acids and their charges
could have been selected in humans and other primates to allow better tridimensional conformation
of the RNF135 protein and, consequently, a higher efficiency in its ubiquitination function. Most of
the ring finger proteins contain two zinc atoms grouped with cistein or cistein-histidin rich clusters.
The consensus sequence of this domain is C – X2 – C – X9–39 – C – X1–3 – C – X2 – C – X4–48 – C –
X2 – C [40]. The RNF135 gene has this consensus region, represented in Figure 2, which encompass
the second, third, and fourth sites under positive selection (shown in red in Figure 2). Genes under
this type of selection have important functions and these data support that RNF135 haploinsufficiency
contributes to human disease. Other genes showed positive selection in our study (UTP6, LRRC37B,
and EVI2B), but without a statistically significant difference in the NEB model (Tables S5–S7).
The other ten genes showed evidence of being under purifying selection, which is related to the
importance of maintaining their function during the evolution of organisms. They are fairly conserved
genes that are present in all organisms investigated, with the exception of the ATAD5 gene in Pongo abelli.
These genes in the co-deleted region may also contribute to the phenotype in microdeleted patients.
SUZ12 (also known as JJAZ1) is critical in embryonic development [41]. There are evidences that biallelic
SUZ12 loss promotes malignant peripheral nerve sheath tumor (MPNST) progression in NF1 [42].
The SUZ12 protein is a component of the Polycomb repressive complex 2 (PRC2) and is involved in the
epigenetic silencing of many different genes by establishing di- and tri-methylation of histone H3 lysine
27 [43]. Loss of histone H3 lysine 27 trimethylation was observed in 50–70% of MPNSTs. By contrast,
in benign neurofibromas, the H3 lysine 27 trimethylation is retained, serving as a diagnostic marker
for malignant transformation [44]. Another gene, OMG, which encodes the oligodendrocyte myelin
glycoprotein is an important inhibitor of neurite overgrowth [45]. Haploinsufficiency of the OMG
gene has been proposed to be associated with learning disability. Cardiovascular malformations
observed in patients with NF1 microdeletions could be related to hemizygosity of the ADAP2 gene.
This conclusion is drawn from the observation that ADAP2 is highly expressed during early stages
of heart development in both mice and humans [46]. Haploinsufficiency of UTP6 seems to reduce
cellular apoptosis, increasing the risk of tumor development [47]. ATAD5 (ATPase family AAA
domain-containing protein 5) is involved in the stabilization of stalled DNA replication forks by
regulating proliferating cell nuclear antigen (PCNA) ubiquitination during DNA damage bypass,
thereby promoting the exchange of a low-fidelity translesion polymerase back to a high-fidelity
replication polymerase [48]. Embryonic fibroblasts from more than 90% of haploinsufficient Atad5+/m
mice developed tumors such as sarcomas, carcinomas, and adenocarcinomas that exhibited high levels
of genomic instability [49].Genes 2019, 10, 839 10 of 13
5. Conclusions
In our study, we found that four of the frequently co-deleted genes in NF1 patients with
microdeletions present evidence of being under positive selection, including specific amino acid
sites of RNF135 protein in its main functional domain (RING finger), reinforcing its importance and
contribution to human disease. Moreover, the other ten co-deleted genes showed evidence of being
under purifying selection, which is related to the importance of maintaining their function during the
evolution of organisms. Our in silico analysis could help clarify the function and contribution of the
co-deleted genes to disease and, in the future, co-deleted genes could possibly be included in the NF1
molecular diagnostic workup.
Supplementary Materials: The following are available online at http://www.mdpi.com/2073-4425/10/11/839/s1.
Figure S1: Representation of existing microdeletions in patients with neurofibromatosis (type 1, 2 and 3 deletions)
and deletions found in the previously analyzed patients, Figure S2: Phylogenetic tree of CRLF3 gene reconstructed
based on nucleotides sequences, Figure S3: Phylogenetic tree of ATAD5 gene reconstructed based on nucleotides
sequences, Figure S4: Phylogenetic tree of TEFM gene reconstructed based on nucleotides sequences, Figure S5:
Phylogenetic tree of ADAP2 gene reconstructed based on nucleotides sequences, Figure S6: Phylogenetic tree of
NF1 gene reconstructed based on nucleotides sequences, Figure S7: Phylogenetic tree of OMG gene reconstructed
based on nucleotides sequences, Figure S8: Phylogenetic tree of EVI2B gene reconstructed based on nucleotides
sequences, Figure S9: Phylogenetic tree of EVI2A gene reconstructed based on nucleotides sequences, Figure S10:
Phylogenetic tree of RAB11FIP4 gene reconstructed based on nucleotides sequences, Figure S11: Phylogenetic
tree of COPRS gene reconstructed based on nucleotides sequences, Figure S12: Phylogenetic tree of UTP6 gene
reconstructed based on nucleotides sequences, Figure S13: Phylogenetic tree of SUZ12 gene reconstructed based
on nucleotides sequences, Figure S14: Phylogenetic tree of RNF135 gene reconstructed based on amino acid
sequences, Figure S15: Phylogenetic tree of LRRC37B gene reconstructed based on amino acid sequences; Table
S1: Clinical characterization of the NF1 patients previously analyzed, Table S2: Information about the sequences
obtained in the Ensembl and NCBI databases for all species included in this study, Table S3: The best model
of nucleotides and protein alignment, Table S4: Positively selected sites in RNF135 and amino acid differences
between species, Table S5: Positively selected sites in UTP6 and amino acid differences between species, Table S6:
Positively selected sites in LRRC37B and amino acid differences between species.
Author Contributions: L.B.R. participated in the literature review, in silico analysis, manuscript design,
conceptualization, and writing; A.C.T.-Z. participated in the in silico analysis and manuscript writing and revising
for intellectual content; M.F. participated in the in silico analysis and methodology design; P.A.-P. participated in
the manuscript writing and revising for intellectual content; C.R. participated on the literature review, manuscript
design, conceptualization, writing and revising.
Funding: This research was funded by Fundo de Incentivo à Pesquisa (FIPE) of the Hospital de Clínicas de Porto
Alegre, grant number 2013-0260 and Conselho Nacional de Desenvolvimento Científico e Tecnológico (CNPq).
The APC was funded by Fundo de Incentivo à Pesquisa (FIPE).
Acknowledgments: We would like to thank Fundo de Incentivo à Pesquisa (FIPE) of the Hospital de Clínicas de
Porto Alegre and Conselho Nacional de Desenvolvimento Científico e Tecnológico (CNPq).
Conflicts of Interest: The authors stated that they had no interests which might be perceived as posing a conflict
or bias.
References
1. Rasmussen, S.A.; Friedman, J.M. NF1 gene and neurofibromatosis 1. Am. J. Epidemiol. 2000, 151, 33–40.
[CrossRef] [PubMed]
2. National Institutes of Health Consensus Development Conference Statement. Neurofibromatosis.
Arch. Neurol. Chic. 1998, 45, 575–578.
3. The Human Gene Mutation Database. Available online: http://www.hgmd.cf.ac.uk/ac/index.php (accessed
on 16 March 2017).
4. Messiaen, L.M.; Wimmer, K. NF1 mutational spectrum. Neurofibromatoses. Monogr. Hum. Genet. 2008, 16,
63–77.
5. Venturin, M.; Guarnieri, P.; Natacci, F.; Stabile, M.; Tenconi, R.; Clementi, M.; Hernandez, C.; Thompson, P.;
Upadhyaya, M.; Larizza, L.; et al. Mental retardation and cardiovascular malformations in NF1 microdeleted
patients point to candidate genes in 17q11.2. J. Med. Genet. 2004, 41, 35–41. [CrossRef] [PubMed]Genes 2019, 10, 839 11 of 13
6. Mensink, K.A.; Ketterling, R.P.; Flynn, H.C.; Knudson, R.A.; Lindor, N.M.; Heese, B.A.; Spinner, R.J.;
Babovic-Vuksanovic, D. Connective tissue dysplasia in five new patients with NF1 microdeletions: further
expansion of phenotype and review of the literature. J. Med. Genet. 2006, 43, e8. [CrossRef] [PubMed]
7. De Raedt, T.; Brems, H.; Wolkenstein, P.; Vidaud, D.; Pilotti, S.; Perrone, F.; Mautner, V.; Frahm, S.; Sciot, R.;
Legius, E. Elevated risk for MPNST in NF1 microdeletion patients. Am. J. Hum. Genet. 2003, 72, 1288–1292.
[CrossRef] [PubMed]
8. Descheemaeker, M.J.; Roelandts, K.; De Raedt, T.; Brems, H.; Fryns, J.P.; Legius, E. Intelligence in individuals
with a neurofibromatosis type 1 microdeletion. Am. J. Med. Genet. 2004, 131, 325–326. [CrossRef]
9. Zhang, J.; Tong, H.; Fu, X.; Zhang, Y.; Liu, J.; Cheng, R.; Liang, J.; Peng, J.; Sun, Z.; Liu, H.; et al. Molecular
characterization of NF1 and neurofibromatosis type 1 genotype- phenotype correlations in a Chinese
population. Sci. Rep. 2005, 5, 11291. [CrossRef]
10. Bartelt-Kirbach, B.; Wuepping, M.; Dodrimont-Lattke, M.; Kaufmann, D. Expression analysis of genes lying in
the NF1 microdeletion interval points to four candidate modifiers for neurofibroma formation. Neurogenetics
2009, 10, 79–85. [CrossRef]
11. Pasmant, E.; Masliah-Planchon, J.; Lévy, P.; Laurendeau, I.; Ortonne, N.; Parfait, B.; Valeyrie-Allanore, L.;
Leroy, K.; Wolkenstein, P.; Vidaud, M.; et al. Identification of genes potentially involved in the increased risk
of malignancy in NF1-microdeleted patients. Mol. Med. 2011, 17, 79–87. [CrossRef]
12. Yang, F.; Xu, Y.P.; Li, J.; Duan, S.S.; Fu, Y.J.; Zhang, Y.; Zhao, Y.; Qiao, W.T.; Chen, Q.M.; Geng, Y.Q.; et al.
Cloning and characterization of a novel intracellular protein p48.2 that negatively regulates cell cycle
progression. Int. J. Biochem. Cell Biol. 2009 41, 2240–2250. [CrossRef]
13. Sabbagh, A.; Pasmant, E.; Laurendeau, I.; Parfait, B.; Barbarot, S.; Guillot, B.; Combemale, P.; Ferkal, S.;
Vidaud, M.; Aubourg, P. Members of the NF France Network. Unravelling the genetic basis of variable
clinical expression in neurofibromatosis 1. Hum. Mol. Genet. 2009, 18, 2768–2778. [CrossRef] [PubMed]
14. Mautner, V.F.; Kluwe, L.; Friedrich, R.E.; Roehl, A.C.; Bammert, S.; Högel, J.; Spöri, H.; Cooper, D.N.;
Kehrer-Sawatzki, H. Clinical characterization of 29 neurofibromatosis type-1 patients with molecularly
ascertained 1.4 Mb type-1 NF1 deletions. J. Med. Genet. 2010, 47, 623–630. [CrossRef] [PubMed]
15. Nielsen, R.C.; Bustamante, A.G.; Clark, S.; Glanowski, T.B.; Sackton, M.J.; Hubisz, A.; Fledel-Alon, A.;
Tanenbaum, D.M.; Civello, D.; White, T.J.; et al. A scan for positively selected genes in the genomes of
humans and chimpanzees. PLoS Biol. 2005, 3, e170. [CrossRef] [PubMed]
16. Bustamante, C.D.; Fledel-Alon, A.; Williamson, S.; Nielsen, R.; Hubisz, M.T.; Glanowski, S.; Tanenbaum, D.M.;
White, T.J.; Sninsky, J.J.; Hernandez, R.D.; et al. Natural selection on protein-coding genes in the human
genome. Nature 2005, 437, 1153–1157. [CrossRef]
17. Yang, Z. Likelihood ratio tests for detecting positive selection and application to primate lysozyme evolution.
Mol. Biol. Evol. 1998, 15, 568–573. [CrossRef] [PubMed]
18. Rosset, C.; Vairo, F.; Bandeira, I.C.; Fonini, M.; Netto, C.B.O.; Ashton-Prolla, P. Clinical and molecular
characterization of neurofibromatosis in southern Brazil. Expert. Rev. Mol. Diagn. 2018, 18, 577–586.
[CrossRef]
19. Edgar, R.C. MUSCLE: Multiple sequence alignment with high accuracy and high throughput. Nucleic Acids Res.
2004, 32, 1792–1797. [CrossRef]
20. Tamura, K.; Stecher, G.; Peterson, D.; Filipski, A.; Kumar, S. MEGA6: Molecular Evolutionary Genetics
Analysis Version 6.0. Mol. Biol. Evol. 2013, 30, 2725–2729. [CrossRef]
21. Drummond, A.J.; Suchard, M.A.; Xie, D.; Rambaut, A. Bayesian phylogenetics with BEAUti and the BEAST
1.7. Mol. Biol. Evol. 2012, 29, 1969–1973. [CrossRef]
22. Darriba, D.; Taboada, G.L.; Doallo, R.; Posada, D. jModelTest 2: more models, new heuristics and parallel
computing. Nat. Methods 2012, 9, 772. [CrossRef] [PubMed]
23. Abascal, F.; Zardoya, R.; Posada, D. ProtTest: selection of best-fit models of protein evolution. Bioinformatics
2005, 21, 2104–2105. [CrossRef] [PubMed]
24. Rambaut, A.; Drummond, A.J.; Xie, D.; Baele, G.; Suchard, M.A. Posterior summarisation in Bayesian
phylogenetics using Tracer 1.7. Syst. Biol. 2018, 67, 901–904. [CrossRef] [PubMed]
25. Rambaut, A. FigTree. 2013. Available online: http://tree.bio.ed.ac.uk/software/figtree (accessed on
12 June 2019).
26. Yang, Z. PAML 4: Phylogenetic analysis by maximum likelihood. Mol. Biol. Evol. 2007, 24, 1586–1591.
[CrossRef]Genes 2019, 10, 839 12 of 13
27. Anisimova, M.; Yang, Z. Multiple hypothesis testing to detect lineages under positive selection that affects
only a few sites. Mol. Biol. Evol. 2007, 24, 1219–1228. [CrossRef]
28. Zhang, J.; Nielsen, R.; Yang, Z. Evaluation of an improved branch-site likelihood method for detecting
positive selection at the molecular level. Mol. Biol. Evol. 2005, 22, 2472–2479. [CrossRef]
29. Knudson, A.G. Mutation and cancer: statistical study of retinoblastoma. Proc. Natl. Acad. Sci. USA 1971, 68,
820–823. [CrossRef]
30. Ruggieri, M.; Polizzi, A.; Spalice, A.; Salpietro, V.; Caltabiano, R.; D’Orazi, V.; Pavone, P.; Pirrone, C.;
Magro, G.; Platania, N.; et al. The natural history of spinal neurofibromatosis: a critical review of clinical and
genetic features. Clin. Genet. 2015, 87, 401–410. [CrossRef]
31. Upadhyaya, M.; Huson, S.M.; Davies, M.; Thomas, N.; Chuzhanova, N.; Giovannini, S.; Evans, D.G.;
Howard, E.; Kerr, B.; Griffiths, S.; et al. An absence of cutaneous neurofibromas associated with a 3-bp
inframe deletion in exon 17 of the NF1 gene (c.2970-2972 delAAT): evidence of a clinically significant NF1
genotype-phenotype correlation. Am. J. Hum. Genet. 2007, 80, 140–151. [CrossRef]
32. Rojnueangnit, K.; Xie, J.; Gomes, A.; Sharp, A.; Callens, T.; Chen, Y.; Liu, Y.; Cochran, M.; Abbott, M.A.;
Atkin, J.; et al. High incidence of Noonan syndrome features including short stature and pulmonic stenosis in
patients carrying NF1 missense mutations affecting p.Arg1809: genotype-phenotype correlation. Hum. Mutat.
2015, 36, 1052–1063. [CrossRef]
33. Jenne, D.E.; Tinschert, S.; Reimann, H.; Lasinger, W.; Thiel, G.; Hameister, H.; Kehrer-Sawatzki, H. Molecular
characterization and gene content of breakpoint boundaries in patients with neurofibromatosis type 1 with
17q11.2 microdeletions. Am. J. Hum. Genet. 2001, 69, 516–527. [CrossRef] [PubMed]
34. López-Correa, C.; Dorschner, M.; Brems, H.; Lázaro, C.; Clementi, M.; Upadhyaya, M.; Dooijes, D.;
Moog, U.; Kehrer-Sawatzki, H.; Rutkowski, J.L.; et al. Recombination hotspot in NF1 microdeletion patients.
Hum. Mol. Genet. 2001, 10, 1387–1392. [CrossRef] [PubMed]
35. Messiaen, L.; Vogt, J.; Bengesser, K.; Fu, C.; Mikhail, F.; Serra, E.; Garcia-Linares, C.; Cooper, D.N.; Lazaro, C.;
Kehrer-Sawatzki, H. Mosaic type-1 NF1 microdeletions as a cause of both generalized and segmental
neurofibromatosis type-1 (NF1). Hum. Mutat. 2011, 32, 213–219. [CrossRef] [PubMed]
36. Hillmer, M.; Wagner, D.; Summerer, A.; Daiber, M.; Mautner, V.F.; Messiaen, L.; Cooper, D.N.;
Kehrer-Sawatzki, H. Fine mapping of meiotic NAHR-associated crossovers causing large NF1 deletions.
Hum. Mol. Genet. 2016, 25, 484–496. [CrossRef] [PubMed]
37. Vogt, J.; Mussotter, T.; Bengesser, K.; Claes, K.; Högel, J.; Chuzhanova, N.; Fu, C.; van den Ende, J.;
Mautner, V.F.; Cooper, D.N.; et al. Identification of recurrent type-2 NF1 microdeletions reveals a mitotic
nonallelic homologous recombination hotspot underlying a human genomic disorder. Hum. Mutat. 2012, 33,
1599–1609. [CrossRef] [PubMed]
38. Pasmant, E.; Sabbagh, A.; Spurlock, G.; Laurendeau, I.; Grillo, E.; Hamel, M.J.; Martin, L.; Barbarot, S.;
Leheup, B.; Rodriguez, D.; et al. NF1 microdeletions in neurofibromatosis type 1: from genotype to phenotype.
Hum Mutat 2010, 31, e1506–e1518. [CrossRef] [PubMed]
39. Douglas, J.; Cilliers, D.; Coleman, K.; Tatton-Brown, K.; Barker, K.; Bernhard, B.; Burn, J.; Huson, S.;
Josifova, D.; Lacombe, D.; et al. Mutations in RNF135, a gene within the NF1 microdeletion region,
cause phenotypic abnormalities including overgrowth. Nat. Genet. 2007, 39, 963–965. [CrossRef]
40. Nalepa, G.; Rolf, M.; Harper, Y.W. Drug discovery in the ubiquitin-proteasome system. Nat. Rev. Drug. Discov.
2006, 5, 596–613. [CrossRef]
41. Squazzo, S.L.; O’Geen, H.; Komashko, V.M.; Krig, S.R.; Jin, V.X.; Jang, S.W.; Margueron, R.; Reinberg, D.;
Green, R.; Farnham, P.J. Suz12 binds to silenced regions of the genome in a cell-type-specific manner.
Genome Res. 2006, 16, 890–900. [CrossRef]
42. Zhang, M.; Wang, Y.; Jones, S.; Sausen, M.; McMahon, K.; Sharma, R.; Wang, Q.; Belzberg, A.J.; Chaichana, K.;
Gallia, G.L.; et al. Somatic mutations of SUZ12 in malignant peripheral nerve sheath tumors. Nat. Genet.
2014, 46, 1170–1172. [CrossRef]
43. Di Croce, L.; Helin, K. Transcriptional regulation by Polycomb group proteins. Nat. Struct. Mol. Biol. 2013,
20, 1147–1155. [CrossRef] [PubMed]
44. Asano, N.; Yoshida, A.; Ichikawa, H.; Mori, T.; Nakamura, M.; Kawai, A.; Hiraoka, N. Immunohistochemistry
for trimethylated H3K27 in the diagnosis of malignant peripheral nerve sheath tumours. Histopathology 2017,
70, 385–393. [CrossRef] [PubMed]Genes 2019, 10, 839 13 of 13
45. Huang, J.K.; Phillips, G.R.; Roth, A.D.; Pedraza, L.; Shan, W.; Belkaid, W.; Mi, S.; Fex-Svenningsen, A.;
Florens, L.; Yates, J.R., 3rd; et al. Glial membranes at the node of Ranvier prevent neurite outgrowth.
Science 2005, 310, 1813–1817. [CrossRef] [PubMed]
46. Venturin, M.; Carra, S.; Gaudenzi, G.; Brunelli, S.; Gallo, G.R.; Moncini, S.; Cotelli, F.; Riva, P. ADAP2 in heart
development: a candidate gene for the occurrence of cardiovascular malformations in NF1 microdeletion
syndrome. J. Med. Genet. 2014, 51, 436–443. [CrossRef]
47. Piddubnyak, V.; Rigou, P.; Michel, L.; Rain, J.C.; Geneste, O.; Wolkenstein, P.; Vidaud, D.; Hickman, J.A.;
Mauviel, A.; Poyet, J.L. Positive regulation of apoptosis by HCA66, a new Apaf-1 interacting protein, and its
putative role in the physiopathology of NF1 microdeletion syndrome patients. Cell Death Differ. 2007, 14,
1222–1233. [CrossRef]
48. Lee, K.Y.; Fu, H.; Aladjem, M.I.; Myung, K. ATAD5 regulates the lifespan of DNA replication factories by
modulating PCNA level on the chromatin. J. Cell Biol. 2013, 200, 31–44. [CrossRef]
49. Bell, D.W.; Sikdar, N.; Lee, K.Y.; Price, J.C.; Chatterjee, R.; Park, H.D.; Fox, J.; Ishiai, M.; Rudd, M.L.;
Pollock, L.M.; et al. Predisposition to cancer caused by genetic and functional defects of mammalian Atad5.
PLoS Genet. 2011, 7, e1002245. [CrossRef]
© 2019 by the authors. Licensee MDPI, Basel, Switzerland. This article is an open access
article distributed under the terms and conditions of the Creative Commons Attribution
(CC BY) license (http://creativecommons.org/licenses/by/4.0/).You can also read