Gender specific airway gene expression in COPD sub phenotypes supports a role of mitochondria and of different types of leukocytes
←
→
Page content transcription
If your browser does not render page correctly, please read the page content below
www.nature.com/scientificreports

                OPEN              Gender specific airway
                                  gene expression in COPD
                                  sub‑phenotypes supports a role
                                  of mitochondria and of different
                                  types of leukocytes
                                  Anna Esteve‑Codina1,2, Thomas P. Hofer3,26, Dorothe Burggraf3, Marion S. Heiss‑Neumann3,
                                  Wolfgang Gesierich3, Anne Boland4, Robert Olaso4, Marie‑Therese Bihoreau4,
                                  Jean‑Francois Deleuze4, Winfried Moeller5, Otmar Schmid5, María Soler Artigas1,2,
                                  Kathrin Renner6, Jens M. Hohlfeld7,8,10, Tobias Welte8,10, Thomas Fuehner8,10,
                                  Lukas Jerrentrup9,11, Andreas Rembert Koczulla9,11, Timm Greulich9,11, Antje Prasse7,8,10,
                                  Joachim Müller‑Quernheim12, Sumit Gupta13, Christopher Brightling13,
                                  Deepak R. Subramanian14, David G. Parr14, Umme Kolsum15, Vandana Gupta15,
                                  Imre Barta16, Balázs Döme17, János Strausz18, Mariarita Stendardo19, Marco Piattella19,
                                  Piera Boschetto19, Damian Korzybski20, Dorota Gorecka20, Adam Nowinski20,
                                  Marc Dabad1,2, Marcos Fernández‑Callejo1,2, David Endesfelder21, Wolfgang zu Castell22,23,
                                  Pieter S. Hiemstra24, Per Venge25, Elfriede Noessner27, Thasso Griebel1,2, Simon Heath1,2,
                                  Dave Singh15, Ivo Gut1,2 & Loems Ziegler‑Heitbrock3*

                                  Chronic obstructive pulmonary disease (COPD) is a destructive inflammatory disease and the genes
                                  expressed within the lung are crucial to its pathophysiology. We have determined the RNAseq
                                  transcriptome of bronchial brush cells from 312 stringently defined ex-smoker patients. Compared

                                  1
                                   CNAG‑CRG, Centre for Genomic Regulation (CRG), Barcelona Institute of Science and Technology (BIST),
                                  Barcelona, Spain. 2Universitat Pompeu Fabra (UPF), Barcelona, Spain. 3EvA Study Center, Helmholtz Zentrum
                                  Muenchen and Asklepios-Klinik, Gauting, Germany. 4Centre National de Recherche en Génomique Humaine
                                  (CNRGH), Institut de Biologie François Jacob, CEA, Université Paris-Saclay, Evry, France. 5Institute for Lung
                                  Biology and Disease, Helmholtz Zentrum Muenchen, Neuherberg‑Munich, Germany. 6Internal Medicine III,
                                  University Hospital Regensburg, Regensburg, Germany. 7Fraunhofer Institute for Toxicology and Experimental
                                  Medicine, Hannover, Germany. 8Department of Respiratory Medicine, Hannover Medical School, Hannover,
                                  Germany. 9Member of the German Center for Lung Research (DZL), Marburg, Germany. 10Member of the German
                                  Center for Lung Research (DZL), Hannover, Germany. 11Department of Medicine, Pulmonary and Critical Care
                                  Medicine, University Medical Center Giessen and Marburg, Philipps-University, Marburg, Germany. 12Department
                                  of Pneumology, Faculty of Medicine, University of Freiburg, Freiburg, Germany. 13Institute for Lung Health,
                                  NIHR Leicester BRC, University of Leicester, Leicester, UK. 14Department of Respiratory Medicine, University
                                  Hospitals Coventry and Warwickshire NHS Trust, Coventry, UK. 15Medicines Evaluation Unit, University of
                                  Manchester, University Hospital of South Manchester Foundations Trust, Manchester, UK. 16Department of
                                  Pathophysiology, National Koranyi Institute for TB and Pulmonology, Budapest, Hungary. 17Department of
                                  Tumorbiology, National Koranyi Institute for TB and Pulmonology, Budapest, Hungary. 18Department of
                                  Pneumology, National Koranyi Institute for TB and Pulmonology, Budapest, Hungary. 19Department of Medical
                                  Sciences, University of Ferrara and Ferrara City Hospital, Ferrara, Italy. 202nd Department of Respiratory
                                  Medicine, National Institute of Tuberculosis and Lung Diseases, Warsaw, Poland. 21ICT Department, Helmholtz
                                  Zentrum Muenchen, Munich, Germany. 22Department Strategy & Digitalization, Helmholtz Zentrum Muenchen,
                                  Munich, Germany. 23Faculty of Mathematics, Technical University of Munich, Munich, Germany. 24Department
                                  of Pulmonology, Leiden University Medical Center, Leiden, The Netherlands. 25Department of Medical Sciences,
                                  University of Uppsala, Uppsala, Sweden. 26Immunoanalytics‑Core Facility, Helmholtz Zentrum Muenchen,
                                  Munich, Germany. 27Immunoanalytics-Tissue Control of Immunocytes, Helmholtz Zentrum Muenchen, Munich,
                                  Germany. *email: Loems-EvA@gmx.de

Scientific Reports |   (2021) 11:12848               | https://doi.org/10.1038/s41598-021-91742-x                                            1

                                                                                                                                         Vol.:(0123456789)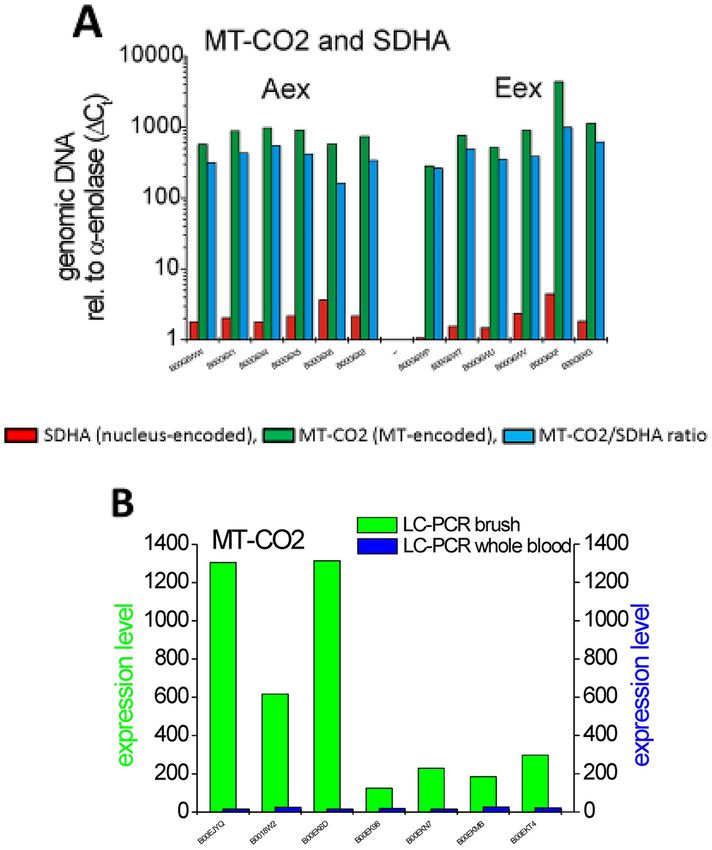
www.nature.com/scientificreports/
to healthy controls there were for males 40 differentially expressed genes (DEGs) and 73 DEGs for
females with only 26 genes shared. The gene ontology (GO) term “response to bacterium” was shared,
with several different DEGs contributing in males and females. Strongly upregulated genes TCN1 and
CYP1B1 were unique to males and females, respectively. For male emphysema (E)-dominant and
airway disease (A)-dominant COPD (defined by computed tomography) the term “response to stress”
was found for both sub-phenotypes, but this included distinct up-regulated genes for the E-sub-
phenotype (neutrophil-related CSF3R, CXCL1, MNDA) and for the A-sub-phenotype (macrophage-
related KLF4, F3, CD36). In E-dominant disease, a cluster of mitochondria-encoded (MT) genes forms
a signature, able to identify patients with emphysema features in a confirmation cohort. The MT-CO2
gene is upregulated transcriptionally in bronchial epithelial cells with the copy number essentially
unchanged. Both MT-CO2 and the neutrophil chemoattractant CXCL1 are induced by reactive
oxygen in bronchial epithelial cells. Of the female DEGs unique for E- and A-dominant COPD, 88%
were detected in females only. In E-dominant disease we found a pronounced expression of mast
cell-associated DEGs TPSB2, TPSAB1 and CPA3. The differential genes discovered in this study point
towards involvement of different types of leukocytes in the E- and A-dominant COPD sub-phenotypes
in males and females.
Abbreviations
A-dominant COPD Airway disease-dominant COPD = COPD with increased airway wall thickness
Aex Aextreme = airway disease-dominant COPD with most pronounced CT phenotype
COPD Chronic obstructive pulmonary disease
cpm Counts per million
CT Computed tomography
DEG Differentially expressed gene
E-dominant COPD Emphysema-dominant COPD = COPD with decreased lung density
Eex Eextreme = emphysema-dominant COPD with most pronounced CT phenotype
EvA Emphysema versus airway disease project
FEV1 Forced expiratory volume in 1 s
FVC Forced vital capacity
LASSO Least absolute shrinkage and selection operator
mixed COPD COPD with both low lung density and high airway wall thickness
MT Mitochondria
normal CT COPD COPD with lung density and airway wall thickness in the range of apparently healthy
controls
RNAseq RNA sequencing
TLCO/Va Transfer factor of the lung for carbon monoxide/alveolar volume
Chronic obstructive pulmonary disease (COPD) was third on the global mortality list of diseases in 20151.
COPD is caused by inhalation of noxious particles from cigarette smoke or open fires and this will trigger,
in susceptible people, a chronic inflammatory process, which can severely damage the airways and the lung
parenchyma2. Patients can present with both of these pathologies but some have predominant destruction of the
parenchyma, termed emphysema, while others have predominant airway disease going along with thick airway
walls. These features can be defined using computed tomography (CT) with image analysis to identify patients
with emphysema-dominant (E-dominant) and airway disease-dominant (A-dominant) d isease3.
Treatment of COPD patients with anti-inflammatory and broncho-dilator drugs can alleviate symptoms,
but currently there is no cure for the disease. Therefore, understanding the inflammatory process and the genes
involved in the process is crucial in order to develop new treatments. To this end, we recruited 534 patients and
280 controls in the Emphysema versus Airway Disease (EvA) study in 10 clinical centers in E urope4. Importantly
patients recruited to this study were ex-smokers for at least one year and had no exacerbation of the disease in the
preceding two months4 such that the inflammatory process in the lung is not biased by such external factors. To
study the inflammatory process we obtained tissue samples from the airways and determined the transcriptome
using RNA sequencing (RNAseq).
Since there is accumulating evidence that gender has an impact on gene expression in various tissues and on
inflammatory diseases5–9, we have hypothesized that the airway transcriptome will be distinct for male and female
COPD. Furthermore, since it is emerging that COPD is not a single disease but consists of different entities, we
have hypothesized that the transcriptome is distinct for males and females also in emphysema-dominant and
airway disease-dominant sub-phenotypes of COPD.
Our analysis, in fact, demonstrates that there are many DEGs unique to males and females in the disease. And
these DEGs point towards a role for neutrophils in male emphysema and for mast cells in female emphysema,
while for male airway disease the DEGs support a role for macrophages.
Results
The transcriptome in COPD bronchial brush samples. Initially we explored the transcriptome of air-
way cells in COPD as such, without any separation of sub-phenotypes. RNA sequencing data for bronchial brush
samples were obtained from 312 COPD cases and from 265 controls (see Table S1 for demographic details). Of
the cases, a total of 259 cases was used as discovery set for identification of differentially expressed genes (DEGs),
Scientific Reports | (2021) 11:12848 | https://doi.org/10.1038/s41598-021-91742-x 2
Vol:.(1234567890)
www.nature.com/scientificreports/
while the altogether 53 cases without CT data were not included and were used for confirmation (Table S2). Per-
mutation analysis revealed 41 DEGs in COPD compared to controls (see Table S3, “male & female combined”).
This included the top upregulated gene TCN1, a Vitamin B12 binding protein highly expressed in neutrophils
and the top downregulated gene SCGB3A1, a gene expressed by club cells of the airway epithelium10. These find-
ings suggest an increase of neutrophils and a decrease of club cells in the COPD lung.
Since mechanisms of inflammatory disease are known to be different for males and females6–9 we then ana-
lysed males (n = 209, 2/3 of samples) and females (n = 103, 1/3 of samples), separately.
Analysis of males alone revealed 40 DEGs including 9 DEGs not detected in the combined analysis (see
Table S3, “male”). Of these, 20 were increased and 20 were decreased fold and the same pattern was confirmed
for the confirmation group (Fig. S1A).
The dominant GO term associated with these 40 DEGs was “defense response” (LTF, IRAK3, PTGFR, SAA2,
SCGB1A1, IL8, FOS, TPSAB1, SAA1, DPP4, GO:0006952, p = 0.00436). This included genes LTF, IRAK3, PTGFR,
SCGB1A1, IL8, FOS that are also covered by the term “response to bacterium” (GO:0009617, p = 0.00924).
The top genes in our analysis (see Table S3) with a 2.5-fold higher expression in male cases were TCN1, highly
expressed in neutrophils as noted above, CEACAM5, a cell adhesion molecule and CA12, a carbonic anhydrase,
an enzyme involved in the conversion of C O2. A 2.5-fold lower expression was found for SCGB3A1.
In females using the same analysis strategy, we detected 73 DEGs (n = 86 female COPD versus n = 73 female
controls, Table S3) including 40 DEGs not detected in the combined analysis (see Table S3, “female”). Only 26
DEGs were in common with males (marked in green in the Table S3). Among the 73 DEGs found in females
34 were increased and 39 were decreased in the discovery and the same pattern was found in the confirmation
group (see Fig. S1B).
The dominant GO term associated with these 73 genes in females was “response to lipid” (LTF, TNC,
LMO3, MAOB, IRAK3, WNT5B, PTGFR, ANXA3, SLIT2, SCGB1A1, AKR1C2, IL8, S100A14, GO: 0033993,
p = 0.000618). A subset of these genes (LTF, MAOB, IRAK3, PTGFR, ANXA3, SCGB1A1, IL8, S100A14) was
covered by the term “response to bacterium” (GO: 0009617, p = 0.0307). The “response to bacterium” genes
LTF, IRAK3, PTGFR, SCGB1A1 and IL8 were shared with males while FOS in males and MAOB, ANXA3 and
S100A14 in females were gender restricted.
For female COPD the top genes (see Table S3) with a 2.5-fold higher expression were CYP1B1, a cytochrome
P450 member, which is involved in steroid metabolism, FGFBP1, a binding protein for fibroblast growth factor,
which may enhance the activity of FGF, CEACAM5, a cell adhesion molecule, and CA12, a carbonic anhydrase
involved in conversion of CO2. The expression of CA12 and CEACAM5 was also seen in the internal confir-
mation and it was confirmed by RT-PCR (see Fig. S2). Of note, the neutrophil associated gene TCN1, which
we detected among all COPD cases and in the separate analysis of males, was not detected among females. A
2.5-fold lower expression in females was found for LTF, i.e. lactoferrin, an antimicrobial protein, and VGLL3, a
co-factor for the TEA domain transcription factors. Also clearly decreased was SCGB3A1, a gene expressed by
epithelial club cells10.
Taken together global analysis of gene expression in bronchial brush cells in COPD uncovers previously
unknown differential expression for a multitude of genes. Our data show that a separate analysis of males and
females uncovers many more differential genes (n = 87) compared to an analysis of males and females combined
with only 41 DEGs. While males and females show a similar regulation of bronchial gene expression for genes
like CA12 and CEACAM5, many of the DEGs are specific to either males or females. This includes TCN1 and
SAA in males and CYP1B1 and VGLL3 in females. Also, the DEGs under the GO term “response to bacterium”
showed a gender specific composition. This indicates that the pathophysiology of COPD is different for males
and females. In order to further explore gender differences in COPD gene expression in the airways, we have
looked into emphysema-dominant and airway disease dominant sub-phenotypes of the disease.
Identification of differential genes for COPD sub‑phenotypes in males. The EvA study has used
CT image analysis to define emphysema-dominant (E) and airway disease-dominant (A) sub-phenotypes of
COPD3. Using the RNAseq data on bronchial brush samples from these cases we analysed controls (n = 145
males) versus E-dominant (n = 50 males) and controls versus A-dominant cases (n = 32 males) and controls
versus Eextreme (Eex, n = 22 males) and versus Aextreme (Aex, n = 16 males). Eex and Aex are the cases with the
most pronounced CT-phenotype, which were selected by rank order of the CT measures of lung density and air-
way wall thickness3. The Eex and Aex samples are included in the E and A samples, respectively (see also under
Supplement: Strategy for identification of DEGs for step by step explanation of data analysis).
With this approach we identified genes, which were unique to E-dominant or A-dominant disease with unique
meaning that a given DEG was only significant for the controls versus E and not for the opposite controls versus
A comparison—and vice versa.
For emphysema (E and Eex) we found at total of 51 unique DEGs. The eight top genes with a > 2.5-fold
increase includes leukocyte associated genes like CSF3R (receptor for granulocyte colony stimulating factor) and
ITGAX (a leukocyte integrin) and the HBB (hemoglobin-beta) gene (Table 1). Here expression of the CSF3R
genes was increased more than threefold in Eex samples but there was only a minimal increase seen in Aex
samples (Table 1, Table S4E).
HBB is thought to be an erythrocyte-restricted gene and its strong expression in airway brush samples comes
unexpected. We therefore took a closer look and we confirmed in these samples the RNAseq data on increased
expression in RT-PCR analysis (Fig. S4). Also, we could detect the transcripts in a lung cell line (data not shown)
indicating that HBB likely can be expressed by bronchial epithelia.
For airway disease (A and Aex) there was a total of 89 unique DEGs. Among the eight top genes (> 2.5-fold
above controls) there are SPP1 (osteopontin), KRT13 (keratin 13) and the macrophage associated CD36 receptor
Scientific Reports | (2021) 11:12848 | https://doi.org/10.1038/s41598-021-91742-x 3
Vol.:(0123456789)www.nature.com/scientificreports/
gene_name ensembl_id cpm_ctl cpm_case Ratio FDR
Top DEGs unique to the E sub-phenotype
ctl vs E
HBB ENSG00000244734.1 81.20 421.79 5.19 0.01959
SELL ENSG00000188404.4 5.02 24.15 4.81 0.00001
IGHA1 ENSG00000211895.3 8.67 25.44 2.93 0.00773
S100A8 ENSG00000143546.5 20.73 56.03 2.70 0.00014
CSF3R ENSG00000119535.13 7.74 24.45 3.16 0.02079
GPR97 ENSG00000182885.12 2.56 13.31 5.20 0.02805
ITGAX ENSG00000140678.12 9.44 25.17 2.67 0.04854
HCAR3 ENSG00000255398.2 11.04 27.83 2.52 0.04379
CXCL1 ENSG00000163739.4 133.36 200.97 1.51 0.00038
MNDA ENSG00000163563.7 13.53 29.91 2.21 0.04268
MT-ND1 ENSG00000198888.2 8087.88 13676.81 1.69 0.00836
MT-CO2 ENSG00000198712.1 9318.08 14155.29 1.52 0.04335
Top DEGs unique to the A sub-phenotype
ctl vs A
Metazoa_SRP ENSG00000266422.1 20.22 71.16 3.52 0.00977
RN7SL1 ENSG00000258486.1 20.22 70.83 3.50 0.01000
RN7SL2 ENSG00000265150.1 34.67 115.33 3.33 0.01497
RNA45S5 ENSG00000225840.1 231.86 595.30 2.57 0.03197
KRT13 ENSG00000171401.10 9.90 47.72 4.82 0.0045
SPP1 ENSG00000118785.9 16.42 45.83 2.79 0,0300
TNC ENSG00000041982.10 37.74 97.25 2,58 0.03118
CD36 ENSG00000135218.13 10.88 36.27 3.33 0.0467
F3 ENSG00000117525.9 199.98 324.69 1.62 0.01322
KLF4 ENSG00000136826.9 39.39 60.44 1.53 0.0452
Table 1. Top and informative differential genes unique to E and A sub-phenotypes of male COPD. The
upper 8 DEGs in each sub-table show the highest differential expression, the remainder are informative
genes analyzed in more detail in this study. Given are the unique DEGs in either E and A sub-phenotypes of
COPD (see Table S4C and S5 for further detail). E = emphysema-dominant, A = airway disease-dominant, For
resolution of E and A into extreme and median, upper and lower quartile see Table S4E.
molecule. Of note, the expression of CD36 is increased more than threefold in Aex samples but there is no
increase whatsoever in Eex samples (Table 1, Table S4E).
For the 51 DEGs unique to E and Eex the dominant GO terms is “response to stress” (Table S5), which cov-
ers 18 DEGs, many of which are among the top genes in Table 1. These 18 DEGs comprise a set of seven genes
related to “mitochondrial ATP synthesis coupled electron transport” and a set of 10 genes that come under the
term “defense response”. The latter set includes genes CSF3R, CXCL1 and MNDA, which are related to neutro-
philic leukocytes.
Also for the 89 DEGs unique to A and Aex cases “regulation of response to stress” was the dominant GO
term covering 14 DEGs. The “regulation of response to stress” also are related to leukocytes, but these genes, like
CD36, F3 and KLF4, are associated with macrophages. These data suggest that there are distinct mechanisms of
stress response operating in the E and A sub-phenotypes of COPD.
String analysis in male COPD sub‑phenotypes. In string analysis we noted for the significant A-DEGs
there were 9 genes directly linked to the fos gene, including some of the “response to stress” genes (Figure S5B).
DEGs in this cluster include the macrophage-associated genes CD36 and KLF4. This indicates that fos may have
a central role in orchestrating inflammation in the bronchi of COPD patients with A-dominant disease.
For the E-DEGs there were interactions of the “response to stress” DEGs mentioned under GO terms and
this includes the neutrophil associated genes MNDA, CSF3R and CXCL1 (Fig. S5A). The genes MNDA and
CSF3R are expressed by neutrophils and their upregulation indicates the presence of neutrophils in the tissue.
On the other hand, CXCL1 is a gene expressed by local tissue like bronchial epithelium and it is chemotactic
for neutrophils. Transcript levels of CXCL1 in the bronchial brush samples showed a positive correlation with
the CSF3R gene (Fig. 1). This suggests that CXCL1, expressed by bronchial epithelial cells, may be involved in
recruiting neutrophils into the airways.
We then analysed the prominent string cluster formed by the eight mitochondrial DEGs (MT-ND1,2,3,5,
MT-CO1,2,3, MT-ATP6, see Fig. S5A). These genes are increased in E-dominant COPD with a high expression
level at around 10,000 cpm. The additional 5 of the total of 13 MT-encoded genes were also increased but are just
below the cut-off. On the other hand, of the 80 nuclear-encoded genes only one showed a significant but minor
Scientific Reports | (2021) 11:12848 | https://doi.org/10.1038/s41598-021-91742-x 4
Vol:.(1234567890)www.nature.com/scientificreports/
Figure 1. Association of the expression levels for neutrophil chemotactic CXCL1 with the neutrophil associated
gene CSF3R. Shown are log transformed expression values in counts per million for CXCL1 and CSF3R in male
A and E samples. p-values were determined using the Spearman’s rank correlation test.
Figure 2. Gene expression level for eight genes encoded by the mitochondrium across all subgroups Shown is
a box plot with median, upper and lower quartile and upper and lower whiskers for the sum of the expression
level for the eight genes (MT-ND1,2,3,5, MT-CO1,2,3, MT-ATP6), Controls versus cases *p < 0.005; **p < 0.001;
Eex versus Aex #p < 0.005, Wilcoxon rank sum test. COPD is all cases combined: E + A + mix + normal-CT.
The figure was produced using the R package ggplot2 (Wickham H (2016). ggplot2: Elegant Graphics for Data
Analysis. Springer-Verlag New York. ISBN 978-3-319-24277-4, https://ggplot2.tidyverse.org).
increase (1.1-fold) at a very low expression level (Table S6). Hence, it appears that the increase of mitochondrial
genes is specific for the MT-encoded genes while nucleus-encoded mitochondrial genes are not affected.
With the mitochondrial genes forming the most pronounced string cluster among E-DEGs we then looked
at the RNAseq expression levels for the entire set of eight mitochondria-encoded genes (GO term: mitochon-
drial ATP synthesis coupled electron transport) in the COPD subgroups. Compared to controls the group of all
COPD cases combined, the E and Eex cases but not the A and Aex cases showed significantly higher levels for
these genes (Fig. 2).
Consistent with the association with the E-dominant COPD, the expression for these MT genes was related
to severity of emphysema in that it showed a positive correlation with total lung capacity and a negative asso-
ciation with FEV1/FVC when tested across all COPD samples (FDR p < 0.05 for both using linear regression).
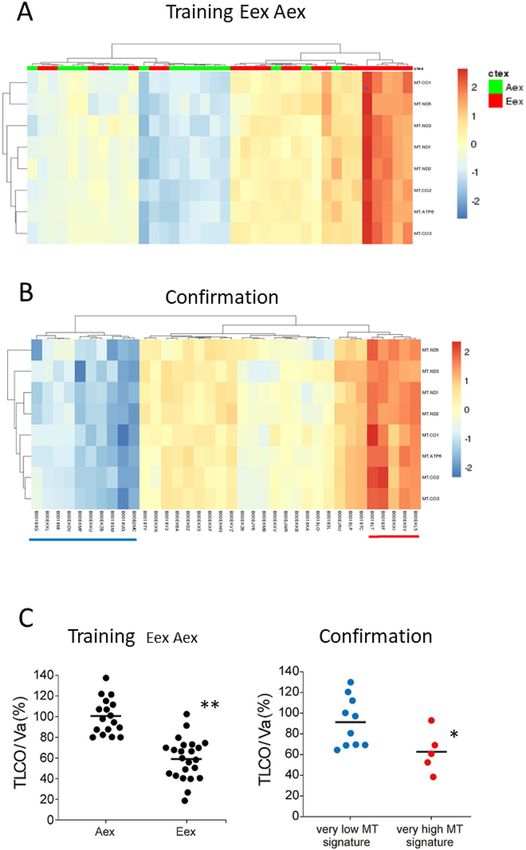
When using the eight MT genes in unsupervised hierarchical clustering we found a separation of Eex and Aex
samples into a low level expression group dominated by Aex samples (green) and high level expression group
dominated by Eex samples (red) (Fig. 3A).
In order to consolidate the MT signature we explored the 36 cases confirmation group, which had not been
included in the original discovery group of samples. These cases were also separated into subgroups with high
and low expression levels (Fig. 3B). Since for the confirmation group no CT data are available to determine the
Scientific Reports | (2021) 11:12848 | https://doi.org/10.1038/s41598-021-91742-x 5
Vol.:(0123456789)www.nature.com/scientificreports/
Figure 3. Mitochondrial signature for COPD sub-phenotypes The eight interacting mitochondrial genes were
tested in un-supervised hierarchical clustering on Eex and Aex samples only (A) and on the confirmation
samples (B). red = Eex; green = Aex. Fisher’s exact for 3A is 0.0036. (C) (left panel) gives TLCO/Va values for
Eex and Aex samples (**p < 0.00001, Mann Whitney U test). (C) (right panel) gives the TLCO/Va values for the
samples with very low MT gene expression marked in blue in Fig. 3B and for the samples with very high MT
gene expression marked red in Fig. 3B (*p < 0.05, Mann–Whitney U test). –- = mean. The figure was produced
using the R package pheatmap, pheatmap: Pretty heatmaps [Software] R Kolde, URL https://CRAN.R-project.
org/package=pheatmap.
Scientific Reports | (2021) 11:12848 | https://doi.org/10.1038/s41598-021-91742-x 6
Vol:.(1234567890)www.nature.com/scientificreports/
E or A phenotype we used the diffusion capacity TLCO/Va as a surrogate marker for CT-defined emphysema3,11.
In our discovery group, TLCO/Va was significantly lower in E as compared to A patients (not shown) and in
Eex as compared to Aex patients (see Fig. 3C). In the confirmation group, TLCO/Va levels were significantly
lower in the 5 samples with very high MT gene levels as compared to the samples with very low expression
levels (Fig. 3C). These data confirm that male patients with emphysema have higher expression levels of these
MT genes. Taken together the MT signature can identify a sub-phenotype of COPD with characteristics of
emphysema-dominant disease.
Molecular analysis of MT‑CO2 in COPD sub‑phenotypes. A possible explanation for the increased
transcript levels for the mitochondria-encoded genes in samples from the Eex patients is an increased number
of mitochondria in the Eex brush material. To test this possibility we exploited the fact that mitochondria con-
tain DNA, which codes for subunits of respiratory chain enzymes, including MT-CO2. Compared to genes in
the nucleus the copy number for these genes per cell is much higher reflecting the number of mitochondria in
a given cell.
PCR on genomic DNA for the MT-CO2 gene in samples with low MT-CO2 transcripts (Aex) gave a 379-fold
higher signal compared to the signal seen for the SDHA gene, which is encoded in the nucleus. When testing
samples with high MT-CO2 transcripts (Eex), then the PCR on genomic DNA for MT-CO2 gave a 440-fold
higher signal compared to the SDHA signal (Fig. 4A).
This value for MT-CO2 DNA is 1.2-fold higher in the Eex samples compared to the Aex samples, while the
MT-CO2 mRNA expression is about 4.0-folder higher in these Eex samples compared to Aex samples with a
mean 30,902 cpm and 8255 cpm, respectively. Hence, the higher MT-CO2 transcripts cannot be explained by a
higher mitochondrial DNA copy number. These data indicate that the increased transcripts for mitochondrial
genes in emphysema patient brush samples is not due to an increase in mitochondria, but reflect an increased
prevalence of these transcripts in the presence of similar mitochondrial content of the cells.
Since the brush samples from patients with E-dominant disease also express several leukocyte-associated
genes, one might speculate that leukocytes within the samples are responsible for the increased MT-transcript
levels. To address this we determined the levels for MT-CO2 transcripts in whole blood samples from selected
patients with high and low brush transcript levels. All blood samples contained very low transcript levels at
around 20 relative units compared to the brush levels with 125 to 1305 relative units (see Fig. 4B), such that
the blood levels are in average 25-fold lower compared to brush. This makes it unlikely that leukocyte derived
MT-CO2 is responsible for the increased MT-CO2 levels in brush samples. It rather points towards an up-
regulation of MT-CO2 transcripts in bronchial epithelium cells in E-dominant COPD.
Interaction of MT genes and leukocyte associated genes. Analysis in the Eex and Aex samples of
the expression levels demonstrates for MT-CO2 and the neutrophil specific CSF3R gene a significant association
(Fig. 5A) while there is no association for MT-CO2 and the macrophage associated gene CD36 (Fig. 5B).
We then asked whether neutrophils might be able to induce transcription of mitochondria-encoded genes.
However, co-culture of the human bronchial epithelial cell line 16 HBE and blood neutrophils with and without
activation did not induce MT-CO2 in the bronchial epithelial cells (data not shown). We therefore turned to genes
involved in neutrophil recruitment and looked at CXCL1, the transcripts of which are also selectively increased
in emphysema dominant COPD (see Table S4C).
CXCL1 is a neutrophil chemoattractant and it is controlled by the transcription factor NF-kB12. Since reac-
tive oxygen species (ROS) are known to be increased in C OPD13 and since ROS can activate NF-kB14, we have
tested the effect of H2O2 on the transcript level of CXCL1 in 16HBE. As shown in Fig. 6a, there is an up to
fourfold increase of CXCL1 transcripts. At the same time the MT-CO2 transcripts are also 1.4-fold induced by
H2O2 (Fig. 6b).
It remains to be determined whether the upregulation of MT-CO2 involves oxidative damage to mitochon-
drial DNA as has been shown in liver tissue15. In any event, the findings suggest that ROS may play a crucial
sub-phenotype specific role in male patients with COPD in that it up-regulates both mitochondrial genes like
MT-CO2 and neutrophil attracting chemokines like CXCL1.
Identification of differential genes for COPD sub‑phenotypes in females. Next, we analysed the
female sample set, which includes half as many samples as the male sample set and therefore provides less sta-
tistical power. Still, when comparing gene expression in controls to the sub-phenotypes in females we found—
when combining analysis at median, upper and lower quartile—a high number of DEGs. For controls versus E
and Eex cases this was altogether 66 unique genes and for controls versus A and Aex cases we found 14 unique
DEGs, with unique requiring an at least 1.5-fold difference and FDR < 0.05 only in comparison to one and not
the other sub-phenotype (Table S4C). For the A and Aex DEGs in females there was no significant GO term. The
dominant GO terms for the E + Eex DEGs were “regulation of apoptotic process” and “defence response”, which
cover overlapping sets of genes, some of which are immune related (Table S5).
The patterns are clearly different from the results in males, for whom “response to stress” was found for the
unique DEGs in both the E and A sub-phenotypes. String analysis for interactions revealed a group of 8 inter-
acting DEGs for E-dominant cases (Fig S8) and neither this subset of DEGs nor the total set of sub-phenotype
specific DEGs gave a significant separation in unsupervised hierarchical clustering (not shown).
Top genes in female control versus E‑dominant and control versus A‑dominant compari‑
sons. The analysis of control versus A-dominant female COPD revealed as top DEG (twofold higher com-
pared to control) the BST2 (bone marrow stromal cell antigen 2, CD317) gene, which is expressed by various
Scientific Reports | (2021) 11:12848 | https://doi.org/10.1038/s41598-021-91742-x 7
Vol.:(0123456789)www.nature.com/scientificreports/
Figure 4. Molecular analysis of MT-CO2 in COPD sub-phenotypes. (A) Using genomic DNA for PCR, data
of tested gene (MT-CO2 and SDHA) and housekeeping gene (alpha-enolase) were processed with the same
settings (e.g. same thresholds). Cycle number of the housekeeping gene was subtracted from the corresponding
gene and its absolute value was subsequently calculated to the power of 2. c t = cycle number at threshold;
MT-CO2/SDHA ratio Aex versus Eex p = 0.33 (Mann Whitney U-Test). The average level for MT-CO2
transcripts was 8255 ± 2938 cpm for Aex samples and 30,902 ± 10,200 cpm for Eex samples (B) MT-CO2
expression levels were determined by RT-PCR using primers given in Table S7 on brush samples and on whole
blood samples from the same individuals. Expression levels were normalized to the levels of alpha-enolase.
Samples 1–4 are Eex cases, samples 5–7 are Aex cases.
Figure 5. Association of MT-CO2 expression levels with neutrophil and macrophage marker genes. Shown are
log transformed expression values in counts per million for MT-CO2 and CSF3R (A) and MT-CO2 and CD36
(B) in male Aex and Eex samples. p-values were determined using the Spearman’s rank correlation test. Analysis
of A and E samples gave the same pattern with a significant correlation for CSF3R but not for CD36, p < 0.0003
and p = 0.062, respectively.
leukocytes, is induced by type I interferon and has antiviral a ctivity16. Top genes expressed at > 2.5-fold higher
levels in E-dominant brush samples included tryptase beta-2 (TPSB2), tryptase alpha-1, beta-1 (TPSAB1) and
carboxypeptidase A3 (CPA3) the latter with a sixfold increase in gene expression over controls (see Table 2). All
of the top genes are unique to females, except for SerpinB2, which is also increased in males, but here the gene
was increased in A-dominant cases and not in E-dominant COPD.
Scientific Reports | (2021) 11:12848 | https://doi.org/10.1038/s41598-021-91742-x 8
Vol:.(1234567890)www.nature.com/scientificreports/
Figure 6. Induction of MT-CO2 and CXCL1 by oxygen peroxide. The effect of H2O2 on both CXCL1 and
MT-CO2 transcripts was studied in the 16HBE cell line (human bronchial epithelial cells). Cells were treated
with H2O2 for 4 hs, RNA was isolated and RT-PCR was performed (for method details see supplement).
Results are normalized to alpha enolase and expressed as fold increase over untreated cells, n = 3 independent
experiments, mean ± SD, *p < 0.05, Mann Whitney U Test. (a) CXCL1 (b) MT-CO2, *p < 0.05.
gene_name ensembl_id cpm_ctl cpm_case Ratio FDR
Top DEGs unique to the E sub-phenotype
ctl vs E
FGFBP1 ENSG00000137440.3 11.55 44.12 3.82 1.71E−08
TPSB2 ENSG00000197253.8 19.49 58.64 3.01 0.04356
CDC20B ENSG00000164287.8 26.30 68.74 2.61 0.00451
ANKRD18A ENSG00000180071.12 11.17 28.90 2.59 0.02803
CPA3 ENSG00000163751.3 10.01 60.80 6.08 0.01515
TPSAB1 ENSG00000172236.11 32.77 115.12 3.51 0.00134
FKBP5 ENSG00000096060.9 45.85 149.93 3.27 4.32E−06
SERPINB2 ENSG00000197632.4 20.44 51,94 2.54 4.28E−06
Top DEGs unique to the A sub-phenotype
ctl vs A
BST2 ENSG00000130303.8 18.00 36.80 2.04 0.04016
Table 2. Top and informative differential genes unique to E and A sub-phenotypes of female COPD. Given
are the unique DEGs in either E and A sub-phenotypes of COPD (see Table S4C and S5 for further detail).
E = emphysema-dominant, A = airway disease-dominant, For resolution of E and A into extreme and median,
upper and lower quartile see Table S4E.
Of note, the tryptases and carboxypeptidase A3 are mast cell associated genes17, suggesting a role for mast
cells in the airways of emphysema-dominant COPD in females, but not in males.
The comparison of male and female unique DEGs for the COPD sub-phenotype reveals a limited overlap of
6 genes for E + Eex and 3 for A + Aex (Table S4C EA male, column CJ). Among the many gender exclusive genes
were the 8 MT genes in males, none of which was shared with females.
On the other hand, there are altogether 71 DEGs only detected in female E + A brush samples (Fig. S9) and
this includes genes like tryptase B2, tryptase AB1 and the peptidase CPA3.
Taken together when looking at COPD—irrespective of any sub-phenotype—26 DEGs are shared between
males and females including CA12 and CEACAM5, but there are 14 DEGs only detected in male COPD and 47
DEGs only in female COPD.
The analysis of DEGs uniquely expressed in COPD sub-phenotypes also reveals clear gender differences. In
males for the E-dominant sub-phenotype there is prominent expression of HBB and there is a mitochondrial
gene signature. Also, in males there is a selective increase in E-dominant COPD of neutrophil associated genes
CSF3R, MNDA and CXCL1. Here both CXCL1 and MT-CO2 are induced by H2O2 suggesting that in male
emphysema reactive oxygen may provide an important pathophysiological mechanism. For females the top dif-
ferential emphysema-restricted genes are the mast cell specific genes TPSB2, TPSAB1 and CPA3.
The cell type specific expression of these genes suggests a role for neutrophils in male E-dominant disease
and a role for mast cells in female E-dominant disease.
The data indicate that COPD E-dominant and A-dominant sub-phenotypes are driven by different genes and
different pathophysiological processes and that there is a strong gender effect.
Scientific Reports | (2021) 11:12848 | https://doi.org/10.1038/s41598-021-91742-x 9
Vol.:(0123456789)www.nature.com/scientificreports/
Discussion
In this study we were able to confirm our hypothesis that gender has an impact on gene expression in the airways
of COPD and its sub-phenotypes. Importantly, we noted in male airway disease-dominant COPD an increased
expression of macrophage associated genes, while in emphysema-dominant COPD neutrophil associated genes
like CSF3R and CXCL1 were increased. At the same time E-dominant male COPD showed a pronounced tran-
scriptional up-regulation of mitochondria-encoded genes like MT-CO2. The induction in a bronchial cell line
of both of MT-CO2 and the neutrophil-attracting chemokine CXCL1 by oxygen peroxide suggests a role for
reactive oxygen in the pathophysiology of male E-dominant COPD.
Looking at COPD as such, our study has uncovered a set of 40 differential genes in bronchial brush samples
in male COPD as compared to control donors. Of these 20 DEGs were downregulated including secretoglobins
SCGB3A1 and SCGB1A1. SCGB1A1 is strongly expressed by club cells and it has been reported to decrease with
smoking18. Our finding of a decrease in ex-smoking COPD patients points toward a persistent damage to these
cells in the disease. Kim et al.19 also focused on male patients and analysed gene expression in lung resection
tissue from tumor patients with COPD. Their top 20 genes did not show any overlap with the DEGs in our study.
This may be due to the fact, that the lung resection samples contain a mixture of many different cell types, while
in our study the focus is on bronchial brush cells.
Morrow et al.20 also analyzed differential genes in resected lung tissue from COPD and controls. None of the
20 top DEGs in that study matched the DEGs we describe herein, which may be explained by the different sample
types (whole lung tissue vs bronchial brush) and by the separate analysis of males and females in our study. In a
transcriptome study on COPD bronchial brush samples Steiling et al.21 reported on 98 differential genes based
on the analysis of 87 cases and 151 controls consisting of males and females and both current and ex-smokers. In
the present study, we detected 60 genes not picked up in the study by Steiling et al.21. This indicates that although
our criteria are more stringent we identify additional genes (see Venn diagram in Fig S3). The lower number of
differential genes in our study may be due to our use of a 10 cpm differential cut-off and to a higher cut-off for
fold-change (1.5-fold) compared to 1.25-fold in Steiling et al.21. Also, in our study current smokers and cases with
recent exacerbations were excluded such that the focus is on the disease process itself. The detection of additional
genes may be due to the sensitivity of RNA sequencing technology used and the difference in the composition
of the patient population. In our study only individuals of European descent were included such that we have a
homogeneous genetic background, which may allow for a better detection of DEGs.
While the top DEGs in our study were also detected in our internal confirmation group, an independent
confirmation of these findings in a sufficiently powered airway transcriptome analysis is still required.
Analysis of differential genes unique to emphysema-dominant and to airway disease dominant COPD
revealed response to stress genes in both sub-phenotypes. The “response to stress” DEGs unique for E-dominant
COPD include genes associated with neutrophils like CSF3R, MNDA and C XCL122–24 and this suggests that
neutrophils might be selectively increased in the airway brush samples from emphysema-dominant disease.
This assumption is in line with the recent demonstration that the 18FDG uptake in the upper zone of the lung
is strongest in COPD patients with the lowest lung density as defined by CT densitometry25 and with the find-
ing of increased blood neutrophils in E-dominant C OPD3. For the A dominant phenotype CD36, F3 and KLF4
were found among the unique DEGs and these are associated with m acrophages26,27. Increased numbers of mac-
rophages and a shift to smaller macrophages in the COPD lung have been noted before28 but this has not been
linked to CT-defined phenotypes in those studies. The associations of different leukocyte signatures in different
sub-phenotypes as shown herein suggest that different mechanisms of inflammation operate in the airways of
E-dominant and A-dominant COPD. The question whether the differential leukocyte signature can be used to
predict diagnosis of COPD sub-phenotypes will require analysis of a larger group of defined COPD patients.
Also, additional studies, including single cell sequencing, are required to confirm the presence of neutrophils
in E-dominant and not in A-dominant disease and the presence of macrophages in A-dominant and not in
E-dominant disease in male COPD patients.
Of note, the direct comparison of E-dominant cases and A-dominant cases did not give any significant DEGs
in our analysis. Only when we added the higher statistical power of a large group of control donor samples and
with that compared controls versus A-dominant cases and controls versus E-dominant cases then we found
unique DEGs, which were specific to A-dominant disease and vice versa.
Another unique set of genes found upregulated in E-dominant male COPD are genes encoded in the mito-
chondrial genome and involved in oxidative phosphorylation, i.e. MT-CO1, MT-CO2, MT-CO3, MT-ND1,
MT-ND2, MT-ND3, MT-ND5 and MT-ATP6. An increase of MT-CO1 and 12 s rRNA encoded in the mito-
chondrial genome has been reported in skeletal muscle tissue in COPD but nuclear encoded genes have not been
studied and patients have not been dissected into sub-phenotypes29. An increased expression of MT-encoded
genes has been noted recently in the alveolar space in COPD and this included MT-CO2 and MT-ND430. Also,
a selective increase in MT-encoded genes, has only been reported in liver tissue after oxidative damage of mito-
chondrial genes15. Our finding of induction of MT-CO2 by H 2O2 in bronchial epithelial cells would be consistent
with this mechanism.
One intriguing biological question is why the MT-encoded genes and the neutrophil-associated genes are co-
expressed in E-dominant COPD. Here we focused on CXCL1, which can be expressed by various cells including
neutrophils and epithelial c ells31,32. The co-induction of both MT-CO2 and CXCL1 by H2O2 in a bronchial epi-
thelial cell suggest that reactive oxygen species may be the crucial link between these genes in E-dominant COPD.
Analysis of DEGs in female COPD-sub-phenotypes revealed many genes with strong differential expression
that do not show a differential expression in males at all or they show a reverse pattern. Also in normal-CT and
mixed COPD, females express genes not seen in male samples (see supplement DEGs in mixed and mild sub-
phenotypes of female COPD and Tables S4A and S4C). Such a differential gene expression is consistent with
Scientific Reports | (2021) 11:12848 | https://doi.org/10.1038/s41598-021-91742-x 10
Vol:.(1234567890)www.nature.com/scientificreports/
findings of gender specific immune responses, which may be due to effects by genes of the system expressed on
sex chromosomes and to effects of sex hormones on the immune response7. When it comes to the innate immune
system, female volunteers show a stronger rise in C-reactive protein and tumor necrosis factor in response to
intravenous lipopolysaccharide6. Furthermore, when looking at the response to smoke inhalation different genes
were induced in blood leukocytes in females and males8. Our data in females give support to the gender specific
gene expression in COPD sub-phenotypes. A notable finding in female E-dominant COPD is the expression of
mast cell associated genes like tryptase B2, tryptase AB1 and the peptidase CPA3, suggesting a role for mast cells
in the pathophysiology of emphysema dominant COPD in females.
Limitations. At this point there is no sizable data set on a bronchial brush transcriptome in COPD available,
such that our findings cannot be analyzed in an external validation cohort. In the present study we have used
an internal confirmation group, which was able to confirm several of the findings. This confirmation group has
limitations, since it lacks the CT image data and there is no separate control group to go along with this patient
group. RNA sequencing data have been confirmed for selected genes by RT-PCR, but these transcript data have
not been confirmed at the protein level. Also, since we have analyzed material from a single bronchial brush in
mild-to-moderated COPD it remains to be shown whether our findings also apply to severe COPD and whether
it is a constant feature in any given patient.
Taken together our data show unique sets of genes in COPD sub-phenotypes pointing towards a role of
neutrophils in male E-dominant disease, a role for macrophages in male A-dominant disease and a role for mast
cells in female E-dominant disease.
Material and methods
(See supplement for methods of RNAseq, RT-PCR and cell culture).
Patients with mild to moderate COPD and controls were recruited after informed consent based on approval
by the respective local Ethics Committees as part of the EvA study4.
Specifically, for the German centers a central approval was obtained from Ethic Committee of the University
Hospital Munich (# 400-07), which covers the approvals from the Ethics Committee of Philipps-University of
Marburg, the Albert-Ludwigs-University of Freiburg, the Medizinische Hochschule Hannover and the Ethic
Committee of the University Hospital Munich. For Budapest, the study was approved by the Medical Research
Council Budapest, Hungary (ETT-TUKEB, 22-278/2007-1018EKU). For Ferrara, the Ethics Committee of the
Province of Ferrara, Italy approved (Nr. 071195 (2007). For Warszawa, it was the Ethics Committee of the
National Tuberculosis and Lung Diseases Research Institute Warszawa, Poland (KE-51/2008). For the UK cent-
ers a central approval was obtained from NHS Research Ethics Committee of Leicestershire, Northamptonshire
and Rutland Research Ethics Committee 2 (08/H0402/19). All methods were performed in accordance with the
in accordance with relevant guidelines and regulations including the Declaration of Helsinki.
Chest CT scans were used to define sub-phenotypes based on lung density and airway wall thickness3. Flex-
ible bronchoscopy with bronchial brushing and bronchoalveolar lavage was performed with mild sedation in
supine position. Bronchial brush samples were taken from the right upper lobe S1, 2 and 3 segment bronchi and
their sub-segments with a protected brush (5 mm diameter at bristle level, #BC-202D 5010; Olympus, Hamburg,
Germany). The brush samples were transferred into RNAprotect immediately and stored at − 20 °C. The bron-
choscopy procedure was done on altogether 699 EvA probands (419 cases, 280 controls) and went along with
a low number of side effects in that post-bronchoscopy bronchitis was noted in two controls donors and seven
patients and a pneumothorax in two patients. Pneumothorax required hospitalisation and patients recovered
within a few days.
All samples were extracted using the AllPrep DNA/RNA Mini Kit (#80204, Qiagen, Hilden, Germany) on a
Qiacube robot. After extraction, RNA concentrations were measured by UV quantification (NanoDrop 8000,
in duplicate). RNA quality was tested by running the samples on a Bioanalyzer 2100 from Agilent, using the
RNA6000 Nano Labchip kit (#5065-4476, Agilent Technologies, Inc., Santa Clara, CA), and allowed to calculate
the RIN value. 390 samples were excluded from RNAseq early on because the RIN was < 5 or the total RNA
amount < 1 µg.
The present study focusses on brush samples from patients with complete CT imaging data of the chest and
patients were divided into subgroups based on CT p henotypes4. These were emphysema-dominant (E), airway
disease-dominant (A), normal-CT and mixed phenotypes. E-cases had a low lung density (15th percentile of lung
density below − 925.6 HU) and little evidence of airway disease (% wall area in the right S1 bronchus < 69.3%).
A-cases had little evidence of emphysema (15th percentile of lung density above − 925.6 HU) and evidence of
airway disease with % wall area the right S1 bronchus > 69.3%3. These cut-offs represent lower limit of normal
and upper limit of normal for lung density and wall area, respectively, as determined in a control population of
apparently healthy controls as described3.The most extreme 50% of the E and A groups were labelled Eex and
Aex. For comparison, brush samples from healthy controls were processed alongside. For the present study only
controls with FEV1/FVC of > 0.75 were used in order to exclude any possible borderline samples with COPD
features. Cases without complete CT data were not used for the discovery but only for confirmation of DEGs
(see Table S2 for breakdown of samples).
Statistical and bioinformatics analysis. Raw read counts were normalized to ‘cpm’ (counts per million)
with the TMM method of the edger R package33, which takes into account different library sizes and different
RNA compositions across samples. Permutation tests were used to detect differential gene expression between
groups of interest. Let Y be a random variable representing the absolute value of the difference in the median,
upper or lower quartile of gene expression between the two groups. The exact distribution of Y, p(Y), under the
Scientific Reports | (2021) 11:12848 | https://doi.org/10.1038/s41598-021-91742-x 11
Vol.:(0123456789)www.nature.com/scientificreports/
null hypothesis that the distribution of gene expression in the two groups was the same was derived by consider-
ing all possible permutations of the group labels (case and control). The p-value of the observed absolute value
of the difference x is then given as p(Y > = x), the proportion of permutations where Y > = x. It should be noted
that this is essentially the same procedure as used for the Fisher’s exact test, and that this test can therefore be
considered as an exact permutation test for quartile differences. The code for the permutation test is available at
GitHub under https://github.com/MarcosFernandez/diffExprPermutation. The permutation approach has the
advantage that it is very robust to outliers. Also, parametric approaches fail when the distribution assumptions
are not met. Finally, the permutation technique can take into account the shape of the distribution such that
upper and lower quartiles can be analyzed.
A gene was regarded as being significantly differentially expressed if the p-value from the permutation test
(corrected for multiple testing) was < 0.05, the absolute difference in median, upper or lower quartile expres-
sion was ≥ 10 cpm and the absolute fold change in expression was ≥ 1.5. Gene ontology enrichment analysis was
performed with DAVID 6.834 and G profiler35 and gene interactive networks were constructed with STRING
v10.536. Heatmaps were drawn with the ‘pheatmap’ R package (https://w ww.R-p rojec t.o
rg/) scaling by row. Group
comparisons were done with Mann Whitney U-Test. Comparison of RNAseq and RT-PCR for gene expression
analysis was performed using Spearmann’s R test (www.sofastatistics.com), Version 1.4.3).
Data availability
Data: The accession code for the bronchial brush transcriptome data is EGAC00001000389. Applicants will be
authorized by the data accession committee after having submitted a project describing the intended analysis.
Biological material: The study uses bronchial brush material from cases and controls. There is limited material
remaining that can be released upon request.
Received: 14 November 2020; Accepted: 20 May 2021
References
1. Mortality, G.B.D. & Causes of Death, C. Global, regional, and national life expectancy, all-cause mortality, and cause-specific
mortality for 249 causes of death, 1980–2015: a systematic analysis for the Global Burden of Disease Study 2015. Lancet 388,
1459–1544 (2016).
2. Decramer, M. & Vogelmeier, C. Global Strategy for the Diagnosis, Management, and Prevention of COPD (updated 2015). (Global
Initiative For Chronic Obstructive Lung Disease, 2015).
3. Subramanian, D. R. et al. Emphysema- and airway-dominant COPD phenotypes defined by standardised quantitative computed
tomography. Eur. Respir. J. 48, 92–103 (2016).
4. Ziegler-Heitbrock, L. et al. The EvA study: aims and strategy. Eur. Respir. J. 40, 823–829 (2012).
5. Oliva, M. et al. The impact of sex on gene expression across human tissues. Science 369 (6509), eaba3066 (2020).
6. van Eijk, L. T. et al. Gender differences in the innate immune response and vascular reactivity following the administration of
endotoxin to human volunteers. Crit. Care Med. 35, 1464–1469 (2007).
7. Fish, E. N. The X-files in immunity: sex-based differences predispose immune responses. Nat. Rev. Immunol. 8, 737–744 (2008).
8. Faner, R., Gonzalez, N., Cruz, T., Kalko, S. G. & Agusti, A. Systemic inflammatory response to smoking in chronic obstructive
pulmonary disease: evidence of a gender effect. PLoS ONE 9, e97491 (2014).
9. Han, M. K. Chronic obstructive pulmonary disease in women: a biologically focused review with a systematic search strategy. Int.
J. Chron. Obstruct. Pulmon. Dis. 15, 711–721 (2020).
10. Jackson, B. C. et al. Update of the human secretoglobin (SCGB) gene superfamily and an example of “evolutionary bloom” of
androgen-binding protein genes within the mouse Scgb gene superfamily. Hum. Genomics 5, 691–702 (2011).
11. D’Anna, S. E. et al. High-resolution computed tomography quantitation of emphysema is correlated with selected lung function
values in stable COPD. Respiration 83, 383–390 (2012).
12. Amiri, K. I. & Richmond, A. Fine tuning the transcriptional regulation of the CXCL1 chemokine. Prog. Nucleic Acid Res. Mol. Biol.
74, 1–36 (2003).
13. Rahman, I., Morrison, D., Donaldson, K. & MacNee, W. Systemic oxidative stress in asthma, COPD, and smokers. Am. J. Respir.
Crit. Care Med. 154, 1055–1060 (1996).
14. Schmidt, K. N., Traenckner, E. B., Meier, B. & Baeuerle, P. A. Induction of oxidative stress by okadaic acid is required for activation
of transcription factor NF-kappa B. J Biol Chem 270, 27136–27142 (1995).
15. Suliman, H. B., Carraway, M. S. & Piantadosi, C. A. Postlipopolysaccharide oxidative damage of mitochondrial DNA. Am. J. Respir.
Crit. Care Med. 167, 570–579 (2003).
16. Le Tortorec, A., Willey, S. & Neil, S. J. Antiviral inhibition of enveloped virus release by tetherin/BST-2: action and counteraction.
Viruses 3, 520–540 (2011).
17. Voehringer, D. Protective and pathological roles of mast cells and basophils. Nat. Rev. Immunol. 13, 362–375 (2013).
18. Hackett, N. R. et al. RNA-Seq quantification of the human small airway epithelium transcriptome. BMC Genomics 13, 82 (2012).
19. Kim, W. J. et al. Comprehensive analysis of transcriptome sequencing data in the lung tissues of COPD subjects. Int. J. Genomics
2015, 206937 (2015).
20. Morrow, J. D. et al. Functional interactors of three genome-wide association study genes are differentially expressed in severe
chronic obstructive pulmonary disease lung tissue. Sci. Rep. 7, 44232 (2017).
21. Steiling, K. et al. A dynamic bronchial airway gene expression signature of chronic obstructive pulmonary disease and lung func-
tion impairment. Am. J. Respir. Crit. Care Med. 187, 933–942 (2013).
22. Demetri, G. D. & Griffin, J. D. Granulocyte colony-stimulating factor and its receptor. Blood 78, 2791–2808 (1991).
23. Briggs, R. C. et al. Dysregulated human myeloid nuclear differentiation antigen expression in myelodysplastic syndromes: evidence
for a role in apoptosis. Cancer Res. 66, 4645–4651 (2006).
24. Baggiolini, M., Dewald, B. & Moser, B. Interleukin-8 and related chemotactic cytokines–CXC and CC chemokines. Adv. Immunol.
55, 97–179 (1994).
25. Subramanian, D. R. et al. Assessment of pulmonary neutrophilic inflammation in emphysema by quantitative positron emission
tomography. Am. J. Respir. Crit. Care Med. 186, 1125–1132 (2012).
26. Cao, Z., Sun, X., Icli, B., Wara, A. K. & Feinberg, M. W. Role of Kruppel-like factors in leukocyte development, function, and
disease. Blood 116, 4404–4414 (2010).
27. Greenwalt, D. E. et al. Membrane glycoprotein CD36: a review of its roles in adherence, signal transduction, and transfusion
medicine. Blood 80, 1105–1115 (1992).
Scientific Reports | (2021) 11:12848 | https://doi.org/10.1038/s41598-021-91742-x 12
Vol:.(1234567890)www.nature.com/scientificreports/
28. Frankenberger, M. et al. Chemokine expression by small sputum macrophages in COPD. Mol. Med. 17, 762–770 (2011).
29. Sauleda, J. et al. Cytochrome oxidase activity and mitochondrial gene expression in skeletal muscle of patients with chronic
obstructive pulmonary disease. Am. J. Respir. Crit. Care Med. 157, 1413–1417 (1998).
30. Baßler, K. et al. Alterations of multiple alveolar macrophage states in chronic obstructive pulmonary disease. BioRxiv https://doi.
org/10.1101/2020.05.28.121541 (2020).
31. Gasperini, S., Calzetti, F., Russo, M. P., De Gironcoli, M. & Cassatella, M. A. Regulation of GRO alpha production in human
granulocytes. J. Inflamm. 45, 143–151 (1995).
32. Becker, S., Quay, J., Koren, H. S. & Haskill, J. S. Constitutive and stimulated MCP-1, GRO alpha, beta, and gamma expression in
human airway epithelium and bronchoalveolar macrophages. Am. J. Physiol. 266, L278-286 (1994).
33. Robinson, M. D. & Oshlack, A. A scaling normalization method for differential expression analysis of RNA-seq data. Genome Biol.
11, R25 (2010).
34. da Huang, W., Sherman, B. T. & Lempicki, R. A. Bioinformatics enrichment tools: paths toward the comprehensive functional
analysis of large gene lists. Nucleic Acids Res. 37, 1–13 (2009).
35. Reimand, J. et al. g:Profiler-a web server for functional interpretation of gene lists (2016 update). Nucleic Acids Res. 44, W83-89
(2016).
36. Szklarczyk, D. et al. STRING v10: protein-protein interaction networks, integrated over the tree of life. Nucleic Acids Res. 43,
D447-452 (2015).
Acknowledgements
This work was supported by the European Union, FP7 project # 200506. We acknowledge the helpful discussions
with Emanuele Raineri, Barcelona, Spain and with Wilfried Karmaus, Division of Epidemiology, Biostatistics,
and Environmental Health, School of Public Health, University of Memphis, Memphis, Tennessee, USA. CNAG-
CRG lab is a member of the Spanish National Bioinformatics Institute (INB), PRB2-ISCIII and is supported by
grant PT13/0001 of the PE I+D+i 2013-2016, funded by ISCIII and FEDER. Work by CB at Leicester and by
LZH at Munich was also supported the European Union FP7 project # 270194.
Author contributions
L.Z.H., I.G., C.B., D.S. conceived the project, L.Z.H. led the project and L.Z.H., D.B., A.E.C., T.P.H., A.B. and I.G.
managed the project. A.E.C., T.P.H., D.B., M.S.H.N., W.G., A.B., R.O., M.T.B., J.F.D., W.M., O.S., M.S.A., K.R.,
J.H., T.W., T.F., L.J., A.R.K., T.G., A.P., J.M.Q., S.G., C.B., D.R.S., D.G.P., U.K., V.G., I.B., B.D., J.S., M.S., M.P.,
P.B., D.K., D.G., A.M., M.D., M.F.C., D.E., W.zC., P.S.H., P.V., E.N., T.G., S.M., D.S., I.G. and L.Z.H. generated,
processed and analyzed the data. L.Z.H., A.E.C., T.P.H., I.G. and D.S. drafted the manuscript. All authors edited
and approved the manuscript.
Funding
Open Access funding enabled and organized by Projekt DEAL.
Competing interests
Dr. Deleuze, Dr. Moeller, Dr. Schmid, Dr. Soler Artigas, Dr. Fernandez-Callejo, Dr. Renner, Dr. Koczulla, Dr.
Kolsum, Dr. Vandana Gupta, Dr. Dabad, Dr. Endesfelder, Dr. zu Castell, Dr. Noessner and Dr. Griebel have
nothing to disclose. Dr. Esteve-Codina, Dr. Hofer, Dr. Burggraf, Dr. Heiß-Neumann, Dr. Gesierich, Dr. Boland,
Dr. Olaso, Dr. Bihoreau, Dr. Jerrentrup, Dr. Müller-Quernheim, Dr. Subramanian, Dr. Dome, Dr. Strausz, Dr.
Stendardo, Dr. Piattella Dr. Boschetto, Dr. Górecka, Dr. Venge, Dr. Heath and Dr. Gut report grants from Euro-
pean Union during the conduct of the study. Dr. Hohlfeld reports grants from European Union, during the
conduct of the study; personal fees from Boehringer Ingelheim, grants from AstraZeneca AB, grants from
Novartis, grants from Janssen Pharmaceutica NV, grants from ALK, grants from Boehringer Ingelheim, grants
from LETI, grants from GlaxoSmithKline, GSK, grants from Sanofi-Aventis, personal fees from Merck & Co,
Inc., personal fees from Novartis, grants from Astellas Pharma, grants from Allergopharma, outside the submit-
ted work; .Dr. Welte reports grants from European Union, during the conduct of the study; personal fees from
AstraZeneca, Boehringer Ingelheim, Novartis, GSK, outside the submitted work. Dr. Fuehner reports personal
fees from AstraZeneca, Boehringer Ingelheim, Novartis and Grifols outside the submitted work. Dr. Greulich
reports grants from European Union, during the conduct of the study; personal fees from Astra Zeneca, personal
fees from Berlin-Chemie, personal fees from Boehringer-Ingelheim, personal fees from Chiesi, personal fees
from CSL-Behring, grants and personal fees from Grifols, personal fees from GSK, personal fees from Novartis,
grants from German Centre for Lung Research (DZL), outside the submitted work. Dr. Prasse reports grants
from European Union, during the conduct of the study; personal fees from Boehringer Ingelheim, personal fees
from Roche Pharma, personal fees from Abbvie, personal fees from Novartis, personal fees from SanofiAventis,
personal fees from Nitto Denko, personal fees from Pliant, outside the submitted work. Dr. Gupta reports grants
from European Union, other from National Institute for Health Research (NIHR), during the conduct of the
study; grants from The Royal College of Radiologists, grants from The Academy of Medical Sciences, outside
the submitted work. Dr. Brightling reports grants from European Union, grants from European Union, during
the conduct of the study; grants and personal fees from AZ/MedImmune, grants and personal fees from GSK,
grants and personal fees from Novartis, grants and personal fees from Chiesi, grants and personal fees from
BI, personal fees from TEVA, grants from Roche/Genentech, personal fees from SanofiGenzyme, personal fees
from Regeneron, grants and personal fees from Gossamer, grants and personal fees from 4DPharma, grants and
personal fees from Mologic, outside the submitted work. Dr. Parr reports grants from European Union, during
the conduct of the study; personal fees from CSL BEHRING, outside the submitted work. Dr. Barta reports
grants from European Union, during the conduct of the study; non-financial support from Sandoz, non-financial
support from Berlin-Chemie, outside the submitted work. Dr. Korzybski reports grants from European Union,
during the conduct of the study; personal fees from Roche, personal fees from Boehringer Ingelheim, outside the
submitted work. Dr. Nowinski reports grants from European Union, during the conduct of the study; personal
Scientific Reports | (2021) 11:12848 | https://doi.org/10.1038/s41598-021-91742-x 13
Vol.:(0123456789)You can also read