Comparative Gene-Expression Analysis of Alzheimer's Disease Progression with Aging in Transgenic Mouse Model - MDPI
←
→
Page content transcription
If your browser does not render page correctly, please read the page content below
International Journal of
           Molecular Sciences

Article
Comparative Gene-Expression Analysis of
Alzheimer’s Disease Progression with Aging in
Transgenic Mouse Model
Noman Bin Abid 1,† , Muhammad Imran Naseer 2,† and Myeong Ok Kim 1, *
 1    Division of Life Science and Applied Life Science (BK 21), College of Natural Sciences, Gyeongsang National
      University, Jinju 660-701, Korea; noman_abid@gnu.ac.kr
 2    Center of Excellence in Genomic Medicine Research, Department of Medical Laboratory Technology,
      Faculty of Applied Medical Sciences, King Abdulaziz University, Jeddah 21589, Saudi Arabia;
      mimrannaseer@yahoo.com
 *    Correspondence: mokim@gnu.ac.kr; Tel.: +82-55-772-1345; Fax: +82-55-772-1349
 †    These authors contributed equally to this work.

 Received: 1 February 2019; Accepted: 6 March 2019; Published: 11 March 2019

 Abstract: Alzheimer’s disease (AD) is a multifactorial neurodegenerative disorder characterized
 by progressive memory dysfunction and a decline in cognition. One of the biggest challenges
 to study the pathological process at a molecular level is that there is no simple, cost-effective,
 and comprehensive gene-expression analysis tool. The present study provides the most
 detailed (Reverse transcription polymerase chain reaction) RT-PCR-based gene-expression assay,
 encompassing important genes, based on the Kyoto Encyclopedia of Genes and Genomes (KEGG)
 disease pathway. This study analyzed age-dependent disease progression by focusing on pathological
 events such as the processing of the amyloid precursor protein, tau pathology, mitochondrial
 dysfunction, endoplasmic reticulum stress, disrupted calcium signaling, inflammation, and apoptosis.
 Messenger RNA was extracted from the cortex and hippocampal region of APP/PS1 transgenic mice.
 Samples were divided into three age groups, six-, nine-, and 12-month-old transgenic mice, and they
 were compared with normal C57BL/6J mice of respective age groups. Findings of this study provide
 the opportunity to design a simple, effective, and accurate clinical analysis tool that can not only
 provide deeper insight into the disease, but also act as a clinical diagnostic tool for its better diagnosis.

 Keywords: Alzheimer’s disease; dementia; clinical diagnosis; gene expression

1. Introduction
     Alzheimer’s disease (AD) is a multifactorial age-associated neurodegenerative disorder.
AD gradually progresses by affecting different areas of the brain, including the cerebral cortex and
hippocampus, starting from the frontal and temporal lobes and then gradually spreading to other parts
of the brain [1]. Overproduction and accumulation of amyloid beta (Aβ) leads to the formation of Aβ
plaques. Plaques are not only evident in extracellular spaces, but also when they start depositing on
blood-vessel walls [2]. The second biggest hallmark of AD is aggregation of the microtubule-associated
protein tau, which forms neurofibrillary tangles (NFTs) in neurons. Amyloid beta plaques and tau
neurofibrillary tangles collectively lead to neurodegeneration, synaptic dysfunction, and dementia [3].
Clinical symptoms include severe and progressive memory loss, as well as a decline in language skills,
including spatial and temporal orientations [4].
     Recent epidemiological studies showed that Alzheimer’s disease and nonspecified dementia
are more prevalent in women than in men [5]. According to the Australian Bureau of Statistics,
approximately 66% of deaths due to dementia in Australian population were among women [6].

Int. J. Mol. Sci. 2019, 20, 1219; doi:10.3390/ijms20051219                           www.mdpi.com/journal/ijms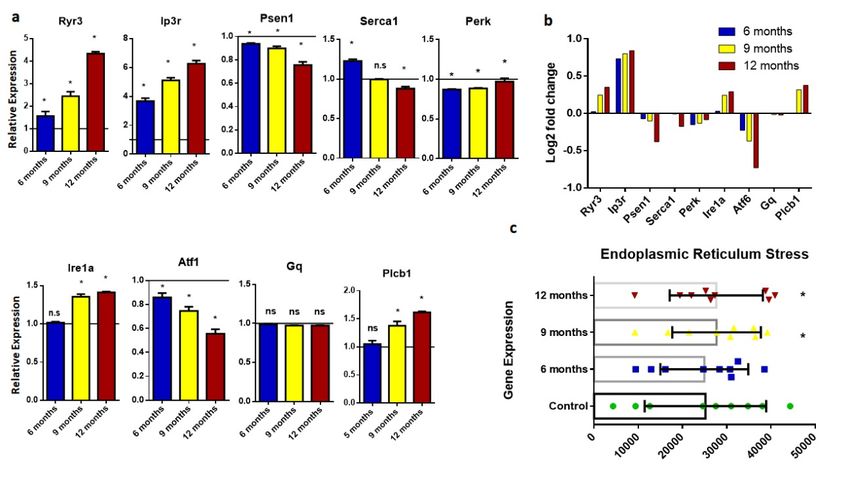
Int. J. Mol. Sci. 2019, 20, 1219                                                                  2 of 14

Recent evidence suggests that the prevalence of Alzheimer’s disease is consistent across the global
population, and that the average duration of AD illness is 8–10 years, whereas the preclinical and
prodromal stages span over two decades, suggesting that the mean onset of sporadic AD occurs at the
age of 80 [7].
     AD pathology is associated with the accumulation of Aβ plaques. Aβ is produced by the
proteolytic cleavage of the amyloid precursor protein (APP) by gamma secretase and beta-secretase
enzymes, including presenilin 1 (PSEN1) and presenilin 2 (PSEN2) [8]. To date, Aβ, APOE, and tau
have been considered the main contributors to the onset of the disease, leading to neuropathological
conditions such as selective neuronal death, synaptic loss, decline in neurotransmitters, and deposition
of abnormal proteins, such as Aβ plaques and NFTs. Major risk factors for AD include diabetes
mellitus, midlife hypertension, midlife obesity, a sedentary lifestyle, depression, smoking, and low
educational attainment [9].
     One of the biggest challenges related to AD is its diagnosis, not only during the prodromal
stage but also in the dementia phase. Almost 35% of clinically diagnosed patients with AD were
misdiagnosed and even showed negative Aβ positron emission tomography (PET) scans [10,11].
Age-associated diseases, as well as comorbidities including cardiovascular disease and hippocampal
sclerosis, make this disease more complex to clearly diagnose. Previously, diagnosis was only
possible by postmortem brain-sample analysis until the introduction of PET imaging using Pittsburgh
compound B, which is a radioactive analog of fluorescent dye Thioflavin T that has the ability to cross
the blood–brain barrier and interact with fibrillary Aβ [12]. Along with PET scans for the detection
of amyloid beta concentration in cerebrospinal fluid, plasma and peripheral tissue have also been
monitored to design more comprehensive diagnostic tools.
     Among the many challenges related to AD, one is the lack of detailed and comprehensive
diagnostic tools [4]. To comprehend this multifactorial disease involving several molecular events
spanning many genes, a detailed analytical tool is crucial. Gene-expression analysis is the most
appropriate tool to address this issue. Quantification of gene expression has been performed
using RNA-based techniques such as real-time quantitative PCR (Polymerase chain reaction),
microarray analysis, and next-generation sequencing (NGS). These tools are very efficient and accurate
but costly, making them unaffordable as diagnostic tools in the public sector of developing countries.
The main purpose of the present study is to devise a cost-effective, efficient, and comprehensive
method to dissect the molecular basis of AD. The outcome of the present study helps in pinpointing
the most important genes involved in the onset and pathology of this disease, which could help
in designing a low-cost but effective diagnostic assay for the clinical diagnosis of this challenging
neurodegenerative disease.
     Several pathological events at the molecular level collectively form an interlinked complex
pathway that spans numerous genes involved in disease onset and progression. Detailed analysis
of such a pathway can provide effective therapeutic strategies to target specific molecular events
responsible for disease onset. In this regard, the Kyoto Encyclopedia of Genes and Genomes
(KEGG) provides a detailed pathway that shows the roles of numerous genes involved in various
molecular and pathological events associated with this disease [13]. The present study provides
a detailed RNA-based gene-expression assay of 50 of the most important genes, covering all
molecular events: APP processing, tau pathology, mitochondrial dysfunction, endoplasmic reticulum
stress, neuroinflammation, and apoptosis. The present study analyzed in vivo mouse models for
AD. The APP/Presenilin1 transgenic mouse was further divided into three age groups (six, nine,
and 12 months) to visualize age-dependent changes in gene-expression levels. The outcome of this
study provides insight into understanding the disease’s onset by dissecting its molecular events, and is
also helpful for designing a diagnostic tool. This study also helps evaluate the roles of therapeutic
agents to mitigate this disease and its pathology.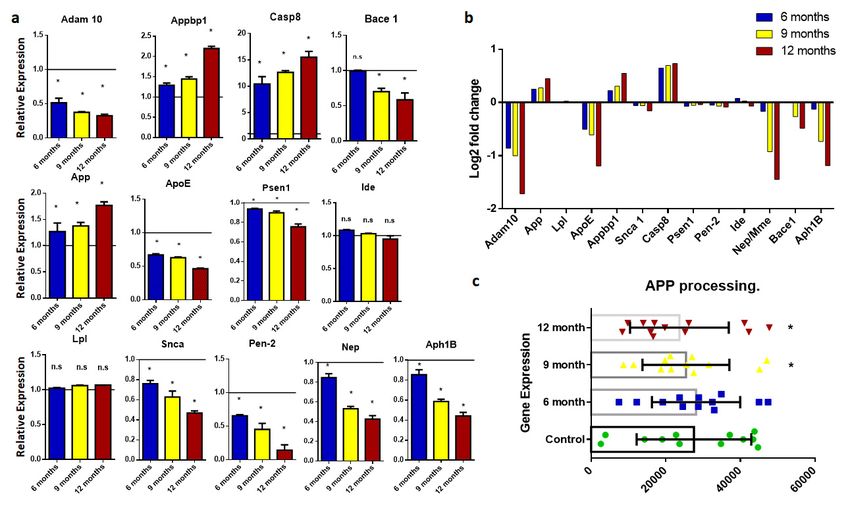
Int. J. Mol. Sci. 2019, 20, 1219                                                                                           3 of 14

2. Results

2.1.
Int. J.Amyloid    Precursor
       Mol. Sci. 2018,        Protein
                       19, x FOR PEER Processing
                                      REVIEW                                                                               3 of 16

     APP disturbances lead to the synthesis and accumulation of amyloid beta, which is a major
     APP disturbances lead to the synthesis and accumulation of amyloid beta, which is a major
hallmark of neurodegeneration. This study includes several important genes involved in APP
hallmark of neurodegeneration. This study includes several important genes involved in APP
processing, such as Adam10, App, Lpl, ApoE, Appbp1, Snca, Casp8, Psen1, Pen-2, Ide, Nep, Base1,
processing, such as Adam10, App, Lpl, ApoE, Appbp1, Snca, Casp8, Psen1, Pen-2, Ide, Nep, Base1, Ncstn,
Ncstn, and Aph1b. PCR-based expression analysis showed that App, Snca, Appbp, Lpl, and Casp8
and Aph1b. PCR-based expression analysis showed that App, Snca, Appbp, Lpl, and Casp8 were
were significantly overexpressed in AD transgenic mouse models as compared to wild-type mice
significantly overexpressed in AD transgenic mouse models as compared to wild-type mice (Figure
(Figure 1). Moreover, significantly decreased expression of Adam10, ApoE, Psen1, Pen-2, Nep, Bace1,
1). Moreover, significantly decreased expression of Adam10, ApoE, Psen1, Pen-2, Nep, Bace1, Ncstn,
Ncstn, and Aph1b was observed in AD groups. All of the above-mentioned genes are responsible for
and Aph1b was observed in AD groups. All of the above-mentioned genes are responsible for APP
APP processing. Change in the expression level of these genes as compared to normal leads to amyloid
processing. Change in the expression level of these genes as compared to normal leads to amyloid
beta production, which is responsible for senile plaques.
beta production, which is responsible for senile plaques.

      Figure 1. Expression analysis of genes involved in amyloid precursor protein procession.
      Figure
      (a)      1. Expression
          Histograms             analysis
                       representing          of genes
                                       relative mRNAinvolved
                                                          expressioninofamyloid
                                                                         Adam10, precursor      protein
                                                                                    App, Lpl, Appb1,       procession.
                                                                                                        ApoE,            (a)
                                                                                                               Snca, Casp8,
      Histograms    representing    relative  mRNA      expression   of Adam10,    App,  Lpl, Appb1,    ApoE,
      Psen1, Pen-2, Bace 1, Ide, Nep, Ncstn, and Aph1B. Represented values are the mean and SD obtained from   Snca, Casp8,
      Psen1,individual
      three   Pen-2, Bace  1, Ide, Nep,performed
                        experiments       Ncstn, andforAph1B.   Represented
                                                          each sample.         values
                                                                         The line       are x-axis
                                                                                   on the    the mean
                                                                                                   at 1.0and  SD obtained
                                                                                                          shows   the gene
      expression of control samples. (b) Bar plots representing fold-change values represented inshows
      from  three individual   experiments     performed    for each  sample.   The  line on  the x-axis  at 1.0        the
                                                                                                                  the log2
      gene  expression   of control  samples.    (b) Bar  plots representing    fold-change    values   represented
      scale showing gene expression in the brain of six-, nine-, and 12-month-old samples. Baseline shows            in the
      log2 scale in
      expression  showing
                     control gene  expression
                             samples.             in the brain
                                         (c) Scattered-dot  plotof six-, gene
                                                                 shows   nine-,expression
                                                                                 and 12-month-old
                                                                                            involved in samples.
                                                                                                          amyloidBaseline
                                                                                                                   protein
      shows expression
      processing.           in control
                   * Expression           samples. different
                                  is significantly    (c) Scattered-dot   plot(WT)
                                                               to wild type      shows
                                                                                    (p ≤gene
                                                                                          0.05).expression     involved in
                                                                                                  n.s., Nonsignificant.
      amyloid protein processing. * Expression is significantly different to wild type (WT) (p ≤ 0.05). n.s.,
2.2. Tau  Pathology
      Nonsignificant.
      The tau protein, an abundant microtubule-stabilizing protein, has no direct involvement in AD
2.2. Tau Pathology
pathology, but is instead an indirect consequence of Aβ overproduction. The hyperphosphorylation
of tauThe
       protein  is responsible
           tau protein,          for microtubule
                         an abundant             destabilization,
                                        microtubule-stabilizing     thus leading
                                                                  protein,  has noto  neurodegeneration
                                                                                    direct involvement inand
                                                                                                           AD
deficits in synaptic
pathology,            transmission
             but is instead          and consequence
                              an indirect memory [14].ofGenes    including Caln,The
                                                          Aβ overproduction.       Nos1,  Gsk3b, and Mapt/tau
                                                                                        hyperphosphorylation
show
of tausignificant
        protein is overexpression
                   responsible forin   AD mice (Figure
                                     microtubule        2). Increased
                                                  destabilization,  thusexpression
                                                                          leading tois neurodegeneration
                                                                                       evident with increasing
                                                                                                           and
age.   Genes  such   as P25   and  Cdk5,  which are involved   in  tau  hyperphosphorylation,
deficits in synaptic transmission and memory [14]. Genes including Caln, Nos1, Gsk3b, and Mapt/tau showed   no
show significant
overexpression       overexpression
                 in mice                inmonths
                          at six and nine  AD mice    (Figure
                                                 of age, while 2).
                                                                thereIncreased   expression
                                                                       was significantly      is evident
                                                                                          increased       with
                                                                                                    expression
increasing
at the age ofage.
               12 Genes
                    months.such   as P25
                               These      and Cdk5,
                                      expression     whichshowed
                                                 analyses     are involved    in pathology
                                                                       that tau   tau hyperphosphorylation,
                                                                                              progressed with
showed noage.
increasing    overexpression in mice at six and nine months of age, while there was significantly
increased expression at the age of 12 months. These expression analyses showed that tau pathology
progressed with increasing age.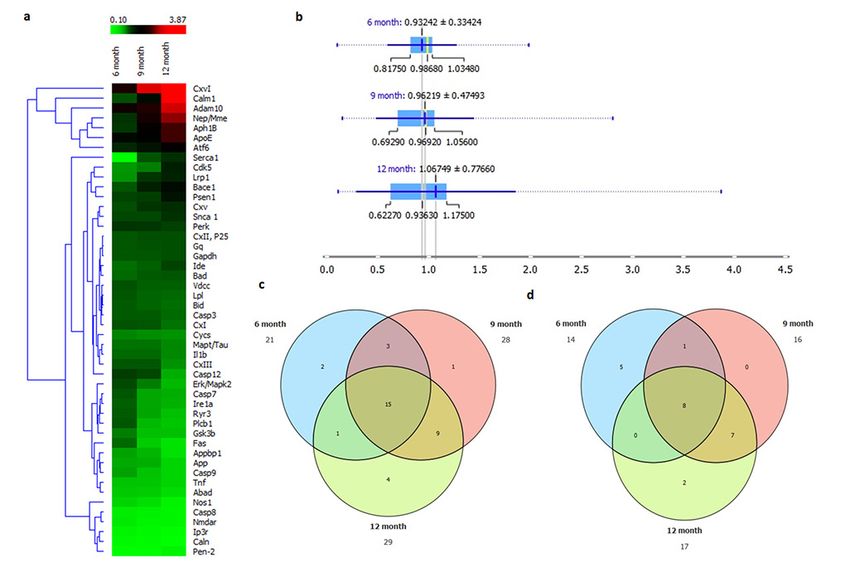
Int. J. Mol. Sci. 2019, 20, 1219 4 of 14
Int. J. Mol. Sci. 2018, 19, x FOR PEER REVIEW 4 of 16
Figure 2. Expression analysis of genes involved in taupathology. (a) Histograms representing relative
Figure 2. Expression analysis of genes involved in taupathology. (a) Histograms representing relative
mRNA expression of Caln, Cdk5, p25, Nos1, Gsk3b, and tau. Represented values are the obtained mean
mRNA expression and SD Caln,
offrom threeCdk5, p25,
individual Nos1, Gsk3b,
experiments performed and tau.sample.
for each Represented
The line on the values
x-axis atare
1.0 the obtained
mean and SD from showsthree
the gene expression experiments
individual of control samples. (b) Bar plotsfor
performed representing
each sample.fold-change
Thevalues
line on the x-axis
represented in the log2 scale showing gene expression in the brain of six-, nine-, and 12-month-old
at 1.0 shows thesamples.
gene Baseline
expression of control
shows expression samples.
in control samples.(b) Bar plotsplot
(c) Scattered-dot representing fold-change values
shows gene expression
represented in the log2in scale
involved showing
tau pathology. geneisexpression
* Expression in theto brain
significantly different of six-,
WT (p ≤ 0.05). nine-, and 12-month-old
n.s., Nonsignificant.
samples. Baseline shows expression in control samples. (c) Scattered-dot plot shows gene expression
2.3. Endoplasmic Reticulum (ER) Stress
involved in tau pathology. * Expression is significantly different to WT (p ≤ 0.05). n.s., Nonsignificant.
ER stress in postmortem brains from AD patients, animals, and in vitro models indicated that
ER dysfunction might play an important role in causing AD pathogenesis [15]. ER stress is associated
2.3. Endoplasmicwith
Reticulum
many AD (ER) Stress
pathologies, including mutations in presenilin 1 and presenilin 2, Aβ production, tau
pathology, and apoptosis. In this study, the expression of genes including Ryr3, Ip3r, Psen1, Serca1,
ER stress inPerk,
postmortem brains
Ire1a, Atf6, Gq, and from
Plcb1 was AD (Figure
analyzed patients, animals,
3). Expression andshowed
analysis in vitro
that models
Ryr3, Ip3R, indicated that
ER dysfunction Ire1a,
might andplay an important
Plcb1 were overexpressedrole inincausing
in vivo AD pathogenesis
AD mice compared [15].ByER
to the control group. stress is associated
contrast,
the expression levels of Psen1, Serca1, Atf6, and Gq were significantly lower in the disease group.
with many AD pathologies, including mutations in presenilin 1 and presenilin 2, Aβ production,
tau pathology, and apoptosis. In this study, the expression of genes including Ryr3, Ip3r, Psen1, Serca1,
Perk, Ire1a, Atf6, Gq, and Plcb1 was analyzed (Figure 3). Expression analysis showed that Ryr3, Ip3R,
Ire1a, and Plcb1 were overexpressed in vivo in AD mice compared to the control group. By contrast,
the expression levels Sci.Psen1,
Int. J. Mol.of Serca1,
2018, 19, x FOR Atf6, and Gq were significantly lower in the disease
PEER REVIEW 5 of 16 group.
Figure 3. Expression analysis of genes involved in endoplasmic reticulum stress. (a) Histograms
Figure 3. Expression analysis of genes involved in endoplasmic reticulum stress. (a) Histograms
representing relative mRNA
representing expression
relative of Ryr3,
mRNA expression of Ryr3,ire1a, Ip3r,
ire1a, Ip3r, atf1,atf1,
Psen1,Psen1, Gq,
Gq, Serca1, Serca1,
Plcb1, Plcb1, and Perk.
and Perk.
Represented values are the mean and SD obtained from three individual experiments performed for
Represented values are the mean and SD obtained from three individual experiments performed for
each sample. The line on the x-axis at 1.0 represents the gene expression of control samples. (b) Bar
each sample. Theplots linerepresenting
on the x-axis at 1.0values
fold-change represents thein gene
represented the log2 expression
scale showingof control
gene samples.
expression in the (b) Bar plots
representing fold-change values represented in the log2 scale showing gene expression
brain of six-, nine-, and 12-month-old samples. Baseline shows expression in control samples. (c) in the brain of
Scattered-dot plot showing expression of genes involved in endoplasmic reticulum stress. *
six-, nine-, and 12-month-old samples. Baseline shows expression in control samples. (c) Scattered-dot
Expression is significantly different from WT (p ≤ 0.05). n.s., Nonsignificant.
plot showing expression of genes involved in endoplasmic reticulum stress. * Expression is significantly
2.4. Calcium Signaling Disruption
different from WT (p ≤ 0.05). n.s., Nonsignificant.
Disruption of calcium signaling, induced by amyloid beta, is associated with memory
dysfunction because a persistent increase in calcium level enhances long-term potentiation (LTP) and
synaptic transmission [16]. The disruption of calcium signaling is considered a major aspect of disease
pathology; thus, genes involved in calcium signaling were assessed in the present study. Genes
controlling calcium signaling, including Nmdar, Vdcc, Ryr3, Ip3r, Calm1, Erk/Mapk2, and Bad, were
analyzed (Figure 4a). The results of the expression analysis showed that the Nmdar, Ryr3, Ip3r, and
Mapk2 genes were overexpressed in AD groups, while the Calm1 gene showed significant decrease
in expression, and Vdcc and Bad showed no significant difference in expression in diseased brain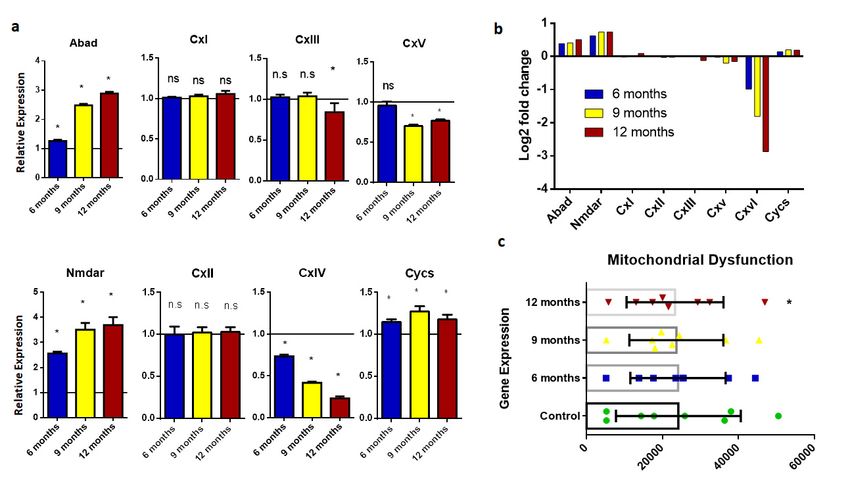
Int. J. Mol. Sci. 2019, 20, 1219                                                                                    5 of 14

2.4. Calcium Signaling Disruption
        Disruption of calcium signaling, induced by amyloid beta, is associated with memory dysfunction
because a persistent increase in calcium level enhances long-term potentiation (LTP) and synaptic
transmission [16]. The disruption of calcium signaling is considered a major aspect of disease pathology;
thus, genes involved in calcium signaling were assessed in the present study. Genes controlling calcium
signaling, including Nmdar, Vdcc, Ryr3, Ip3r, Calm1, Erk/Mapk2, and Bad, were analyzed (Figure 4a).
The results of the expression analysis showed that the Nmdar, Ryr3, Ip3r, and Mapk2 genes were
overexpressed in AD groups, while the Calm1 gene showed significant decrease in expression, and Vdcc
and Bad showed no significant difference in expression in diseased brain samples compared to the
  Int. J. Mol. Sci. 2018, 19, x FOR PEER REVIEW                                                      6 of 16
wild type (Figure 4b).

     Figure 4. Expression analysis of genes involved in calcium signaling. (a) Histograms representing
     relative mRNA expression of Snca, Ip3r, Nmdar, calm1, Vdcc, Erk, Ryr3, and Bad. Represented values are
       Figure 4. Expression analysis of genes involved in calcium signaling. (a) Histograms representing
     the mean and SD obtained from three individual experiments performed for each sample. The line on
       relative mRNA expression of Snca, Ip3r, Nmdar, calm1, Vdcc, Erk, Ryr3, and Bad. Represented values
     the x-axis at 1.0 represents the gene expression of control samples. (b) Bar plots representing fold-change
       are the mean and SD obtained from three individual experiments performed for each sample. The
     values represented in the log2 scale showing comparative gene expression in the brain of six-, nine-,
       line on the x-axis at 1.0 represents the gene expression of control samples. (b) Bar plots representing
     and 12-month-old samples. Baseline shows expression in the control sample. (c) Scattered-dot plot
       fold-change values represented in the log2 scale showing comparative gene expression in the brain of
     showing expression of genes involved in calcium signaling. * Expression is significantly different from
       six-, nine-, and 12-month-old samples. Baseline shows expression in the control sample. (c) Scattered-
     WT (p ≤ 0.05). n.s., Nonsignificant.
       dot plot showing expression of genes involved in calcium signaling. * Expression is significantly
2.5. Mitochondrial
       different from Dysfunction
                        WT (p ≤ 0.05). n.s., Nonsignificant.

      Mitochondria are the most important organelle in eukaryotic cells, and are also known as the
  2.5. Mitochondrial Dysfunction
powerhouse of a cell because of their role in energy metabolism. In the brains of AD patients,
       Mitochondria
mitochondrial     functionareisthe  most important
                                disrupted   because oforganelle
                                                          cytosolicin Aβeukaryotic    cells,Mitochondrial
                                                                          accumulation.      and are also known      as the
                                                                                                             dysfunction
  powerhouse      of   a cell  because   of  their   role  in  energy   metabolism.     In  the brains
is related to the association of Aβ with the Abad protein in mitochondria. Mitochondrial dysfunction     of  AD    patients,
  mitochondrial
leads                 functionspecies
       to reactive oxygen          is disrupted
                                         (ROS) andbecause         of cytosolic
                                                        inflammation,              Aβ accumulation.
                                                                          which cause     neurodegenerationMitochondrial
                                                                                                                  and cell
  dysfunction    is related   to the association    of  Aβ  with  the Abad    protein  in mitochondria.
death. Genes that are involved in mitochondrial function, such as Abad, Nmdar, Cx i–v, and Cycs,           Mitochondrial
  dysfunction
were   monitoredleadsin thistostudy.
                                   reactive    oxygenshowed
                                        The results         speciesthat(ROS)
                                                                        Abad and and Nmdar
                                                                                        inflammation,       which cause
                                                                                               were overexpressed       in
  neurodegeneration
diseased   samples (Figureand cell   death.Cx
                                 5), while    Genes
                                                iv and that
                                                         Cx are  involved
                                                             v showed       in mitochondrial
                                                                         significantly           function, such
                                                                                         lower expression          as Abad,
                                                                                                             in diseased
  Nmdar,
brain      Cx i–v,compared
       samples       and Cycs, to were   monitored
                                     wild-type          in this Cx
                                                  samples.      study.
                                                                    i andThe
                                                                           Cxresults   showed
                                                                                ii showed        that Abad and
                                                                                             no significant         Nmdar
                                                                                                               change   in
  were overexpressed
expression     in all age in   diseased
                            groups    withsamples
                                             AD as(Figure
                                                       compared5), while  Cx iv and
                                                                    to normal         Cx vsamples
                                                                                  control   showed of significantly
                                                                                                         respective lower
                                                                                                                      age.
  expression
While           in diseased
        Cx iii showed           brain samples
                         no significant   changecompared
                                                    in the six- to
                                                                 andwild-type
                                                                      nine-month  samples.   Cx i and
                                                                                     age groups,   thereCx
                                                                                                         wasii significant
                                                                                                               showed no
  significant   change   in expression     in all age   groups    with  AD   as compared
downregulation in the 12-month age group. (Figure 5). Detailed expression analysis showed    to normal   control   samples
                                                                                                                      that
  of respective age. While Cx iii showed no significant change in the six- and nine-month age groups,
  there was significant downregulation in the 12-month age group. (Figure 5). Detailed expression
  analysis showed that mitochondrial dysfunction worsens with aging. AD-affected mice suffered from
  energy deficits, and were thus faced with a decline in memory and cognitive abilities.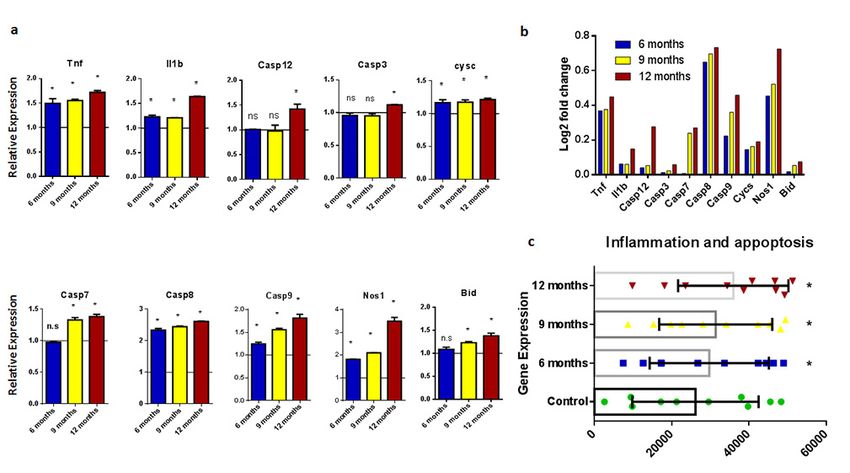
Int. J. Mol. Sci. 2019, 20, 1219                                                                            6 of 14

mitochondrial        dysfunction
 Int. J. Mol. Sci. 2018,             worsens
                         19, x FOR PEER REVIEWwith aging. AD-affected mice suffered from energy deficits,
                                                                                                    7 of 16
and were thus faced with a decline in memory and cognitive abilities.

      Figure 5. Expression analysis of genes involved in mitochondrial disruption. (a) Histograms
      representing relative m RNA expression of Abad, Nmdar, Cx i–v, and Cycs. Represented values are
        Figure 5. Expression analysis of genes involved in mitochondrial disruption. (a) Histograms
      the mean and SD obtained from three individual experiments performed for each sample. The line
        representing relative m RNA expression of Abad, Nmdar, Cx i–v, and Cycs . Represented values are the
      on the x-axis at 1.0 represents the gene expression of control samples. (b) Bar plots representing
        mean and SD obtained from three individual experiments performed for each sample. The line on the
      fold-change values represented in the log2 scale showing comparative gene expression in the brain of
        x-axis at 1.0 represents the gene expression of control samples. (b) Bar plots representing fold-change
      six-, nine-, and 12-month-old samples. Baseline shows expression in control samples. (c) Scattered-dot
        values represented in the log2 scale showing comparative gene expression in the brain of six-, nine-,
      plot showing expression of genes involved in mitochondrial dysfunction. * Expression is significantly
        and 12-month-old samples. Baseline shows expression in control samples. (c) Scattered-dot plot
      different to WT (p ≤ 0.05). n.s., Nonsignificant.
        showing expression of genes involved in mitochondrial dysfunction. * Expression is significantly
        different to WT
2.6. Inflammation     and (p ≤ 0.05). n.s., Nonsignificant.
                           Apoptosis

  2.6.Pathological
      Inflammationprocesses      linked to AD, such as Aβ plaques, tau pathology, endoplasmic reticulum
                      and Apoptosis
stress, disruption in calcium signaling, and mitochondrial dysfunction, lead to the accumulation of
       Pathological
reactive               processes
          oxygen species           linked to AD, suchwhich
                            and neuroinflammation,     as Aβ leads
                                                              plaques,  tau pathology,
                                                                    to neuronal          endoplasmic
                                                                                 cell death.            reticulum
                                                                                              Inflammation   and
apoptosis are the final pathological events in the onset of AD and other neurodegenerative diseases.of
  stress, disruption   in  calcium   signaling, and mitochondrial    dysfunction,  lead  to the  accumulation
  reactive oxygen
Neuronal             species
            cell death    leadsand
                                 to neuroinflammation,
                                      memory impairment    which
                                                             and leads   to neuronal
                                                                  cognitive   decline.cell
                                                                                         In death.  Inflammation
                                                                                             the present   study,
  and  apoptosis    are the   final  pathological events  in the onset   of AD   and   other
we focused on inflammatory markers and genes responsible for neuroinflammation and cell death,neurodegenerative
  diseases.
such  as Tnf,Neuronal     cellCasp3,
              Il1b, Casp12,    death Casp7,
                                       leads Casp9,
                                             to memory    impairment
                                                    Cycs, Nos1, and Bid,and  cognitive
                                                                          as shown       decline.
                                                                                     in Figure  6. In the present
  study,  we  focused   on  inflammatory     markers  and  genes responsible   for neuroinflammation
      Expression of genes related to neuroinflammation and apoptosis showed that amyloid-associated       and cell
  death,  such  as Tnf, Il1b, Casp12,   Casp3, Casp7, Casp9, Cycs, Nos1,  and Bid, as shown    in Figure
pathology leads to increased inflammation and cell death in transgenic mice, thereby leading to the       6.
onset of AD. Expression levels of all the genes included in this study are depicted collectively in the
form of a heat map, as shown in Figure 7. Changes in expression patterns can be visualized in different
age groups. Tnf, Il1b, and Nos1, which are markers of inflammation, showed significant overexpression.
Similarly, Casp 8 and Casp 9 showed significant upregulation in all age groups. However, Casp 3 and
Casp 7 only showed detectable upregulation in 12-month-old mice.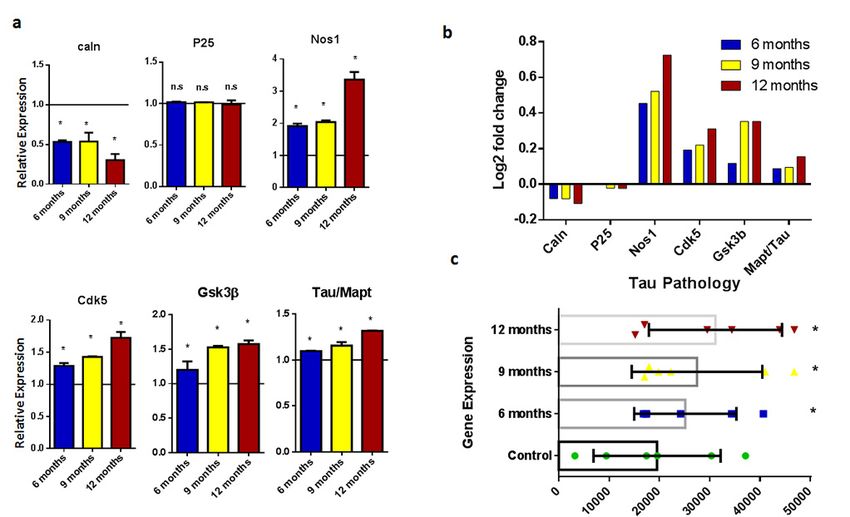
Int.J.J.Mol.
Int. Mol.Sci.
Sci.2019,
2018,20,
19,1219
x FOR PEER REVIEW 78ofof14
16
Figure 6. Expression analysis of genes involved in neuroinflammation and apoptosis. (a) Histograms
Figure 6. Expression
representing relative analysis of genes involved
mRNA expression of Tnf, in neuroinflammation
Il1b, Casp 3, Casp 7, Caspand 8,
apoptosis. (a) Histograms
Casp 9, Casp 12, Nos1,
Cysc, and Bid. Represented values are the mean and SD obtained from three individual12,
representing relative mRNA expression of Tnf, Il1b, Casp 3, Casp 7, Casp 8, Casp 9, Casp Nos1, Cysc,
experiments
and Bid. Represented
performed values
for each sample. Theareline
theonmean and SD
the x-axis obtained
at 1.0 fromthe
represents three
geneindividual
expressionexperiments
of control
samples. (b) Bar plots representing fold-change values represented in the log2 scale of
performed for each sample. The line on the x-axis at 1.0 represents the gene expression control
showing
samples. (b) Bar plots representing fold-change values represented in the
comparative gene expression in the brain of six-, nine-, and 12-month-old samples. Baseline shows log2 scale showing
comparative
expression gene expression
in control in Scattered-dot
samples. (c) the brain of six-,
plotnine-,
showingandexpression
12-month-old samples.
of genes Baseline
involved shows
in calcium
expression
Int. J.signaling.
Mol. Sci. 2018,in19,
control
x FORsamples.
* Expression PEER (c) Scattered-dot
REVIEW
is significantly plot
different to WTshowing expression
(p ≤ 0.05). of genes involved in calcium9 of 16
n.s., Nonsignificant.
signaling. * Expression is significantly different to WT (p ≤ 0.05). n.s., Nonsignificant.
Expression of genes related to neuroinflammation and apoptosis showed that amyloid-
associated pathology leads to increased inflammation and cell death in transgenic mice, thereby
leading to the onset of AD. Expression levels of all the genes included in this study are depicted
collectively in the form of a heat map, as shown in Figure 7. Changes in expression patterns can be
visualized in different age groups. Tnf, Il1b, and Nos1, which are markers of inflammation, showed
significant overexpression. Similarly, Casp 8 and Casp 9 showed significant upregulation in all age
groups. However, Casp 3 and Casp 7 only showed detectable upregulation in 12-month-old mice.
2.7. AD Onset with Age Progression
After the analysis of major molecular events involved in the onset of AD, overall analysis of the
whole set of genes and their expression in three age groups showed that gene expression toward
disease onset intensified with the increase of age. The gene heat map showed that most of the genes
showed significant difference in expression at the nine-month age group, which was further
aggravated as age progressed more (Figure 7a). The mean of gene expression in the three age groups
showed that genes expression in the 12-month age group showed significant difference when
compared to the mean of the six- and nine-month age groups (Figure 7b). Discrepancies in the normal
function of biological processes occur whenever genes are either overexpressed or underexpressed
as compared to normal conditions. The Venn diagram in Figure 7c shows that the six-month age
group showed 21 overexpressed genes as compared to its control age group. Likewise, 28 and 29
genes were overexpressed in the nine- and 12-month age groups, respectively, as compared to their
control counterparts,
Figure 7. (a) Heat mapwhile 15 genes
showing overlapped
comparison of all in all in
genes three
this age
studygroups. Figure
expressed 7d shows
in diseased the genes
samples,
Figure
that divided 7. (a) Heat
were underexpressed map showing
as comparison
compared to of all
control genes in
samples.this study
The expressed
six-month in diseased
age
into control, six-, nine-, and 12-month-old APP/PS1 transgenic mice. (b) Box plot showinggroup samples,
showed 14
genes divided into
expressed control,
at a six-,
lower nine-,
level than and 12-month-old
the group APP/PS1
samples, whiletransgenic
17 and mice.
18 (b)
genes Box
were
comparison mean with SD of all genes involved in the onset of Alzheimer’s disease analyzed in threeplot showing
underexpressed
in thecomparison
agenine-
groups.and mean
(c,d) withdiagram
12-month
Venn SDage
of allrepresenting
genes involved
group, in the onset
respectively.
the number Among of Alzheimer’s
of over- these disease
genes, about
and underexpressed analyzed
eight in
genes. threewere
genes
age groups. (c,d) Venn diagram
common in all age groups (Table S1). representing the number of over- and underexpressed genes.
3. Discussion
In this study, we performed gene-expression profiling of genes covering all major molecular
events involved in the onset of AD. APP processing is one of the major molecular events and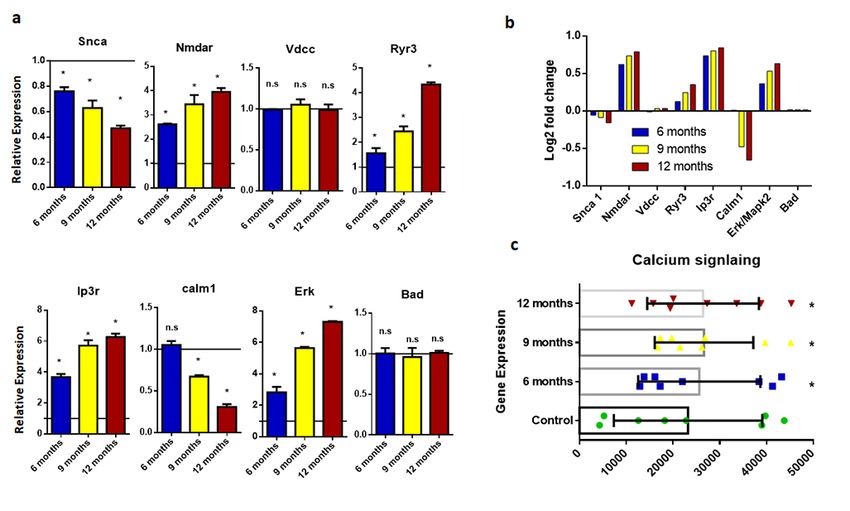
Int. J. Mol. Sci. 2019, 20, 1219                                                                  8 of 14

2.7. AD Onset with Age Progression
      After the analysis of major molecular events involved in the onset of AD, overall analysis of
the whole set of genes and their expression in three age groups showed that gene expression toward
disease onset intensified with the increase of age. The gene heat map showed that most of the genes
showed significant difference in expression at the nine-month age group, which was further aggravated
as age progressed more (Figure 7a). The mean of gene expression in the three age groups showed
that genes expression in the 12-month age group showed significant difference when compared to
the mean of the six- and nine-month age groups (Figure 7b). Discrepancies in the normal function of
biological processes occur whenever genes are either overexpressed or underexpressed as compared
to normal conditions. The Venn diagram in Figure 7c shows that the six-month age group showed
21 overexpressed genes as compared to its control age group. Likewise, 28 and 29 genes were
overexpressed in the nine- and 12-month age groups, respectively, as compared to their control
counterparts, while 15 genes overlapped in all three age groups. Figure 7d shows the genes that were
underexpressed as compared to control samples. The six-month age group showed 14 genes expressed
at a lower level than the group samples, while 17 and 18 genes were underexpressed in the nine- and
12-month age group, respectively. Among these genes, about eight genes were common in all age
groups (Table S1).

3. Discussion
      In this study, we performed gene-expression profiling of genes covering all major molecular events
involved in the onset of AD. APP processing is one of the major molecular events and hallmarks of AD
(Figure 8). This event involves several genes including Adam10, App, Lpl, Apo-E, Appbp1, Snca, Casp8,
Psen1, Pen-2, Ide, Nep/Mme, Bace1, Ncstn, and Aph1B. Amyloid precursor protein, a transmembrane
protein, is the precursor of amyloid beta. These transgenic mice with mutant APP genes showed APP
overexpression. Our results showed significant difference in gene expression when compared with
control mice. APP overexpression is the primary event in amyloid-beta-induced neurotoxicity and
neurodegeneration. Adam10 is a member of the A Disintegrin and Metalloproteinase (ADAM) family
that is involved in cleavage and plays a critical role in reducing the generation of Aβ peptides [17].
Reducing the expression of Adam10 produced improper APP cleavage and enhanced amyloid beta
production. A significant decline in Adam10 expression is evident in the AD disease groups, and this
expression further declines with aging. Presenilin protein (PSEN 1) is involved in APP cleavage and
the production of amyloid beta fragments. Transgenic mice with mutant PS1 genes show abnormal
expression compared to normal mice. This change in expression pattern causes the overproduction
of amyloid beta, which leads to senile plaques. Further, among several risk factors for AD, the most
impactful is the varepsilon4 isoform of apolipoprotein E (ApoE). A recent study highlights the role of
isoform-dependent transcriptional regulation of APP by ApoE, explaining how ApoE enhances AD
risk [18]. Decreases in the expression of Bace1, Pen2, and Nep are mostly related to APP cleavage and
amyloid beta degradation, and they are responsible for amyloid-beta-related neurotoxicity (Andreoli
et al., 2011) [19]. Overexpression of Appbp1 in primary neurons causes apoptosis, which leads to AD
onset [20].
Int. J. Mol. Sci. 2019, 20, 1219 9 of 14
Int. J. Mol. Sci. 2018, 19, x FOR PEER REVIEW 10 of 16
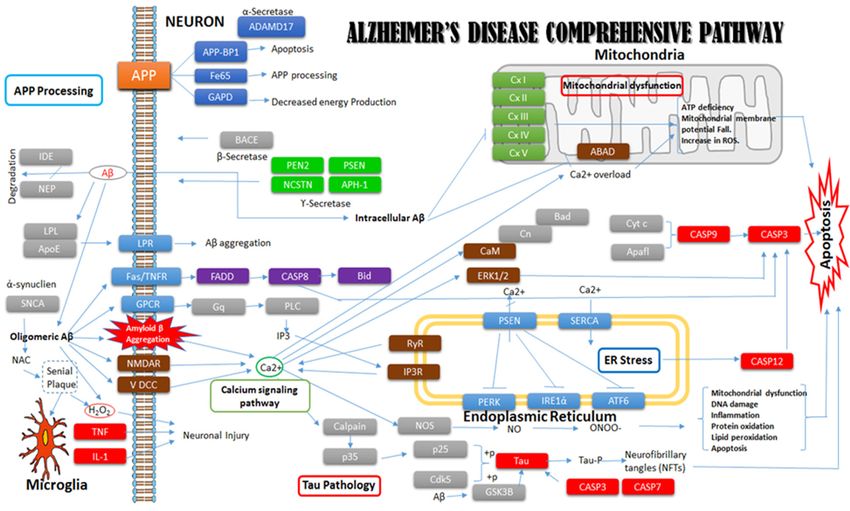
Figure 8.
Figure Comprehensive pathway
8. Comprehensive pathway ofof Alzheimer’s
Alzheimer’s disease
disease derived
derived from
from the
the Kyoto
Kyoto Encyclopedia
Encyclopedia ofof
Genes and
Genes and Genomes
Genomes (KEGG).
(KEGG). This
This pathway
pathway shows
shows aa detailed
detailed summary
summary of of all
all the
the important genes
important genes
involved in the molecular mechanisms in disease onset. Solid square boxes of different
involved in the molecular mechanisms in disease onset. Solid square boxes of different colorscolors represent
proteins while
represent Colored
proteins squares
while without
Colored fill represents
squares molecular
without fill events
represents of the disease
molecular events respectively.
of the disease
respectively.
Tau pathology is among the major hallmarks of AD and dementia and, in this study, we evaluated
genes involved in tau protein regulation and metabolism. Genes such as Mapk/tau, Caln, P25, Nos1, Cdk5,
Tau pathology is among the major hallmarks of AD and dementia and, in this study, we
and Gsk3β were included in this study for expression analysis. Calcineurin is a calcium-dependent
evaluated genes involved in tau protein regulation and metabolism. Genes such as Mapk/tau, Caln,
protein involved in the phosphorylation and regulation of the tau protein [21]. Overexpression
P25, Nos1, Cdk5, and Gsk3β were included in this study for expression analysis. Calcineurin is a
of amyloid beta disrupts calcium signaling, as shown in our results based on the significant
calcium-dependent protein involved in the phosphorylation and regulation of the tau protein [21].
overexpression of Caln in AD mouse samples compared to control brain samples. The P25 protein
Overexpression of amyloid beta disrupts calcium signaling, as shown in our results based on the
is involved in the cleavage and accumulation of Cdk5, and P25 accumulation was observed and
significant overexpression of Caln in AD mouse samples compared to control brain samples. The P25
reported in AD patients [22,23]. The present study showed that there is no significant difference
protein is involved in the cleavage and accumulation of Cdk5, and P25 accumulation was observed
in the expression between AD and control mice at six months. This showed that overexpression of
and reported in AD patients [22,23]. The present study showed that there is no significant difference
P25/Cdk5 was related to Aβ accumulation with increasing age. Nitric oxide synthase1 (Nos1) is
in the expression between AD and control mice at six months. This showed that overexpression of
responsible for generating nitric oxide, which leads to the nitrosylation of several proteins that are,
P25/Cdk5 was related to Aβ accumulation with increasing age. Nitric oxide synthase1 (Nos1) is
in turn, associated with tau hyperphosphorylation [24,25]. Our results showed significantly increased
responsible for generating nitric oxide, which leads to the nitrosylation of several proteins that are,
expression of Nos1 in diseased samples. Glycogen synthase kinase 3 (Gsk3) is a serine/threonine
in turn, associated with tau hyperphosphorylation [24,25]. Our results showed significantly increased
kinase responsible for AD pathogenesis [26,27]. Gsk3 hyperphosphorylates tau protein at serine and
expression of Nos1 in diseased samples. Glycogen synthase kinase 3 (Gsk3) is a serine/threonine
threonine residues, leading to neuronal cell death.
kinase responsible for AD pathogenesis [26,27]. Gsk3 hyperphosphorylates tau protein at serine and
Calcium signaling is an important homeostatic process in the brain. Dysregulation of calcium
threonine residues, leading to neuronal cell death.
disrupts homeostasis and leads to neurodegeneration. In this study, we focused on several
Calcium signaling is an important homeostatic process in the brain. Dysregulation of calcium
important calcium-signaling genes, Nmdar, Vdcc, Ryr3, Ip3r, Calm1, Snca, Erk/Mapk2, and Bad.
disrupts homeostasis and leads to neurodegeneration. In this study, we focused on several important
The N-methyl-D-aspartate receptor (Nmdar) is a glutamate receptor and ion channel protein found
calcium-signaling genes, Nmdar, Vdcc, Ryr3, Ip3r, Calm1, Snca, Erk/Mapk2, and Bad. The N-methyl-D-
in neurons, and, when activated by glutamate, it allows positively charged ions to flow through
aspartate receptor (Nmdar) is a glutamate receptor and ion channel protein found in neurons, and,
the cell membrane [28]. The NMDA receptor is very important for controlling synaptic plasticity
when activated by glutamate, it allows positively charged ions to flow through the cell membrane
and memory function [29]. Overexpression of NMDA receptors, as shown in this study, is evident
[28]. The NMDA receptor is very important for controlling synaptic plasticity and memory function
in dementia and AD [30]. Along with NMDA receptors, voltage-dependent calcium channels are
[29]. Overexpression of NMDA receptors, as shown in this study, is evident in dementia and AD [30].
major regulators of calcium in neurons. Calcium (Ca2+ ) disruption, accompanied by long-term
Along with NMDA receptors, voltage-dependent calcium channels are major regulators of calcium
inflammation, leads to neurodegeneration in age-associated diseases [31,32]. Our data demonstrated
in neurons. Calcium (Ca2+) disruption, accompanied by long-term inflammation, leads to
that diseased samples showed no significant change in Vdcc expression in brain samples from six-,
neurodegeneration in age-associated diseases [31,32]. Our data demonstrated that diseased samples
showed no significant change in Vdcc expression in brain samples from six-, nine-, and 12-month-
old transgenic mice. By contrast, overexpression of Inositol 3 phosphate receptor (Ip3r), a calciumInt. J. Mol. Sci. 2019, 20, 1219 10 of 14
nine-, and 12-month-old transgenic mice. By contrast, overexpression of Inositol 3 phosphate receptor
(Ip3r), a calcium regulator for the endoplasmic reticulum, was reported in diseased samples [33].
Calmodulin 1 (a calcium-modulated protein) acts as a regulator of calcium signaling and is involved in
the activation of several kinases and phosphatases. Recent studies showed that binding Aβ oligomers
to Calm1 is responsible for calcium dysregulation and the activation of mitogen-activated protein
kinase (MAPK), which is responsible for synaptic dysfunction and memory impairment [34,35].
Endoplasmic reticulum stress is evident in Alzheimer’s disease. The ER plays an important role
in protein transport, calcium signaling, and homeostasis [36]. To study ER stress, we analyzed the
expression of important ER-related genes like Ryr3, IP3r, Psen1, Serca1, Perk, Ire1a, Atf6, Gq, and Plcn1.
Our analysis showed that ryanodine receptor 3 and inositol 3 phosphate receptor, which are calcium
regulatory receptors, are upregulated in AD brain samples. By contrast, sarcoplasmic/endoplasmic
reticulum ATPase was reported to be downregulated in age-matched AD samples, a phenomenon that
was reported to decrease with aging [37,38]. Moreover, the present study demonstrated that an AD
model showed the downregulation of protein kinase RNA-like endoplasmic reticulum kinase (PERK),
activating transcription factor-6 and Gq, which are modulators of endoplasmic stress and unfolded
protein response [39,40].
Mitochondrial dysregulation is a major contributor to the onset of neurodegenerative disease.
Amyloid beta-binding alcohol dehydrogenase (ABAD) expression is upregulated in disease-associated
samples [41]. Overexpression of the N-methyl-D-aspartate (NMDA) receptor enhances calcium influx
into mitochondria and causes metabolic disruption in neurons. Expression analysis of samples from
the AD model demonstrated that mitochondrial Complexes I and II showed no significant changes
compared to the wild type, while Complex III only showed downregulation in the 12-month brain
sample. By contrast, significant downregulation of Complexes IV and V was reported in samples from
an aged AD brain that showed disruption in mitochondrial activity [42].
4. Materials and Methods
The experimental procedures were approved by the Research Ethics Committee of the Department
of Applied Life Sciences at Gyeongsang National University, Republic of Korea. (Approval number#
GNU-170117-M0002, January 17, 2017). All experiments were performed in accordance with guidelines
and regulations of the aforementioned research ethics committee.
4.1. Animals
Congenic double-transgenic B6.Cg-Tg (APPswe, PSENdE9)85Dbo/Mmjax AD model mice were
purchased from The Jackson Laboratory (Bar Harbor, ME, USA). These mice express a chimeric
mouse–human amyloid precursor protein bearing the Swedish mutation (Mo/HuAPP695swe),
and a mutant human Presenilin 1 protein (PS1-dE9) in neurons of the central nervous system. C57BL/6J
(wild-type) mice were purchased from Samtako Bio (Osan, Korea). Mice were housed under a 12 h
light/12 h dark cycle at 25 ◦ C with ad libitum access to food and water. Mice were euthanized, and the
hippocampus region of the brain was dissected out for RNA extraction.
4.2. RNA Isolation and cDNA Synthesis
The brain samples of transgenic (n = 3 per group) and wild-type mice (n = 3 per group) from
3 different age groups, 6, 9, and 12 months of age, were incubated at 65 ◦ C for 10 min and cooled on
ice. Subsequently, 4 µL 5× first-strand reaction buffer (375 mM KCl and 15 mM MgCl2 in 250 mM
Tris-HCl), pH 8.3 (Invitrogen, Carlsbad, CA, USA), and 2 µL 100 mM DTT (Invitrogen) were added to
the vials and, after incubation for 2 min at room temperature, 1 µL 200 U per µL SuperScriptTM III
Reverse Transcriptase (Invitrogen) was added. After mixing contents by gentle agitation, vials were
placed in a Gene Amp® PCR system (Applied Biosystems, Foster City, CA, USA).Int. J. Mol. Sci. 2019, 20, 1219 11 of 14
4.3. Gene-Expression Analysis
The expression of different genes involved in AD pathology was determined in the brain using
end point RT-PCR on 6-, 9-, and 12-month-old transgenic and control mice of respective age groups 6, 9,
and 12 months by using primers (Table 1). GAPDH was used as a reference gene. End-point RT-PCRs
were completed using Amplitaq Gold 360 Master Mix (Thermo Fisher Scientific, Waltham, MA, USA)
in a total reaction volume of 25 µL containing 5 µL cDNA and 0.1 µM primers against specific gene
transcripts. All PCRs were performed in a linear amplification range over 25 amplification cycles
comprising an initial denaturation step of 94 ◦ C for 5 min, a core cycle comprising 94 ◦ C for 45 s, 55 ◦ C
for 30 s, 72 ◦ C for 45 s, followed by a final extension of 72 ◦ C for 7 min. PCR products were separated
by TAE gel electrophoresis, visualized by ethidium bromide staining and quantified by densitometry
using a Gel Doc XR+ Molecular Imager System (Bio-Rad, Hercules, CA, USA).
Table 1. Primer sequence of genes used for expression analysis.
Gene Name Reverse Primer Sequence 50 to 30 Forward Primer Sequence 50 to 30
Adam10 atcgaatcctgccatttcac agccagagttgtgcgttttt
Abad gacttccagcgggttatcaa cagtgtcatgcccactatgc
Aph1B gctgttcaggctcgcatatt aatcaccatgaatgcccact
Apo-E gtgctgttggtcacattgct cagtgccgtcagttcttgtg
App ggccctcgagaattacatca gttcatgcgctcgtagatca
Atf6 ggccagactgttttgctctc cccatacttctggtggcact
Serca1 tggccgatgataacttctcc gagcccatcagtcaccaagt
Bace1 tttgtggagatggtggacaa tacacaccctttcggaggtc
Bad gggatggaggaggagcttag cccaccaggactggataatg
Bid tcacagacctgctggtgttc gtctggcaatgttgtggatg
Vdcc cgttctcatcctgctcaaca tatgctcccaatgacgatga
Calm1 actgggtcagaacccaacag gttctgccgcactgatgtaa
Caln cagagggtgcttcgattctc aaggcccacaaatacagcac
Casp12 ttcccaggaacagctgagtt tcacgtggacaaagcttcag
Casp3 tgtcatctcgctctggtacg tcccataaatgaccccttca
Casp7 tttgcttactccacggttcc cacgggatctgcttcttctc
Casp8 ggcctccatctatgacctga gcagaaagtctgcctcatcc
Casp9 aagaccatggctttgaggtg aagtccctttcgcagaaaca
Cdk5 gtccatcgacatgtggtcag acgacgttcaccaaggatgt
P25 cgtccactagtgagctgctg cccacctcagaggagatgac
Cxi ctctccccagtaccctcgac gggagtgggcctgaaattag
Cxii cctttgggaaccacagctaa tcaaagttcccaggaagcag
Cxiii gttcgcagtcatagccacag tagggccgcgataataaatg
Cxiv gtgtccccactgatgaggag cagccaaaaccagatgacag
Cxv gaaactggaccaggtggaga gataccctgggtgttgccta
Cycs gggaggcaagcataagactg tctgccctttctcccttctt
Perk tggtgactgctatggaccaa gttccatctgggtgctgaat
Fadd acaatgtggggagagactgg aggtcagccaccagattcag
Fas ttgcaagacatgtcggaaag cctgcatggcagttacacac
Appbp1 gcagccagggaagatactca tcttctccgctgaccagatt
Gapdh aagggctcatgaccacagtc acacattgggggtaggaaca
Gq cacgctcaagatcccataca ggctacacggtccaagtcat
Nmdar cagcaggactggtcacagaa tttgttccccaagagtttgc
Gsk3b gaggagagcccaatgtttca aatttgctcccttgttggtg
Ide gaggcgttccaaaaacacat gacagccaacatttcctggt
Il1b gaccttccaggatgaggaca tccattgaggtggagagctt
Ip3r gaatttccttcgttgccaaa cgatgcagttctggttctca
Ire1a cccaaatgtgatccgctact agaatgttgtggggcttcag
Lpl ttttctgggactgaggatgg gtcaggccagctgaagtagg
Lrp1 gacagcaaacgaggcctaag acaggggttggtcacttcag
Erk tccttttgagcaccagacct agcagatgtggtcattgctg
Mapt gtggccaggtggaagtaaaa gtggagatgtgtccccagac
Ncstn ctgaccactctggctccttc gctgctgaagttggttcctc
Nep aggcggacaacctctactca cgaggctggtcaaaatgaat
Nos1 agcacctaccagctcaagga atagtgatggccgacctgag
Plcb1 catccaggaggtggttcagt ccctttcatggcttcctgta
Psen1 cctcatggccctggtattta tcagccatattcaccaacca
Pen-2 cgggtatccaatgaggagaa gcgagaatgatcacccagaa
Ryr3 gtgcagcctctactcccttg atgtcctccaccttgtctgg
Snca ggagtgacaacagtggctga caggcatgtcttccaggatt
Tnf cgtcagccgatttgctatct cggactccgcaaagtctaagInt. J. Mol. Sci. 2019, 20, 1219 12 of 14
4.4. Statistics and Analysis
Gene amplification was analyzed by using Quantity One software (Bio-Rad). PCR data were
investigated by one-way ANOVA coupled with Dunnett’s test using Graph Pad Prism 6 software.
Heat-map analysis was done by using the Orange Data Mining Toolbox in Python.
5. Conclusions
The present study provided an overview of this multifactorial disease but also dissected details of
pathological events at the molecular level. This study may help in designing diagnostic assays that
can be used to analyze the cerebrospinal fluid of AD patients. In recent years, several natural proteins
have been used as therapeutic agents for treating AD. Osmotin is an emerging and promising plant
protein that has shown neuroprotective effects and reduced amyloid beta toxicity in a transgenic mouse
model and neuronal cells [43,44]. Osmotin has also been reported to attenuate neuroinflammation [45],
as well as provide protection against ethanol-induced apoptotic neurodegeneration [46]. To explore the
molecular mechanism of this kind of therapeutic agent, more-detailed assays are required. The present
study provides a preliminary background to design a valid and effective diagnostic tool. Our future
plans include a detailed study including data from human brains with Alzheimer’s disease, and the
use of next-generation sequencing and microarrays to cover a broader gene spectrum. Once a whole
set of genes is compiled, we aim to device an economical, effective, accurate, and reproducible analysis
tool. Assays based on such analysis would provide an excellent opportunity for the diagnosis of
challenging diseases like Alzheimer’s and Parkinson’s.
Supplementary Materials: Supplementary materials can be found at http://www.mdpi.com/1422-0067/20/5/1219/
s1.
Author Contributions: N.B.A. performed the experiments. M.I.N. analyzed the data. N.B.A. wrote the manuscript.
M.I.N. and M.O.K. read and approved the manuscript. M.O.K. is the corresponding author and holds all of the
responsibilities related to this manuscript. All authors reviewed the manuscript.
Funding: This research received no external funding.
Conflicts of Interest: The authors declare no conflict of interest.
References
1. Masters, C.L.; Bateman, R.; Blennow, K.; Rowe, C.C.; Sperling, R.A.; Cummings, J.L. Alzheimer’s disease.
Nat. Rev. Dis. Primers 2015, 1, 15056. [CrossRef] [PubMed]
2. Yan, S.D.; Schmidt, A.M.; Stern, D. Alzheimer’s disease: Inside, outside, upside down. Biochem. Soc. Symp.
2001, 67, 15–22. [CrossRef]
3. Lloret, A.; Fuchsberger, T.; Giraldo, E.; Vina, J. Molecular mechanisms linking amyloid beta toxicity and Tau
hyperphosphorylation in Alzheimers disease. Free Radic. Biol. Med. 2015, 83, 186–191. [CrossRef] [PubMed]
4. Cummings, J. Lessons Learned from Alzheimer Disease: Clinical Trials with Negative Outcomes.
Clin. Transl. Sci. 2017. [CrossRef] [PubMed]
5. Patel, M. Alzheimer disease: Revising the risk of Alzheimer disease in women. Nat. Rev. Neurol. 2017.
[CrossRef] [PubMed]
6. Australian Bureau of Statistics. Causes of Death. Available online: http://www.abs.gov.au/ausstats/
abs@.nsf/Lookup/by%20Subject/3303.0~{}2014~{}Main%20Features~{}Dementia,%20including%
20Alzheimer%20disease%20(F01,%20F03,%20G30)~{}10040 (accessed on 12 June 2018).
7. Wang, J.; Gu, B.J.; Masters, C.L.; Wang, Y.J. A systemic view of Alzheimer disease—Insights from
amyloid-beta metabolism beyond the brain. Nat. Rev. Neurol. 2017, 13, 612–623. [CrossRef] [PubMed]
8. Bekris, L.M.; Galloway, N.M.; Millard, S.; Lockhart, D.; Li, G.; Galasko, D.R.; Farlow, M.R.; Clark, C.M.;
Quinn, J.F.; Kaye, J.A.; et al. Amyloid precursor protein (APP) processing genes and cerebrospinal fluid APP
cleavage product levels in Alzheimer’s disease. Neurobiol. Aging 2011, 32, 556.e513–556.e523. [CrossRef]
[PubMed]Int. J. Mol. Sci. 2019, 20, 1219 13 of 14
9. Aguera-Ortiz, L.; Frank-Garcia, A.; Gil, P.; Moreno, A.; Group, E.S. Clinical progression of moderate-to-severe
Alzheimer’s disease and caregiver burden: A 12-month multicenter prospective observational study.
Int. Psychogeriatr. 2010, 22, 1265–1279. [CrossRef] [PubMed]
10. Herman, L.; Atri, A.; Salloway, S. Alzheimer’s Disease in Primary Care: The Significance of Early Detection,
Diagnosis, and Intervention. Am. J. Med. 2017, 130, 756. [CrossRef] [PubMed]
11. Min, J.; Moon, W.J.; Jeon, J.Y.; Choi, J.W.; Moon, Y.S.; Han, S.H. Diagnostic Efficacy of Structural MRI
in Patients with Mild-to-Moderate Alzheimer Disease: Automated Volumetric Assessment Versus Visual
Assessment. AJR Am. J. Roentgenol. 2017, 208, 617–623. [CrossRef] [PubMed]
12. Chetelat, G. Neuroimaging Alzheimer’s disease: Early diagnosis, monitoring, and mechanism understanding.
Med. Sci. 2011, 27, 193–198. [CrossRef]
13. Laboratories, K. Alzheimer’s Disease—Homo Sapiens (Human). Available online: http://www.genome.jp/
kegg-bin/show_pathway?hsa05010 (accessed on 23 January 2018).
14. Wegmann, S.; Bennett, R.E.; Amaral, A.S.; Hyman, B.T. Studying tau protein propagation and pathology in
the mouse brain using adeno-associated viruses. Methods Cell Biol. 2017, 141, 307–322. [CrossRef] [PubMed]
15. Li, J.Q.; Yu, J.T.; Jiang, T.; Tan, L. Endoplasmic reticulum dysfunction in Alzheimer’s disease. Mol. Neurobiol.
2015, 51, 383–395. [CrossRef] [PubMed]
16. Berridge, M.J. Calcium signalling and Alzheimer’s disease. Neurochem. Res. 2011, 36, 1149–1156. [CrossRef]
[PubMed]
17. Yuan, X.Z.; Sun, S.; Tan, C.C.; Yu, J.T.; Tan, L. The Role of ADAM10 in Alzheimer’s Disease. J. Alzheimers Dis.
2017, 58, 303–322. [CrossRef] [PubMed]
18. Lee, L.C.; Goh, M.Q.L.; Koo, E.H. Transcriptional regulation of APP by apoE: To boldly go where no isoform
has gone before: ApoE, APP transcription and AD: Hypothesised mechanisms and existing knowledge gaps.
Bioessays 2017, 39. [CrossRef] [PubMed]
19. Canudas, J.; Insua, D.; Sarasa, L.; Gonzalez-Martinez, A.; Suarez, M.L.; Santamarina, G.; Pesini, P.; Sarasa, M.
Neprilysin is poorly expressed in the prefrontal cortex of aged dogs with cognitive dysfunction syndrome.
Int. J. Alzheimers Dis. 2014, 2014, 483281. [CrossRef] [PubMed]
20. Chen, Y.; Liu, W.; McPhie, D.L.; Hassinger, L.; Neve, R.L. APP-BP1 mediates APP-induced apoptosis and
DNA synthesis and is increased in Alzheimer’s disease brain. J. Cell Biol. 2003, 163, 27–33. [CrossRef]
[PubMed]
21. Agostinho, P.; Lopes, J.P.; Velez, Z.; Oliveira, C.R. Overactivation of calcineurin induced by amyloid-beta
and prion proteins. Neurochem. Int. 2008, 52, 1226–1233. [CrossRef] [PubMed]
22. Seo, J.; Kritskiy, O.; Watson, L.A.; Barker, S.J.; Dey, D.; Raja, W.K.; Lin, Y.T.; Ko, T.; Cho, S.; Penney, J.;
et al. Inhibition of p25/Cdk5 attenuates tauopathy in mouse and iPSC models of frontotemporal dementia.
J. Neurosci. 2017. [CrossRef] [PubMed]
23. Zhou, X.; Huang, J.; Pan, S.; Xu, M.; He, R.; Ji, Z.; Hu, Y. Neurodegeneration-Like Pathological and Behavioral
Changes in an AAV9-Mediated p25 Overexpression Mouse Model. J. Alzheimers Dis. 2016, 53, 843–855.
[CrossRef] [PubMed]
24. Wang, Y.; Veremeyko, T.; Wong, A.H.; El Fatimy, R.; Wei, Z.; Cai, W.; Krichevsky, A.M. Downregulation
of miR-132/212 impairs S-nitrosylation balance and induces tau phosphorylation in Alzheimer’s disease.
Neurobiol. Aging 2017, 51, 156–166. [CrossRef] [PubMed]
25. Miszczuk, D.; Debski, K.J.; Tanila, H.; Lukasiuk, K.; Pitkanen, A. Traumatic Brain Injury Increases the
Expression of Nos1, Abeta Clearance, and Epileptogenesis in APP/PS1 Mouse Model of Alzheimer’s
Disease. Mol. Neurobiol. 2016, 53, 7010–7027. [CrossRef] [PubMed]
26. Hernandez, F.; Lucas, J.J.; Avila, J. GSK3 and tau: Two convergence points in Alzheimer’s disease.
J. Alzheimers Dis. 2013, 33 (Suppl. 1), S141–S144. [CrossRef] [PubMed]
27. Maqbool, M.; Hoda, N. GSK3 inhibitors in the therapeutic development of diabetes, cancer and
Neurodegeneration: Past, present and future. Curr. Pharm. Des. 2017. [CrossRef] [PubMed]
28. Foster, T.C.; Kyritsopoulos, C.; Kumar, A. Central role for NMDA receptors in redox mediated impairment
of synaptic function during aging and Alzheimer’s disease. Behav. Brain Res. 2017, 322, 223–232. [CrossRef]
[PubMed]
29. Lin, C.H.; Huang, Y.J.; Lin, C.J.; Lane, H.Y.; Tsai, G.E. NMDA neurotransmission dysfunction in mild
cognitive impairment and Alzheimer’s disease. Curr. Pharm. Des. 2014, 20, 5169–5179. [CrossRef] [PubMed]You can also read