Spring Moisture Availability is the Major Limitation for Pine Forest Productivity in Southwest China
←
→
Page content transcription
If your browser does not render page correctly, please read the page content below
Article
Spring Moisture Availability is the Major Limitation
for Pine Forest Productivity in Southwest China
Yingfeng Bi 1,2,3 , Cory Whitney 4 , Jianwen Li 1,2,3 , Jingchao Yang 5 and Xuefei Yang 1,2,3, *
 1    Key Laboratory for Plant Diversity and Biogeography of East Asia, Chinese Academy of Sciences,
      Kunming 650201, China; biyingfeng@mail.kib.ac.cn (Y.B.); lijianwen@mail.kib.ac.cn (J.L.)
 2    Key Laboratory of Economic Plants and Biotechnology, Kunming Institute of Botany,
      Chinese Academy of Sciences, Kunming 650201, China
 3    Southeast Asia Biodiversity Research Institute, Chinese Academy of Sciences, Menglun,
      Mengla 666303, China
 4    Institute of Crop Science and Resource Conservation (INRES)—Horticultural Sciences/Center for
      Development Research (ZEF), University of Bonn, 53121 Bonn, Germany; cory.whitney@uni-bonn.de
 5    Kunming Institute of Survey and Design, State Forestry and Grassland Administration, Kunming 650216,
      Yunnan, China; yjc1126xny@163.com
 *    Correspondence: xuefei@mail.kib.ac.cn

 Received: 24 February 2020; Accepted: 9 April 2020; Published: 15 April 2020

 Abstract: Forests in low-latitude (0◦ N–30◦ N) regions are important for greenhouse gas sequestration.
 They harbor around 25% of vegetation carbon stocks. The productivity of these forests is expected
 to change as the global climate changes. They may absorb less greenhouse gasses, with negative
 effects on the global climate. However, little is known about how exactly these forests will respond to
 climate change. Here, we focus on the largest pine forests in low-latitude forests areas in southwest
 China. These forests have experienced rapid climate warming over the past 60 years. We collected
 tree-ring cores from two naturally occurring key afforestation pine tree species: Pinus yunnanensis
 Franch. and Pinus armandii Franch. in Baoshan and Lijiang of Yunnan. We used basal area increment
 (BAI) to examine the productivity trends of these two species over long-time scales, and Partial Least
 Squares regression analysis together with Pearson correlation analysis to identify the critical climate
 periods for the growth of these two species. We found that: (1) regional pine tree productivity began
 to decline at the beginning of this century. (2) The radial growth of both species had the strongest
 positive correlation with the spring Palmer Drought Severity Index (PDSI) and precipitation and
 the strongest negative correlation with spring temperatures. (3) Climate responses differ by species
 with higher positive correlations between tree-ring width, PDSI, and precipitation in P. armandii
 than in P. yunnanensis at similar locations. (4) Climate responses differ by location with higher
 positive correlations between tree-ring width and PDSI in Lijiang than in Baoshan for P. yunnanensis.
 Our results suggest that spring moisture availability is the main limiting factor for pine tree growth,
 especially for P. yunnanensis in Lijiang and P. armandii in Baoshan. Future regional warming and
 warm-induced drought conditions may have negative effects on the growth of pine trees. These results
 provide reference data for the sustainable management of pine forests in low-latitude regions of
 southwest China and may be useful in assessing the sustainable carbon sink ability of pine forests in
 this region under climate change.

 Keywords: tree-ring; pine tree; southwest China; climate change

1. Introduction
     Future climate change is likely to influence the productivity of the world’s forests [1]. Changes
in forests productivity are expected to effect the climate system at multiple spatiotemporal scales [2],

Forests 2020, 11, 446; doi:10.3390/f11040446                                    www.mdpi.com/journal/forests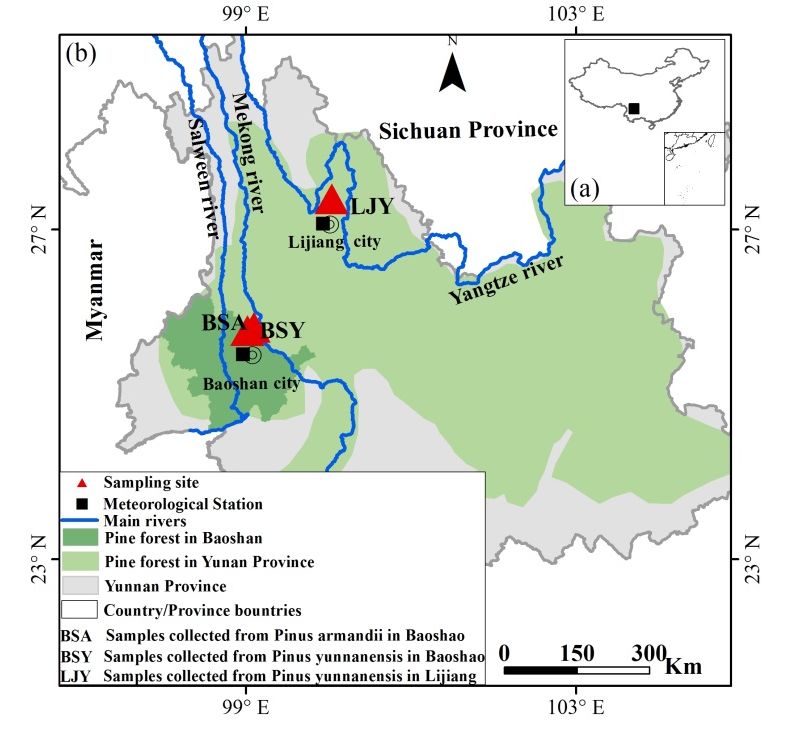
Forests 2020, 11, 446                                                                                2 of 17

as forests play an important role in the global carbon cycle by absorbing atmospheric CO2 and storing it
as carbon sinks [3]. Thus, the fate of forests is of major ecological, societal, and economic concern under
climate change [4]. Past studies have demonstrated that climate warming can increase tree growth and
recruitment in cold biomes [5], but can also lead to growth decline, canopy dieback, and mortality in
semi-arid areas [6]. Much of the relevant research effort has been focused on middle-high latitude
regions (30◦ N to 60◦ N) [7]. Forests in low-latitude regions (0◦ N to 30◦ N) should also be studied, since
they account for only about 10% of total global forested area but contain about 25% of the vegetation
carbon stocks [1]. Considering the critical role played by low-latitude forests in the global carbon cycle,
it is necessary that we gain a better understanding of their growth trends and how these respond to
climate change [1].
      The response of forest growth to climate change can only be evaluated when species-specific
responses are well understood. Previous research has revealed that growth-climate relationships
vary among species and sites, especially in mountainous areas [8–11]. Forests are composed of
many species, and they may show variation in response to climate change due to their varied
physiological adaptation traits in leaf features, tree size, and wood density, and different growth
strategies such as drought or cold tolerance [2]. In addition, forest habitats are diverse in mountainous
areas, mainly due to the complex topography, resulting in diverse growth–climate response patterns.
Therefore, precise predictions of how mountainous forests respond to climate change require thorough
understanding of the relationships between climate factors and the growth of multiple species at
multiple representative sites.
      Southwest China includes the Tibet Autonomous Region, Sichuan and Yunnan provinces,
where most areas belong to low-latitude mountain regions. The region’s forests accounted for
about 26% of the national land area in 2010 and stored nearly 40% of the national carbon [12].
This area is called the “Southwest China Forest Region” and is the second-largest forested area in
China [4,9]. These forests contribute greatly to the national and even to the global carbon cycle [3].
This region is currently experiencing a significant warming trend with a temperature increase rate
of 0.30 ◦ C/decade [13], which exceeds the global (approximately 0.14 ◦ C/decade) [14] and national
(approximately 0.15 ◦ C/decade) [15] warming rates. Forest die-off episodes are frequently reported in
this region [16–18]. Sound forest management plans that ensure the long-term carbon sink ability of
these forests are urgently needed. Developing these plans will require a thorough knowledge of forest
productivity trends and related causes.
      Tree-ring widths, which record annual growth rates, are highly sensitive to climate change, they
can serve as an effective proxy to evaluate tree growth–climate relationships [2]. Although southwest
China was one of the earliest regions for dendroecology research in China [19], past research efforts
mainly focused on fir and spruce species [20]. The radial growth of fir and spruce is mainly limited by
summer temperatures [21]; it is also partially controlled by winter temperatures [22], and the spring
water regime [9]. As of yet, little research has been done on pine forests, although they account for
3% of the national forest area [23]. It has been speculated that the growth–climate relationship of
pine forests may determine their long-term productivity [18,24], which in turn affects the regional
climate system.
      Pinus yunnanensis Franch. and Pinus armandii Franch. are the dominant pine tree species of the
pine forests in the study area. Geographically, P. yunnanensis is naturally distributed across Yunnan,
while P. armandii is distributed from northern to southern China with a southwestern distribution
edge in Yunnan [25]. These species have traditionally served as the key afforestation tree species in
the region [3]. Since the 1980s, large-scale reforestation including P. yunnanensis and P. armandii has
absorbed as much as 28% to 37% of China’s CO2 emissions [3]. Yunnan has the region’s largest forests,
52% of which, about five million hm2 , are pine forests. These species make up about 32% of the total
timber volume, which is estimated to be around 300 million m3 [16].
      Climate warming is expected to impact pine forest growth and timber production in Yunnan,
yet little effort has been made to understand their expected responses to climate warming on a long-term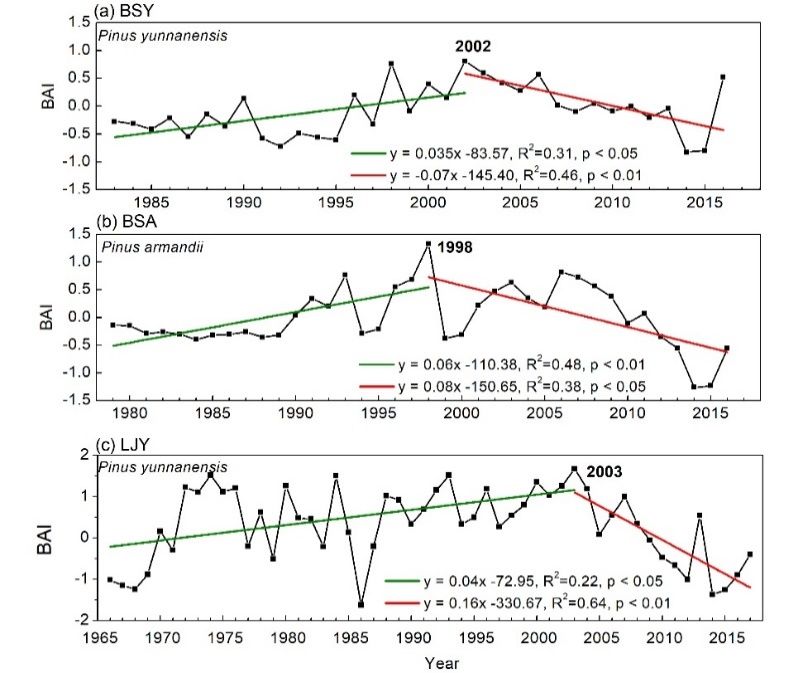
Forests 2020, 11, 446                                                                                3 of 17

scale. We attempt to shed light on these issues with an assessment of tree-rings as a window into
long-term productivity trends and for identifying limiting factors for radial growth. We collected
tree-ring samples from P. yunnanensis and P. armandii from Baoshan and Lijiang, Yunnan to answer
two related research questions: (1) What are the long–term productivity trends of P. yunnanensis and
P. armandii? (2) What are the main limiting factors for their radial growth, and is this consistent across
species and sites? Events related to changing climate, such as high-frequency droughts, are speculated
to be the cause of episodes of die-offs of pine forests in recent years [16–18]. We hypothesize that the
productivity of pine tree species has begun to decline in recent decades due to intensifying aridity
periods in dry seasons (previous November to current May) [26]. We further hypothesize that the
spring water regime is the main limiting factor for pine tree growth.

2. Materials and Methods

2.1. Study Area
      This study took place in the forests surrounding Haitangwa village of Baoshan and the Lijiang
Alpine Botanical Garden, both in Yunnan Province (Figure 1). In the Haitangwa village of Baoshan,
pine forests cover around 150 km2 in a hilly region from 500 to 2500 meters above sea level (m a.s.l),
and around 20% of the forests are mixed pine and around 80% are pure stands of pine (personal contact
with local villagers). In the past, the forest were mainly dominated by evergreen broad-leaved trees,
but they were logged for timber, cut for fuel wood, and cleared for agricultural land expansion [27].
Now, a large portion of the forests is dominated by pine, mainly P. yunnanensis and P. armandii.
These pine forests regenerated naturally after the original evergreen broad-leaved forests were clear-cut,
the farmland was abandoned, or the coniferous and broad-leaved mixed forest was disturbed. The forest
is protected from logging and used primarily for the harvest of non-timber forest products [27]. In Lijiang
Alpine Botanical Garden, pine forests cover a large area from 2600 to 3400 m a.s.l; P. yunnanensis is the
dominant species in this region.
      Climatically, the study sites are mainly dominated by the Southwest Summer Monsoon [28],
resulting in a contrasting dry season (November–May, Figure 2a,c) and wet season (June–October,
Figure 2a,c). The southwest monsoon typically occurs in Baoshan between May 26th and May 31st
and in Lijiang between June 6th and June 10th [29]. According to Longya and Lijiang Meteorological
Station records from 1951 to 2019 [30], the annual mean temperatures were around 16.2 ◦ C and 12.8 ◦ C
respectively, with the lowest value in January (9.1 ◦ C and 6.1 ◦ C) and the highest in June (21.5 ◦ C and
18.2 ◦ C). The total annual precipitation was 970 mm and 950 mm in Longya and Lijiang respectively,
of which 83% and 80% occurs between late May and October. Low-level cloud cover generally increases
with the onset of the summer monsoon in late May together with increasing precipitation and relative
humidity and decreasing sunshine hours (Figure 2b,d).
      Significant warming trends have been observed during the dry and wet seasons; these warming
were stronger in the spring season (increasing 0.02–0.30 ◦ C/decade, Figures S1 and S2). The annual and
seasonal total precipitation has not shown any obvious trends (Figures S1 and S2). The annual mean
relative humidity has decreased since around 1975 (decreasing 0.23%/decade), especially for the spring
season (decreasing 0.24%/decade, Figures S3 and S4). This suggests that the climate in our study may
be getting drier, especially during spring.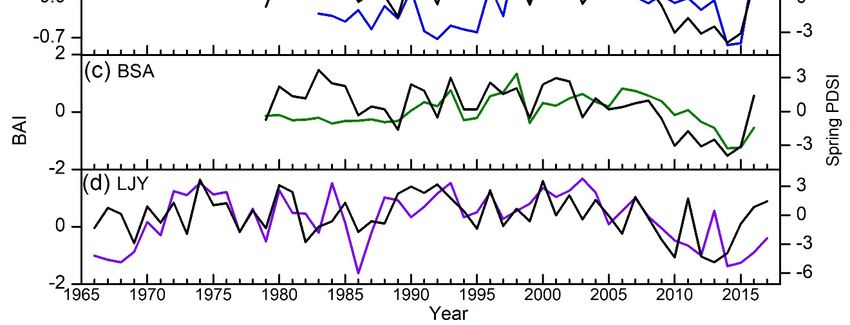
Forests 2020, 11, x FOR PEER REVIEW                                                                                   4 of 17
Forests 2020, 11, 446                                                                                                 4 of 17
Forests 2020, 11, x FOR PEER REVIEW                                                                                    4 of 17

            Figure 1. Geographic location of study area in southwest China (a) and locations of tree-ring sampling
     Figure 1. Geographic location of study area in southwest China (a) and locations of tree-ring
            sites and meteorological stations in Baoshan and Lijiang (b). Note: the distribution area of pine forests
      Figure 1. Geographic
     sampling                   location of study
                  sites and meteorological          area in
                                                stations  in southwest
                                                              Baoshan andChina   (a) and
                                                                              Lijiang  (b).locations
                                                                                             Note: theof tree-ring sampling
                                                                                                          distribution  area
            is redrawn from the pine distribution map of [31]. BSY = (Baoshan yunnanensis) site where Pinus
      sites
     of  pineand  meteorological
               forests  is redrawnstations
                                    from the in pine
                                                Baoshan    and Lijiang
                                                      distribution   map(b).
                                                                          of Note:   the distribution
                                                                              [31]. BSY  = (Baoshan area      of pine forests
                                                                                                         yunnanensis)    site
            yunnanensis samples were collected in Baoshan. BYA = (Baoshan armandii) site where Pinus armandii
      is redrawn     from   the pine  distribution   map   of  [31]. BSY  =  (Baoshan    yunnanensis)
     where Pinus yunnanensis samples were collected in Baoshan. BYA = (Baoshan armandii) site where        site where  Pinus
            samples were collected in Baoshan. LJY = (Lijang yunnanensis) site where P. yunnanensis samples
      yunnanensis
     Pinus   armandiisamples
                       sampleswere
                                 werecollected
                                       collectedininBaoshan.
                                                     Baoshan. BYA
                                                                LJY == (Lijang
                                                                       (Baoshan    armandii) site
                                                                                yunnanensis)     site where
                                                                                                      where Pinus   armandii
                                                                                                              P. yunnanensis
            were collected in Lijiang.
      samples    were    collected in Baoshan.
     samples were collected in Lijiang.            LJY =  (Lijang  yunnanensis)     site where     P. yunnanensis   samples
      were collected in Lijiang.

      Figure 2. Variations of monthly mean air temperature and precipitation (a and c), and relative humidity
           Figure 2.duration
      and sunshine    Variations  of d)
                              (b and monthly   mean
                                        recorded      air temperature
                                                 at Longya  and Lijiang and precipitation
                                                                        Meteorological    (a and
                                                                                       Stations    c), and1951
                                                                                                between     relative
      and  humidity
          2019  in    and sunshine
                   Yunnan,  southwestduration
                                       China. (b and
                                              All the d) recorded
                                                      data were    at Longya and
                                                                standardized      Lijiang
                                                                              using       Meteorological Stations
                                                                                    Z-scores.
       Figure 2. Variations of monthly mean air temperature and precipitation (a and c), and relative
           between 1951 and 2019 in Yunnan, southwest China. All the data were standardized using Z-scores.
       humidity and sunshine duration (b and d) recorded at Longya and Lijiang Meteorological Stations
2.2. Sampling   and Chronology Development
       between 1951 and 2019 in Yunnan, southwest China. All the data were standardized using Z-scores.
     2.2. Samplingtoandthe
     According           Chronology
                             law of Development
                                      limiting factors and the basic principle of site selection in
dendroclimatological
2.2. Sampling           toresearch
               and Chronology
           According                [32],
                                        of aslimiting
                             the Development
                                  law          well as factors
                                                        the objectives
                                                                and theof basic
                                                                            this study,  we firstly
                                                                                   principle   of sitechose  the in
                                                                                                        selection
     dendroclimatological
      According to the law     research [32], as well
                                   of limiting         as the
                                                   factors    objectives
                                                            and          of this
                                                                 the basic       study, we
                                                                              principle  of firstly chose the sparse
                                                                                              site selection   in
dendroclimatological research [32], as well as the objectives of this study, we firstly chose the sparse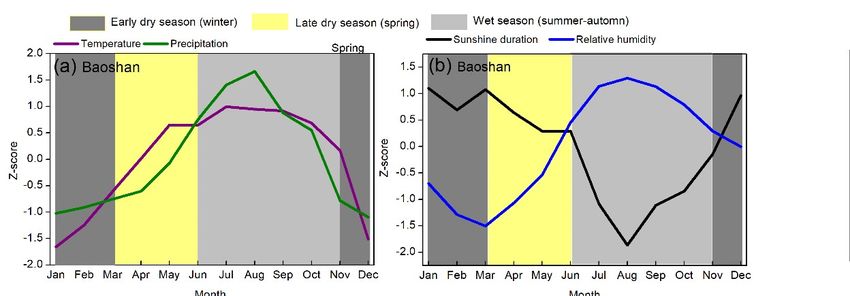
Forests 2020, 11, 446                                                                                            5 of 17

sparse forest as the target forest, and then we selected the edge of the target pine forest as our sampling
site. We selected three sampling sites to collect tree-ring cores. Two sites were located in Baoshan:
one where P. yunnanensis samples were collected and one where P. armandii samples were collected.
We named these sites BSY (Baoshan yunnanensis) and BYA (Baoshan armandii). We also had one site
in Lijiang where P. yunnanensis samples were collected. We named this site LJY (Lijang yunnanensis)
(Figure 1). BSY and BSA were geographically close together, and LJY was around 250 km northeast
of BSY and BSA. At BSY, P. yunnanensis was the dominant tree species. Commonly associated shrub
tree species included Quercus senescens Hand.-Mazz., Dichotomanthes tristaniicarpa Kurz, and Lyonia
ovalifolia (Wall.) Drude. At the BSA site, P. armandii was the dominant trees species. Associated shrub
tree species included Pieris formosa (Wall.) D. Don, Craibiodendron stellatum (Pierre) W. W. Sm., Myrica
nanta Cheval., and Myrsine africana L. At the LJY site, P. yunnanensis was the dominant tree species.
Associated shrub tree species included Quercus pannosa Hand.-Mazz. and Rhododendron decorum Franch.
During sampling, we collected tree-ring cores from healthy pine trees with no visible insect infection,
human or fire disturbance, and with unobstructed canopies with sufficient spatial distance between
the canopy of each tree. We took one to three cores per tree from opposite directions at breast height
(1.3 m) with increment borers (Haglof, Dalarna, Sweden). In total, 201 increment cores from 100 trees
were sampled (Table 1).

      Table 1. Sampling locations and statistics of tree-ring chronologies of pine trees in Baoshan and Lijiang,
      Yunnan, southwest China.

                                                      BSY                      BSA                      LJY
                  Species                      Pinus yunnanensis         Pinus armandii           P. yunnanensis
                 Location                           Baoshan                  Baoshan                  Lijiang
                 Site code                            BSY                      BSA                      LJY
       Latitude/longitude (degree)             25.22◦ N/99.30◦ E        25.21◦ N/99.30◦ E       27.00◦ N/100.19◦ E
            Elevation (m a.s.l.)                      2350                     2351                     3229
      Name meteorological Station               Longya Station           Longya Station           Lijiang Station
                PDSI grid                      25.25◦ N/99.25◦ E        25.25◦ N/99.25◦ E       26.75◦ N/100.25◦ E
               Trees (cores)                         33 (66)                 52 (103)                  24 (41)
             Time span (year)                      1983–2016                1979–2016               1967–2017
    Average radial growth rate (mm)                   3.64                     2.62                     2.36
         Standard deviation (SD)                      0.35                     0.26                     0.30
          Mean sensitivity (MS)                       0.21                     0.26                     0.28
   Mean inter-series correlation (Rbar)               0.49                     0.72                     0.34
    First-order autocorrelation (AC1)                 0.32                     0.34                     0.40
   Expressed population signal (EPS)                  0.97                     0.99                     0.93
                EPS > 0.85                            1988                     1984                     1970
      Mean segment length (MSL)                        30                       30                       40
      BSY = (Baoshan yunnanensis) site where Pinus yunnanensis samples were collected in Baoshan. BYA = (Baoshan
      armandii) site where Pinus armandii samples were collected in Baoshan. LJY = (Lijang yunnanensis) site where
      P. yunnanensis samples were collected in Lijiang, PDSI = Palmer Drought Severity Index.

     We followed the sample preparation and measurement principles (Stokes and Smiley, 1968).
First, we first smoothed the wood surface of each of the increment cores to increase the visibility
of individual tree-ring boundaries by using progressively finer sandpaper (from grade 300 to 1200).
Then, we measured the ring-width with a LINTAB II measuring system (Rinntech Inc., Heidelberg,
Germany) with a precision level of 0.01 mm. Then, we cross-dated the tree-ring measurements to
the calendar years of their formation through pattern matching and statistical tests with the software
package TSAP-Win (Rinn, 2005). Finally, we used the COFECHA program to check the quality of the
cross-dating to ensure exact dating for annual ring-width series [33,34].
     Tree-ring width data were standardized using the ARSTAN program [35] to remove growth trends
related to age and stand dynamics [36]. We applied a data-adaptive power transformation to stabilize
the variance and mitigate non-normality in raw tree-ring width measurement [37]. We detrended the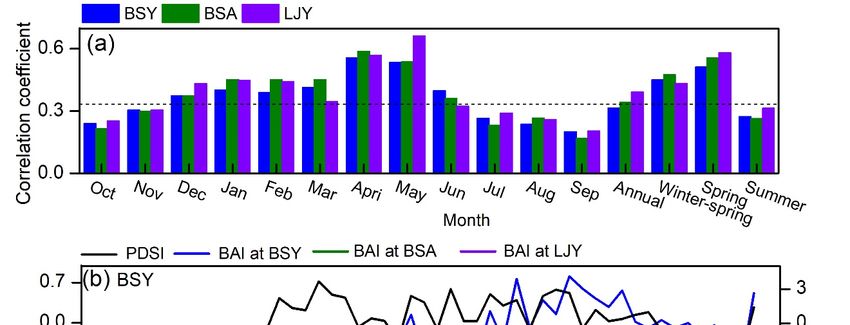
Forests 2020, 11, 446                                                                                6 of 17

tree-ring width series using a “negative exponential curve or a simple linear regression with a negative
slope” [37] and then calculated tree-ring width indices as power transformed ring-width measurements
minus the values of the fitted curves for each series. This procedure effectively prevents the introduction
of bias into the final series, which can occur in the traditional ratio-method standardization as a result
of the division process [38]. We used autoregressive (AR) modeling on each detrended series to
remove temporal autocorrelation [39]. Then, we averaged all the detrended series into a chronology
by computing a bi-weight robust mean to describe the overall tree growth at each site [39]. Finally,
we used the Briffa Rbar-weighted method to stabilize variance in chronology in order to reduce the
potential influence of decreasing the number of sampling trees [40].
     We calculated inter-series correlation (Rbar) and expressed population signal (EPS) with 20-year
running windows and a 10-year overlap along the chronologies. We finally used Rbar, EPS, mean
sensitivity (MS), and first-order autocorrelation (AC1) to assess the quality of the chronology [41,42].

2.3. Climate Data
     Long-term climate meteorological observations are lacking for our sampling sites. However, our
previous research suggested high correlation between data from the local weather observation systems
(25.22◦ N, 99.30◦ E, 2350 m, installed 1.5 m above ground) and data recorded at Longya Meteorological
Station (25.12◦ N, 99.18◦ E, 1652 m, installed 1.5 m above ground) in 2009 [43]. Previous research also
suggests that daily climate data may be more reliable than monthly climate data for assessing the tree
growth–climate relationship [44–46]. We downloaded the mean daily temperature and precipitation
data from 1951 to 2018 from the National Meteorological Information Center of China [30] for our
assessment. In order to test our hypotheses, we also correlated our tree-ring width data with the
monthly Palmer Drought Severity Index (PDSI), which is an indicator of soil moisture availability.
The PDSI was calculated based on precipitation, temperature, and soil-moisture content [47]. Data on
the PDSI from 1901 to 2017 were downloaded from the Royal Netherlands Meteorological Institute
(KNMI) climate explorer (http://climexp.knmi.nl) for areas close to BSY and BSA (25.25◦ N/99.25◦ E),
and close to LJY (26.75◦ N/100.25◦ E).

2.4. Statistic Analysis

2.4.1. Long-Term Growth
    We converted the raw tree-ring width data into Basal area increment (BAI) by assuming a circular
shape of the stem and using Equation (1). Since BAI is a good proxy for aboveground biomass
change [48]. It can be used to quantify forest productivity (woody production) trends over long
time scales [21]. Tree productivity increases with tree age until the tree begins to decline or die.
We conducted this analysis with the package “dpIR” [49] in the R programming language [50].

                                          BAIn = π R2n − R2n−1                                          (1)

where R is the radius of the tree and n is the year of tree-ring formation.
    We also carried out a conservation detrending method. First, BAI was converted to normalized BAI
(NBAI) using Z-scores (a dimensionless variable making among-tree variation in growth comparable).
Then, an age-related trend of NBAI series was computed (cambial age was considered at core height).
We obtained BAI indices using Equation (2).

                                BAI indexij = observed NBAIij − NBAI j                                  (2)

where BAI indexij stands for the value calculated for the year j in the tree i; observed NBAIij is the
normalized BAI value of the year j in the tree i; and NBAI j is the calculated age-related normalized
BAI value for the year j.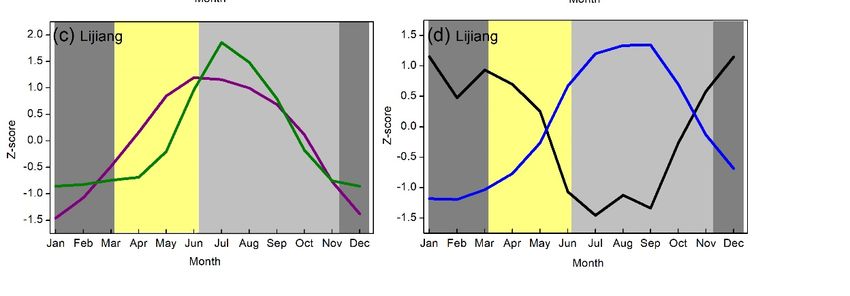
Forests 2020, 11, 446 7 of 17
Forests 2020, 11, x FOR PEER REVIEW 7 of 17
2.4.2. Growth–Climate Relationship
2.4.2. Growth–Climate Relationship
We gathered a number of independent and dependent variables to test the growth–climate
We gathered
relationship. a number of regions
In the low-latitude independent andthe
of Asia, dependent
onset of variables
cambiumtoactivity
test theingrowth–climate
pine trees starts
around May and ends in September [44,51]. Thus, we selected the daily temperature and trees
relationship. In the low-latitude regions of Asia, the onset of cambium activity in pine starts
precipitation
around May and ends in September [44, 51]. Thus, we selected the daily temperature and
from October 1st in the previous year to September 30th in the current year as the independent variables.
precipitation from October 1st in the previous year to September 30th in the current year as the
We treat the temperature or precipitation during each day as an independent variable. Given that there
independent variables. We treat the temperature or precipitation during each day as an independent
are 365 days for temperature and 365 days for precipitation, the total number of independent variables
variable. Given that there are 365 days for temperature and 365 days for precipitation, the total
is around 730. The dependent variables are tree-ring width indices for pine trees. We treat the value of
number of independent variables is around 730. The dependent variables are tree-ring width indices
each tree-ring width in each year as one observation. There were 33 observations from 1984 to 2016 at
for pine trees. We treat the value of each tree-ring width in each year as one observation. There were
BSY33and BSA and from
observations 47 observations
1984 to 2016from 1970
at BSY andtoBSA
2017andat LJY.
47 observations from 1970 to 2017 at LJY.
WeWe used
used Partial Least Square (PLS) regression to
Partial Least Square (PLS) regression analyze the
to analyze the response
responseofoftree-ring
tree-ringwidth
width to to
variations
variationsin in
daily
daily temperatures
temperaturesand andprecipitation
precipitation during
during allall 365
365days
daysofofthe
theyear
yearbased
based onon data
data from
from
1983 to 2016
1983 (1970(1970
to 2016 to 2017to at LJY).
2017 at PLS
LJY).(Figure 3) is a technique
PLS (Figure that reduces
3) is a technique thatthe number
reduces theof number
independent
of
variables to a smaller set of uncorrelated components using the ideas of principal
independent variables to a smaller set of uncorrelated components using the ideas of principal component analysis
and canonicalanalysis
component correlationandanalysis.
canonicalThen, PLS performs
correlation multiple
analysis. Then, PLSregression on dependent
performs multiple variables
regression on
anddependent
the components
variablesof independent variablesof[52,53].
and the components This process
independent works
variables [52,efficiently
53]. This in situations
process workssuch
efficiently
as ours whereinthe situations
number of such as ours where
independent the number
variables of independent
substantially exceeds thevariables
number of substantially
observations
andexceeds the number
independent of observations
variables are highlyand independent variables are highly auto-correlated.
auto-correlated.
Figure
Figure 3. Framework
3. Framework of implementing
of implementing PartialPartial Least Square
Least Square Regression
Regression (PLS)
(PLS) based on based on daily
daily temperature
temperature and precipitation data and tree-ring widths of pine trees. N = total number of
and precipitation data and tree-ring widths of pine trees. N = total number of observations. PCA
observations. PCA (principal component analysis) is used to remove the collinearity among daily
(principal component analysis) is used to remove the collinearity among daily temperature and
temperature and precipitation data. CCA (canonical correlation analysis) was used to find the
precipitation data. CCA (canonical correlation analysis) was used to find the components that most
components that most strongly relate to tree-ring width. LSM (least squares method) was used for
strongly relate to tree-ring width. LSM (least squares method) was used for parameter estimation
parameter estimation in the PLS model. VIP (variable importance in the projection) was used to judge
in the PLS model. VIP (variable importance in the projection) was used to judge the importance of
the importance of each variable.
each variable.
We used root mean squared errors (RMSE) to assess the performance of the PLS model [54]. We
We used root mean squared errors (RMSE) to assess the performance of the PLS model [54].
calculated the variable importance in the projection (VIP) statistic for each independent variable (each
We calculated the variable importance in the projection (VIP) statistic for each independent variable
day). VIP is equal to the weighted sum of squares of the PLS loadings. The VIP indicates the
(each day). VIP is equal to the weighted sum of squares of the PLS loadings. The VIP indicates
importance of the independent variables for explaining variation in the dependent variable. A
thethreshold
importance
of 0.8ofis the independent
commonly assumedvariables
to signifyfor explaining
importance variation
[53], in thethis
and we adopt dependent variable.
threshold for the
A threshold
present study. We also calculated standardized coefficient (beta values) for each independentfor
of 0.8 is commonly assumed to signify importance [53], and we adopt this threshold
thevariable,
presentwhich
study.indicate
We alsothecalculated standardized
strength and direction ofcoefficient (beta of
the relationship values) for each independent
each independent variable
variable,
with thewhich indicatevariable.
dependent the strengthPLSand
wasdirection of the
conducted relationship
with the packageof each independent
“chillR” [54] in variable
the R
with the dependent variable.
programming language [50]. PLS was conducted with the package “chillR” [54] in the R programming
languageTo[50].
interpret the results of PLS regression, we mainly considered the overall impact of multiple
continuous independent variables (a continuous period) on the dependent variable, rather than theForests 2020, 11, 446 8 of 17
To interpret the results of PLS regression, we mainly considered the overall impact of multiple
continuous independent variables (a continuous period) on the dependent variable, rather than the
effect of a single independent variable on the dependent variable. For example, in the case that all or
most of the standardized coefficients of continuous daily climate observations are positive or negative,
and the average VIP for those days exceeds 0.8; we consider this a critical climate period (CP) for
tree growth.
We further calculated the Pearson correlation coefficient [55] between tree-ring width and each
CP. Then, we used the absolute values of average standardized coefficients of each CP, together with
the correlation coefficient between CP and tree-ring width, to determine the relative importance of
each CP on the dependent variable. The higher the absolute value of standardized coefficients and
correlation coefficients between CP and tree-ring width, the more important we considered this CP to
be for tree growth.
3. Results
3.1. Chronology Statistics
All chronologies reveal high Rbar values, indicating that all chronologies are suitable for the
study of the growth–climate relationship (Table 1). The growth of P. yunnanensis at LJY had the lowest
rates, followed by P. armandii at BSA. The highest value of MS was found for P. yunnanensis in Lijiang,
and then for P. armandii in Baoshan. Those results suggest that the growth of P. yunnanensis in Lijiang
is more sensitive to environmental changes, followed by the growth of P. armandii in Baoshan.
3.2. Long-Term Growth Trend
We found that the BAI value of pine trees significantly increased until the beginning of this century
and then displayed a significantly decreasing trend (Figure 4). The year with the highest BAI value
for P. yunnanensis was 2002 at BSY, 2003 at LJY, and 1998 for P. armandii at BSA. Species-specifically,
the change trends for P. armandii were higher than those for P. yunnanensis in Baoshan as indicated by
higher standardized coefficients. Site-specifically, the change trends for P. yunnanensis were stronger at
LJY than those at BSY.We found that the BAI value of pine trees significantly increased until the beginning of this
century and then displayed a significantly decreasing trend (Figure 4). The year with the highest BAI
value for P. yunnanensis was 2002 at BSY, 2003 at LJY, and 1998 for P. armandii at BSA. Species-
specifically, the change trends for P. armandii were higher than those for P. yunnanensis in Baoshan as
indicated
Forests 2020, 11,by
446higher standardized coefficients. Site-specifically, the change trends for P. yunnanensis
9 of 17
were stronger at LJY than those at BSY.
Figure
Figure 4.4.Change
Change trends
trendsininthe normalized
the normalized basal areaarea
basal increments (BAI) (BAI)
increments of Pinus
ofyunnanensis (102 cores)
Pinus yunnanensis (102
at BSY
cores) (a) and
at BSY LJY LJY
(a) and (c) and Pinus
(c) and armandii
Pinus (103(103
armandii cores) at BSA
cores) (b) (b)
at BSA in Baoshan
in Baoshan andand
Lijiang, Yunnan,
Lijiang, Yunnan,
southwestChina.
southwest China. BSY
BSY = = (Baoshan
(Baoshanyunnanensis)
yunnanensis) site where
site whereP. yunnanensis
P. yunnanensissamples werewere
samples collected in
collected
Baoshan. BYA = (Baoshan armandii) site where P. armandii samples were collected
in Baoshan. BYA = (Baoshan armandii) site where P. armandii samples were collected in Baoshan. in Baoshan. LJY =
(Lijang yunnanensis) site where P. yunnanensis samples were collected in
LJY = (Lijang yunnanensis) site where P. yunnanensis samples were collected in Lijiang. Lijiang.
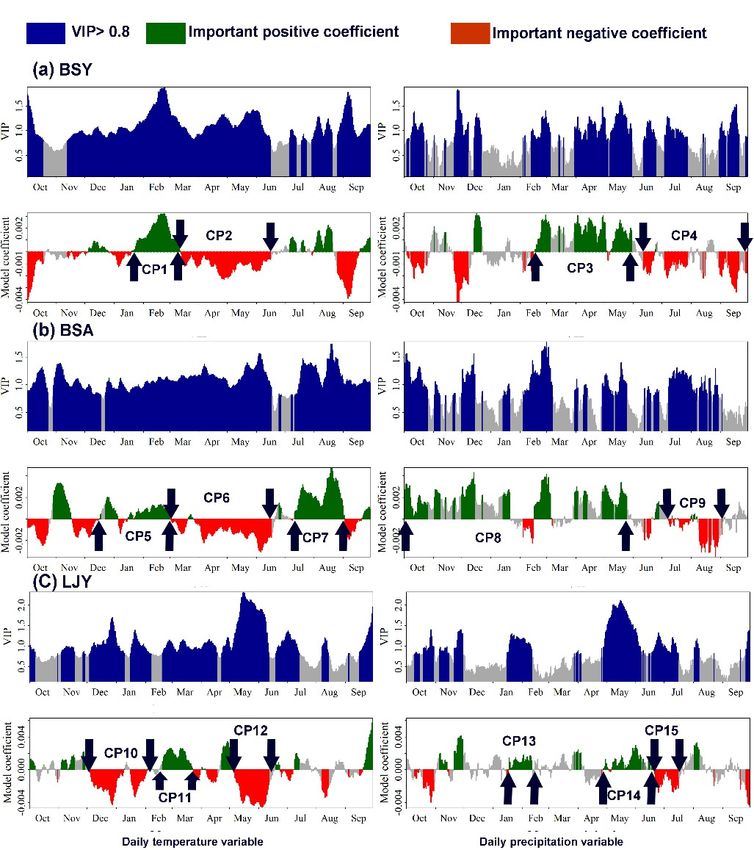
3.3. Critical Climate Periods for Pine Tree Growth
The PLS model revealed four CPs (critical climate periods) for the growth of P. yunnanensis
(Figure 5a, CP1 to 4) at BSY, five CPs for the growth of P. armandii (Figure 5b CP5 to 9) at BSA, and six
CPs for the growth of P. yunnanensis (Figure 5c, CP10 to 15) at LJY. RMSE values indicated a predicted
error of less than 10% in the PLS models.The PLS model revealed four CPs (critical climate periods) for the growth of P. yunnanensis
(Figure 5a, CP1 to 4) at BSY, five CPs for the growth of P. armandii (Figure 5b CP5 to 9) at BSA, and
six CPs for the growth of P. yunnanensis (Figure 5c, CP10 to 15) at LJY. RMSE values indicated a
Forests 2020, 11,
predicted 446 of less than 10% in the PLS models.
error 10 of 17
Figure
Figure 5.5. Results
Results of
of Partial
Partial Least
Least Squares
Squares (PLS)
(PLS) regression
regression for
for correlating
correlating tree-ring
tree-ring widths
widths ofof Pinus
Pinus
yunnanensis Pinus armandii (b) at BSA, and P. yunnanensis
yunnanensis (a) at BSY and Pinus armandii (b) at BSA, and P. yunnanensis (c) at LJY in Yunnan from
(a) at BSY and (c) at LJY in Yunnan from
1983
1983 to
to 2016
2016 (1967
(1967 toto 2017
2017 at
at LJY)
LJY) with
with 15-day
15-day running
running means
means ofof daily
daily mean
mean temperature
temperature (left
(left panel),
panel),
daily
daily precipitation (right panel)
precipitation (right panel)from
fromthe
theprevious
previousOctober
OctobertotoSeptember.
September.VIPVIP (variable
(variable importance
importance in
in the projection) was used to judge the importance of each variable. CP1 to CP15 indicate
the projection) was used to judge the importance of each variable. CP1 to CP15 indicate critical climate critical
climate periods (CP), with variable importance (VIP) greater than the threshold of 0.8. BSY = (Baoshan
periods (CP), with variable importance (VIP) greater than the threshold of 0.8. BSY = (Baoshan
yunnanensis) site where P. yunnanensis samples were collected in Baoshan. BYA = (Baoshan armandii)
yunnanensis) site where P. yunnanensis samples were collected in Baoshan. BYA = (Baoshan armandii)
site where P. armandii samples were collected in Baoshan. LJY = (Lijang yunnanensis) site where
site where P. armandii samples were collected in Baoshan. LJY = (Lijang yunnanensis) site where P.
P. yunnanensis samples were collected in Lijiang.
yunnanensis samples were collected in Lijiang.
Based on the average standardized coefficient of each CP in the PLS models and the significance
of the Pearson correlation coefficient between each CP and tree-ring widths (Table 2), we found that:
(1) The precipitation from February 23 to May 30 (spring) had a positive, and the strongest, relationship
with the radial growth of P. yunnanensis and a negative relationship with the temperature from March
13 to June 11 (spring) at BSY. The growth of P. armandii was positively related to precipitation from
October 1 to May 25 (winter–spring) and negatively related to the temperature from March 13 to
June 11 (spring) and the precipitation from July 8 to August 30 (summer) at BSA. (2) TemperatureForests 2020, 11, 446 11 of 17
from May 6 to June 12 (late-spring) was negatively associated with the growth of P. yunnanensis as
were temperature from December 4 to January 31 (winter) and precipitation from June 21 to July 16
(summer) at LJY.
Table 2. Critical climate period (CP) for pine growth in Yunnan, southwest China indicated by
standardized coefficients from Partial Least Square (PLS) regression models and as well as Pearson the
correlation coefficients between CP and tree-ring widths for pine trees in Baoshan and Lijiang, Yunnan.
Standardized
Pearson
VIP Value Coefficient (Beta
Critical Climate Periods (CP) Season Correlation
from PLS Values) from
Coefficients
PLS
Pinus yunnanensis at BSY in Baoshan
TEMP from January 21st to March 12th (CP1) winter 1.40 0.0002 0.14
TEMP from March 13th to June 11th (CP2) spring 1.13 −0.0012 −0.48 **
PREC from February 23rd to May 30th (CP3) spring 1.00 0.0020 0.55 **
PREC Pre from July 4th to September 21st (CP4) summer 0.86 −0.0010 −0.26
Pinus armandii at BSY in Baoshan
TEMP from December 2nd to March 1st (CP5) winter 0.98 0.0005 0.06
TEMP from March 2nd to June 17th (CP6) spring 1.17 −0.0012 −0.47 **
TEMP from July 15th to September 2nd (CP7) summer 1.3 0.0003 0.18
PREC from Oct 1st to May 25th (CP8) Winter-spring 0.86 0.0021 0.61 **
PREC July 8th to August 30th (CP9) summer 1.05 −0.0011 −0.43 *
P. yunnanensis at LJY in Lijiang
TEMP from December 4th to January 31st (CP10) winter 1.08 −0.0020 −0.52 **
TEMP from February 19th to March 23rd (CP11) Early spring 1.00 0.0008 0.23
TEMP from May 6th to June 12th (CP12) Late spring 1.84 −0.0033 −0.75 **
PREC from January 16th to February 11th (CP13) winter 1.12 0.0010 0.26
PREC from Apr 28th to June 20th (CP14) spring 1.43 0.0010 0.25
PREC from June 21st to July 16th (CP15) summer 1.03 −0.0017 −0.50 **
TEMP: temperature; PREC: precipitation; PLS: Partial Least Square (PLS) regression; CP1–15: critical climate period
(CP) that is shown in Figure 5; * significant at 0.05 level; ** significant at 0.01 level. Sites in Yunnan, southwest China:
BSY = (Baoshan yunnanensis) site where Pinus yunnanensis samples were collected in Baoshan. BYA = (Baoshan
armandii) site where Pinus armandii samples were collected in Baoshan. LJY = (Lijang yunnanensis) site where
P. yunnanensis samples were collected in Lijiang.
Overall, pine tree growth in Baoshan and Lijiang was most limited by high temperatures and
low precipitation in spring. We also found that the radial growth of both species is significantly and
positively correlated with PDSI from December to June, with the highest correlation coefficient in
spring (Figure 6a). This suggests that the spring soil moisture availability is the main limiting factor
for pine tree growth in this region.
Regarding species, we found higher correlation coefficients between tree-ring widths and spring
PDSI and precipitation for P. armandii than that for P. yunnanensis in Baoshan. Results also suggest
that the growth of P. armandii was also limited by high precipitation in summer. Regarding sites,
the growth of P. yunnanensis was mainly limited both by high temperature and low precipitation in
the spring season at BSY, while its growth was most strongly limited by high temperatures in late
spring, low temperatures in winter, and high precipitation in summer at LJY. We also found that the
long-term growth trends were consistent with spring PDSI (Figure 6b,c). Since the year 2000, the PDSI
has decreased, and the growth of both species has shown a decreasing trend. This trend is relatively
prominent for P. armandii at BSA and for P. yunnanensis at LJY.growth of P. yunnanensis was mainly limited both by high temperature and low precipitation in the
spring season at BSY, while its growth was most strongly limited by high temperatures in late spring,
low temperatures in winter, and high precipitation in summer at LJY. We also found that the long-
term growth trends were consistent with spring PDSI (Figure 6b and 6c). Since the year 2000, the
Forests 2020,
PDSI 11, 446
has decreased, and the growth of both species has shown a decreasing trend. This trend 12 of is
17
relatively prominent for P. armandii at BSA and for P. yunnanensis at LJY.
The relationship
Figure 6. The
Figure relationship between
between tree-ring
tree-ring widths
widths andand Palmer
Palmer Drought
Drought Severity
Severity Index
Index (PDSI)
(PDSI) and
and
correlation coefficients between tree-ring widths of Pinus yunnanensis and Pinus armandii
correlation coefficients between tree-ring widths of Pinus yunnanensis and Pinus armandii and PDSI, and PDSI,
horizontal dashed
horizontal dashed line
line denotes
denotes the
the 99%
99% confidence
confidence intervals
intervals (a);
(a); Long-term
Long-term variability
variability of
of spring
spring PDSI
PDSI
and normalized
and normalized basal
basal area
area increment
increment (BAI)
(BAI) of P. yunnanensis
ofP. yunnanensis (b (b and
and d) P. armandii (c) in Baoshan
and P.
d) and Baoshan
and Lijiang,
and Lijiang,Yunnan,
Yunnan,southwest
southwestChina.
China. = (Baoshan
BSYBSY = (Baoshanyunnanensis)
yunnanensis)site where P. yunnanensis
site where samples
P. yunnanensis
were collected in Baoshan. BYA = (Baoshan armandii) site where P. armandii samples
samples were collected in Baoshan. BYA = (Baoshan armandii) site where P. armandii samples were were collected in
Baoshan. LJY = (Lijang yunnanensis) site where P. yunnanensis samples were collected
collected in Baoshan. LJY = (Lijang yunnanensis) site where P. yunnanensis samples were collected in in Lijiang.
Lijiang.
4. Discussion
4. Discussion
4.1. Assessing Long-Term Growth Trends of Pine Trees
Yunnan’sLong-Term
4.1. Assessing forest area makes
Growth up the
Trends largest
of Pine Treescomponent of the “Southwest Forest Region” in
China [4,9] and 52% of Yunnan’s forested land and 32% of total timber volume [16] is pine. These
pine Yunnan’s forest area for
trees are important makes up thecarbon
China’s largestbalance
component of the
because “Southwest
they absorb an Forest Region”
estimated in billion
4.65 China
[4,
tons of carbon [56]. We found that the productivity of the two dominant pine trees in Baoshantrees
9] and 52% of Yunnan’s forested land and 32% of total timber volume [16] is pine. These pine and
are important for China’s carbon balance because they absorb an estimated 4.65 billion
Lijiang in Yunnan, southwest China, began to decline at the beginning of this century (Figure 4 and tons of carbon
[56].
FiguresWeS5found thatThis
and S6). the result
productivity
supports of our
the first
two hypothesis
dominant pine trees
that the in Baoshanofand
productivity pineLijiang in
trees has
Yunnan, southwest China, began to decline at the beginning of this century (Figure
begun to decline in recent decades. Yang et al. (2018) and Shi et al. (2017) also found that the radial 4 and Figures S5
and
growthS6).ofThis result supports
P. yunnanensis beganour first hypothesis
to decline that the
after the 2000s productivity
in nearby Lijiangofandpine trees hasinbegun
Shangri-La Yunnan.to
decline in recent decades. Yang et al. (2018) and Shi et al. (2017) also found that the
Pine forest die-off episodes have also been frequently reported since the early 2000s in Yunnan [16–18].radial growth of
P. yunnanensis began to decline after the 2000s in nearby Lijiang and Shangri-La in
The decline in the productivity of these dominant species in pine forest in Yunnan is expected to affect Yunnan. Pine
southwest China’s carbon budget, and it may have a negative effect on the regional and global climate.
4.2. Spring Soil Moisture Availability is the Main Limiting Factor for Pine Tree Growth
The productivity of forests may largely depend on their growth–climate relationship under
climate change [2]. Here, we investigated the growth–climate relationship of two dominant pineForests 2020, 11, 446 13 of 17
tree species in Baoshan and Lijiang, Yunnan. We found the highest positive correlation coefficient
between tree-ring widths and PDSI during the spring season (Figure 6a). Since PDSI is generally
considered an indicator of soil moisture availability [47], we suggest that the radial growth of pine
trees was mainly limited by spring moisture availability, which supports our hypothesis that the
spring water regime is the main limiting factor for the growth of pine forests. Previous research also
found that the radial growth of Tsuga dumosa (D. Don) Eichler, Picea likiangensis (Franch.) E. Pritz.,
Abies georgei Hand.-Mazz., and P. yunnanensis were also significantly limited by low soil moisture
availability in Lijiang [9,18,57]. Similar growth–climate relationships were also observed in north
Vietnam, north Thailand, and Himalaya regions for Cedrus deodara (Roxburgh) G. Don, Pinus gerardiana
Wall. ex D.Don, Pinus kesiya Royle ex Gordon, and Pinus merkusii Jungh. & de Vriese [51,58,59].
Spring is the pre-monsoon season in our study sites (Figure 2), the soil moisture during spring mainly
comes from precipitation. Higher precipitation results in higher moisture availability and reduces
drought stress on tree growth. The positive relationship between tree-ring width and precipitation
during spring provided further evidence for the importance of water conditions in spring on for pine
tree growth.
We also found a negative relationship between tree-ring widths and temperature during the spring
season. This may be due to higher temperatures intensifying plant transpiration and decreasing the
moisture availability in the soil, which may delay the onset of cambium activity and thus shorten the
xylem formation duration [51,60]. We also found that the growth of both species was negatively affected
by summer precipitation (Table 2). Similar growth–response patterns were also found for A. george at
Shika Snow Mountain in northwest Yunnan [61]. The summer monsoon increases low-level cloud
cover and the frequency of foggy conditions, reducing the amount of solar radiation (Figure 2b,d) and
resulting in lower temperatures. Low summer temperatures can decrease the rates of cambial growth
and xylem cell production [59] and lead to narrower tree-rings. This negative relationship between
tree growth and summer precipitation is further supported by our finding of positive relationships
between tree growth and summer temperatures (Table 2).
4.3. Spring Soil Moisture Availability is More of a Limitation for the Growth of P. armandii than P. yunnanensis
in Baoshan
We found that the radial growth of P. armandii is significantly correlated to precipitation from
winter to spring, while the growth of P. yunnanensis was only significantly correlated with spring
precipitation. The correlation coefficient is higher between tree-ring width and precipitation and PDSI
for P. armandii than that for P. yunnanensis (Table 2). This suggests that the growth of P. armandii is more
sensitive to soil moisture before the growing season. This difference in climate–growth response may
be due to the differences in the physiological traits of the trees. P. armandii tend to have bigger stomata,
lower stomata density, thinner epidermis, thinner cuticles, and looser mesophyll tissue [62]. All these
physiological differences mean that P. armandii is less drought-tolerant than P. yunnanensis.
4.4. Spring Soil Moisture Availability is More of a Limitation on the Growth of P. yunnanensis in Lijiang than
in Baoshan
We found higher positive correlations between the tree-ring width of P. yunnanensis and PDSI in
Lijiang than that in Baoshan. This difference in climate–growth response appears mainly to be due to
the differences in site conditions. LJY is around 250 km northeast to BSY, and the literature suggests that
precipitation gradually decreases from south to north and from east to west in Yunnan, especially in
spring [63]. Spring in Lijiang is drier than in Baoshan with around 9.8% of annual precipitation falling
in spring in Lijiang and 16% in Baoshan according to the meteorological station records. This may
indicate that P. yunnanensis is more sensitive to spring soil moisture availability when it is growing at
its northeast distribution areas than when growing at its southwest distribution areas.Forests 2020, 11, 446 14 of 17
5. Conclusions
Future forest productivity under climate change is likely to depend more and more on the
growth–climate relationship. Pine forests are the critical component of the low-latitude forests of
southwest China and are the most important commercial timber forests in the region. However, little
attention has been given to how these pine forests respond to climate warming. Our assessments of
productivity trends and the growth–climate relationships of P. yunnanensis and P. armandii in Baoshan
and Lijiang indicate that total productivity increased until the beginning of this century, with the
highest increasing rate in P. armandii. The productivity of both species then started to decline with
highest decreasing rate in P. yunnanensis in Lijiang in this century. Spring moisture availability appears
to be the main limiting factor for pine tree growth, especially for the growth of P. yunnanensis in Lijiang
and P. armandii in Baoshan. Our results suggest that the radial growth of both species at both sites may
be continually depressed by regional warming and warmth-induced drought conditions. We suggest
the wide-scale adoption of mixed forests to enhance the adaptive ability of pine forests in China and
allow them to maintain their role as carbon sinks. Our innovative approach provides a means of
evaluating the growth–climate relationship at fine temporal scales. These approaches can be employed
to understand possible future climate change-related tree growth and environment relationships in
other ecosystems.
Supplementary Materials: The following are available online at http://www.mdpi.com/1999-4907/11/4/446/s1,
Figure S1: Temperature (left panel) and precipitation (right panel) variation at multiple temporal scales at Longya
Meteorological Station (1951–2019) in Baoshan. Probability values of the linear regression model according to
F-test are indicated with *** where p < 0.001. The slope value indicates the coefficient of the linear regression
model for rates of change in temperature and precipitation across years. Figure S2: Temperature (left panel) and
precipitation (right panel) variation at multiple temporal scales at Lijiang Meteorological Station (1951–2019)
in Lijiang. Probability values of the linear regression model according to F-test are indicated with *** where
p < 0.001. The slope value indicates the coefficient of the linear regression model for rates of change in temperature
and precipitation across years. Figure S3: Relative humidity variation at multiple temporal scales at Longya
Meteorological Station (1951–2019) in Baoshan. Probability values of the linear regression model according to
F-test are indicated with * where p < 0.05 or ** where p < 0.001. The slope value indicates the coefficient of the
linear regression model for rates of change in relative humidity across years. Figure S4: Relative humidity
variation at multiple temporal scale at Lijiang Meteorological Station (1951–2019) in Lijiang. Probability values
of the linear regression model according to F-test are indicated with * where p < 0.05 or ** where p < 0.001.
The slope value indicates the coefficient of the linear regression model for rates of change in relative humidity
across years. Figure S5: Ring-width chronologies of Pinus yunnanensis (upper panel) and P. armandi (down panel)
and the number of sampling trees for each species in Baoshan. Expressed population signal (EPS) calculated with
20-year running windows and a 10-year overlap along the chronologies. EPS greater than 0.85 indicates a reliable
chronology. Figure S6: Ring-width chronology of Pinus yunnanensis and the number of sampling trees in Lijiang.
Expressed population signal (EPS) calculated with 20-year running windows and a 10-year overlap along the
chronologies. EPS greater than 0.85 indicates a reliable chronology.
Author Contributions: Conceptualization, X.Y. and Y.B.; Methodology, Y.B.; Software, Y.B.; Validation, Y.B. Formal
Analysis, Y.B.; Investigation, Y.F.B, J.L., and J.Y.; Resources, Y.B.; Data Curation, Y.B. and C.W.; Writing—Original
Draft Preparation, Y.B. and C.W.; Writing—Review & Editing, Y.B. and C.W.; Visualization, Y.B. and C.W.;
Supervision, X.Y.; Project Administration, Y.B. and X.Y.; Funding Acquisition, Y.B. and X.Y. All authors have read
and agreed to the published version of the manuscript.
Funding: This research was funded by the National Natural Science Foundation of China (Grant No. 31800410),
by the Chinese Academy of Sciences (CAS) “Light of West China” Program, and by the Southeast Asia Biodiversity
Research Institute, Chinese Academy of Sciences (Grant No. Y4ZK111B01).
Acknowledgments: We thank Fan Zenxin from the Xishuangbanna Tropical Botanical Garden, CAS, for providing
a platform for tree-ring measurement. We also thank Eike Luedeling from the University of Bonn for providing
and maintaining the chillR library and for his assistance with the code for running the PLS models.
Conflicts of Interest: The authors declare no conflict of interest.
References
1. Ashton, M.S.; Tyrrell, M.L.; Spalding, D.; Gentry, B. Managing Forest Carbon in a Changing Climate; Springer:
New York, NY, USA, 2012.Forests 2020, 11, 446 15 of 17
2. Cap, J.; Liu, H.Y.; Zhao, B.; Li, Z.S.; Drew, D.M.; Zhao, X.H. Species-specific and elevation-differentiated
responses of tree growth to rapid warming in a mixed forest lead to a continuous growth enhancement in
semi-humid Northeast Asia. For. Ecol. Manag. 2019, 448, 76–84. [CrossRef]
3. Piao, S.L.; Fang, J.Y.; Ciais, P.; Peylin, P.; Huang, Y.; Sitch, S.; Wang, T. The carbon balance of terrestrial
ecosystems in China. Nature 2009, 458, 1009–1013. [CrossRef] [PubMed]
4. Dai, E.F.; Wu, Z.; Ge, Q.S.; Xi, W.M.; Wang, X.F. Predicting the responses of forest distribution and aboveground
biomass to climate change under RCP scenarios in southern China. Glob. Chang. Biol. 2016, 22, 3642–3661.
[CrossRef]
5. Salzer, M.W.; Hughes, M.K.; Bunn, A.G.; Kipfmueller, K.F. Recent unprecedented tree-ring growth in
bristlecone pine at the highest elevations and possible causes. Proc. Natl. Acad. Sci. USA 2009, 106,
20348–20353. [CrossRef] [PubMed]
6. Allen, C.D.; Breshears, D.D.; McDowell, N.G. On underestimation of global vulnerability to tree mortality
and forest die-off from hotter drought in the Anthropocene. Ecosphere 2015, 6, 55. [CrossRef]
7. Babst, F.; Poulter, B.; Bodesheim, P.; Mahecha, M.D.; Frank, D.C. Improved tree-ring archives will support
earth-system sciencex. Nat. Ecol. Evol. 2017, 1. [CrossRef]
8. Bi, Y.F.; Xu, J.C.; Yang, J.C.; Li, Z.S.; Gebrekirstos, A.; Liang, E.Y.; Zhang, S.B.; Yang, Y.; Yang, Y.P.; Yang, X.F.
Ring-widths of the above tree-line shrub Rhododendron reveal the change of minimum winter temperature
over the past 211 years in Southwestern China. Clim. Dyn. 2017, 48, 3919–3933. [CrossRef]
9. Bi, Y.F.; Xu, J.C.; Gebrekirstos, A.; Guo, L.; Zhao, M.X.; Liang, E.Y.; Yang, X.F. Assessing drought variability
since 1650 AD from tree-rings on the Jade Dragon Snow Mountain, southwest China. Int. J. Climatol. 2015,
35, 4057–4065. [CrossRef]
10. Zhang, Y.; Yin, D.C.; Sun, M.; Wang, H.; Tian, K.; Xiao, D.R.; Zhang, W.G. Variations of Climate-Growth
Response of Major Conifers at Upper Distributional Limits in Shika Snow Mountain, Northwestern Yunnan
Plateau, China. Forests 2017, 8, 377. [CrossRef]
11. Fan, Z.X.; Braeuning, A.; Cao, K.F.; Zhu, S.D. Growth-climate responses of high-elevation conifers in the
central Hengduan Mountains, southwestern China. For. Ecol. Manag. 2009, 258, 306–313. [CrossRef]
12. Li, Q.; Zhu, J.H.; Fan, L.H.; Feng, Y.; Xiao, W.F. Prediction of Forest Carbon Storage and Timber Yield Potential
in Southwestern China. Ecol. Environ. Sci. 2018, 27, 416–423.
13. Wu, J.; Zhang, P.W.; Zha, J.L.; Zhao, D.M.; Lu, W.X. Evaluating the long-term changes in temperature over
the low-latitude plateau in China using a statistical downscaling method. Clim. Dyn. 2019, 52, 4269–4292.
[CrossRef]
14. IPCC. Intergovernmental Panel on Climate Change, Fifth Assessment Report, Working Group II: Impacts, Adaptation,
and Vulnerability; Cambridge University Press: Cambridge, UK, 2014.
15. Cao, L.J.; Zhao, P.; Yan, Z.W.; Jones, P.; Zhu, Y.N.; Yu, Y.; Tang, G.L. Instrumental temperature series in eastern
and central China back to the nineteenth century. J. Geophys. Res.-Atmos. 2013, 118, 8197–8207. [CrossRef]
16. Wang, L.; Zhang, J.F.; Ma, J.Z.; Wei, W.; Hu, Q. Research Progress on Pinus yunnanensis with Degradation
Status and Ecosystem Functions of the Forest Stands. J. West China For. Sci. 2018, 47, 121–130. [CrossRef]
17. Yang, B.A. Investigation on Causes of Death of Yunnan Pine in Yongren County. J. Green Sci. Technol. 2016,
27–28. [CrossRef]
18. Yang, R.Q.; Fan, Z.X.; Li, Z.S.; Wen, Q.Z. Radial growth of Pinus yunnanensis at different elevations and their
responses to climatic factors in the Yulong Snow Mountain, Northwest Yunnan, China. Acta Ecol. Sin. 2018,
38, 8983–8991. [CrossRef]
19. Wu, X.D.; Lin, Z.Y. A preliminary study of the modern climate change in Hengduan Mountains. Geogr. Res.
1987, 6, 48–56.
20. He, M.H.; Yang, B.; Brauning, A.; Rossi, S.; Ljungqvist, F.C.; Shishov, V.; Griessinger, J.; Wang, J.L.; Liu, J.J.;
Qin, C. Recent advances in dendroclimatology in China. Earth Sci. Rev. 2009, 194, 521–535. [CrossRef]
21. Liu, B.; Wang, Y.; Zhu, H.; Liang, E.; Camarero, J.J. Topography and age mediate the growth responses of
Smith fir to climate warming in the southeastern Tibetan Plateau. Int. J. Biometeorol. 2016, 60, 1577–1587.
[CrossRef]
22. Yin, D.C.; Xu, D.R.; Tian, K.; Xiao, D.R.; Zhang, W.G.; Sun, D.C.; Sun, H.; Zhang, Y. Radial Growth Response
of Abies georgei to Climate at the Upper Timberlines in Central Hengduan Mountains, Southwestern China.
Forests 2018, 9, 606. [CrossRef]You can also read