2017 China Cross-Border E-Commerce (Export B2B) Report - DHgate.com
←
→
Page content transcription
If your browser does not render page correctly, please read the page content below

2017 China Cross-Border E-Commerce
(Export B2B) Report

   DHGATE.COM | TSINGHUA UNIVERSITY, NATIONAL ENGINEERING LABORATORY FOR E-COMMERCE TECHNOLOGIES
  | CENTRAL UNIVERSITY OF FINANCE AND ECONOMICS, CHINA CENTER FOR INTERNET ECONOMIC RESEARCH1

Table of Content
Preface .............................................................................................................................. 1
1. 2016 China Cross-Border E-Commerce Development Index .................................... 2
   (i)     2016 China Cross-Border E-Commerce Development Index ......................................... 2
   (ii) 2016 China Cross-Border E-Commerce Market Analysis, By Categories .................... 4
       1. Capacity Index ................................................................................................................... 4
       2. Growth Index ..................................................................................................................... 6
       3. Penetration Index ................................................................................................................ 8
       4. Support Index ................................................................................................................... 10
2. Overall Trading Partner & Products Traded ............................................................. 12
   (i)     Trading Partner ............................................................................................................... 12
   (ii)     Product Categories ........................................................................................................ 13
3. China’s Cross-Border E-Commerce Development & Distribution Analysis 2016 16
   (a) Eastern Region ............................................................................................................... 16
      1. Trade Volume & Growth ................................................................................................... 16
      2. Trade Partners .................................................................................................................. 16
      3. Trade Product Categories ................................................................................................... 18
   (b) Central Region ............................................................................................................... 19
     1. Trade Volume & Growth ................................................................................................... 19
     2. Trade Partners .................................................................................................................. 19
     3. Trade Product Categories ................................................................................................... 20
   (c) Western Region .............................................................................................................. 22
      1. Trade Volume & Growth ................................................................................................... 22
      2. Trade Partners .................................................................................................................. 22
      3. Trade Product Categories ................................................................................................... 23
4. China Cross-Border E-Commerce Development Trends & Outlook 2016 ............ 25
   (a) The “Belt and Road” National Strategy: Constructing an Online Silk Road, Leading
   Enterprises to “Make A Mark Globally”................................................................................. 25
   (b)      Outstanding Development Potential of the ASEAN Market ........................................ 27
   (c)      Support for Product Branding, Putting “Chinese Brands” on the Map ...................... 29
   (d)      Nurturing of Local Industry Clusters, Connecting to Global Merchants.................... 30
   (e)      B2B as Key Driver, E-Commerce’s Transition from Consumers to Commercial ....... 31
   (f)     The Dawn of the Digital Trade Era ................................................................................. 33
5. Conclusion .................................................................................................................. 34
Appendix: Calculation Methodology ............................................................................ 37

           DHGATE.COM | TSINGHUA UNIVERSITY, NATIONAL ENGINEERING LABORATORY FOR E-COMMERCE TECHNOLOGIES
          | CENTRAL UNIVERSITY OF FINANCE AND ECONOMICS, CHINA CENTER FOR INTERNET ECONOMIC RESEARCH2
Preface

      Since 2016, China’s cross-border digital trade has been undergoing rapid growth, with
competition in the industry further intensifying. Production, The penetration rate of e-commerce
activities concerning production, demand, and distribution continued to proliferate, while user base
continued to grow as user experience is constantly improved. The “2017 China Cross-Border E-
commerce (Export B2B) Development Report" takes into account the performance of Chinese
provincial level administrative regions in cross-border e-commerce in 2016, by examining their
respective performance in market size, growth, penetration and market support mechanisms. Apart
from highlighting the scale of the cross-border e-commerce market, this index also places an
emphasis on the weightage of each province’s performance on China’s overall cross-border e-
commerce trade, as well its contribution towards the province’s international trade. This index was
created on actual statistics from Chinese cross-border e-commerce platforms, and was calculated
using a scientific approach, resulting in an objective and true reflection of the current situation and
future developments of China’s cross-border digital trade.

     The index results from the 2017 report shows that major e-commerce hub provinces (or cities)
Guangdong, Zhejiang and Beijing are the top 3 performing players in cross-border e-commerce,
while Ningxia, Qinghai, Inner Mongolia and several other provinces have undergone remarkable
growth. Lastly, Tibet, Yunnan, Xinjiang and a few other provinces still have great room for
improvement pertaining to their cross-border e-commerce activities. Moving forward, under the
strategic backdrop of the “One Belt One Road” initiative, Chinese cross-border e-commerce
businesses and players shall capitalize on policy incentives to satisfy market demands, to further
enhance on supporting infrastructure, and finally to promote the acceleration of development for
cross-border e-commerce.

                               2016 Cross-border                                 2016 Cross-border
                                 E-Commerce                                        E-Commerce
 Rank          Province        Development Index    Rank       Province          Development Index
  1           Guangdong                65.294        18          Hebei                    5.734
  2            Zhejiang                46.556        19          Gansu                    5.556
  3             Beijing                38.003        20         Sichuan                   5.531
  4            Shanghai                29.209        21         Shaanxi                   5.328
  5             Fujian                 25.179        22       Heilongjiang                5.041
  6             Ningxia                20.549        23        Liaoning                   4.906
  7             Jiangsu                19.435        24           Jilin                   4.759
  8           Shandong                 16.238        25         Tianjin                   4.666

DHGATE.COM | TSINGHUA, NELECT | CUFE, CCIER                                                          1
9             Qinghai                  15.086       26          Guizhou                      4.483
   10             Henan                   11.350       27          Guangxi                      3.929
   11             Hunan                    9.877       28          Hainan                       3.597
   12         Inner Mongolia               9.477       29           Shanxi                      3.142
   13           Hong Kong                  9.146       30         Chongqing                     2.869
   14             Jiangxi                  8.929       31            Tibet                      2.254
   15             Anhui                    8.119       32          Yunnan                       1.844
   16             Taiwan                   7.584       33          Xinjiang                     0.582
   17             Hubei                    7.543

   1. 2016 China Cross-Border E-Commerce Development Index

       (i)    2016 China Cross-Border E-Commerce Development Index
       In 2016, the Chinese cross-border e-commerce market has continued to grow, albeit at a more
gradual rate, cross-border e-commerce has exerted a large impact (penetration) on each province’s
economic development, resulting in the continual improvement of market support mechanisms
provided by each province for the general e-commerce market landscape. The performance index
and rank of all provinces’ B2B cross-border e-commerce trade is presented in the following table 1.

        Table 1: China Provincial Level Administrative Regions Cross-Border E-commerce Index 2016
 Rank     Province             Capacity   Growth    Penetration   Support     Cross-Border   Rank in     Change
                                 Index     Index         Index      Index            Index     2015     in Rank
  1       Guangdong            100.000     14.075       38.813     73.582          65.294         1       -
  2       Zhejiang              60.276     16.397       39.538     56.293          46.556         2       -
  3       Beijing               10.496     15.199      100.000     53.822          38.003         5      ↑ 2
  4       Shanghai              26.432     14.477       33.372     45.331          29.209         4       -
  5       Fujian                19.926     10.044       56.248     19.753          25.179         3      ↓ 2
  6       Ningxia                0.008    100.000        0.039      2.689          20.549        33      ↑27
  7       Jiangsu               22.971      7.274       12.863     31.096          19.435         6      ↓ 1
  8       Shandong               8.075     32.914       16.285     15.844          16.238        13      ↑ 5
  9       Qinghai                0.174     54.064       18.328      2.689          15.086        27      ↑18
  10      Henan                  5.364     13.353       24.077      8.593          11.350         7      ↓ 3
  11      Hunan                  2.183     12.232       26.020      6.769           9.877         9      ↓ 2
  12      Inner Mongolia         0.349     33.834        6.908      5.942           9.477        31      ↑19
  13      Hong Kong              0.808     16.514       17.600     10.000           9.146        32      ↑19
  14      Jiangxi                2.550     12.794       20.207      6.545           8.929        11      ↓ 3
  15      Anhui                  2.105      9.735       16.966      9.685           8.119        14      ↓ 1
  16      Taiwan                 0.006     10.308       17.600     10.000           7.584        24      ↑ 8
  17      Hubei                  1.759      7.773       13.901     12.526           7.543        12      ↓ 5
  18      Hebei                  1.765      4.932        8.060     12.148           5.734        10      ↓ 8
  19      Gansu                  0.143     13.443       10.903      3.148           5.556        28      ↑ 9
  20      Sichuan                0.847      3.973        5.444     16.545           5.531        15      ↓ 5
  21      Shaanxi                0.379     10.508        5.097     10.277           5.328        20      ↓ 1
  22      Heilongjiang           0.210      8.686        9.108      6.990           5.041        25      ↑ 3

DHGATE.COM | TSINGHUA, NELECT | CUFE, CCIER                                                                   2
23      Liaoning            0.212      8.639        0.213    15.252        4.906      30    ↑ 7
  24      Jilin               0.238      7.167        8.257     7.893        4.759      18    ↓ 6
  25      Tianjin             0.141     12.587        0.116    10.346        4.666      26    ↑ 1
  26      Guizhou             0.199     12.543        6.672     2.802        4.483      29    ↑ 3
  27      Guangxi             0.637      6.203        8.209     3.958        3.929      16    ↓11
  28      Hainan              0.062     10.723        1.768     5.368        3.597      19    ↓ 9
  29      Shanxi              0.098      8.201        1.605     5.708        3.142      21    ↓ 8
  30      Chongqing           0.362      6.650        1.395     5.574        2.869      23    ↓ 7
  31      Tibet               0.022      2.513        4.632     4.081        2.254      17    ↓14
  32      Yunnan              0.193      3.965        1.604     3.263        1.844      22    ↓10
  33      Xinjiang            0.030      0.000        0.000     2.852        0.582       8    ↓25

       The 2016 China Provincial Level Administrative Regions Cross-Border E-commerce Index
indicates that the top 5 provinces for cross-border e-commerce trade activities are Guangdong,
Zhejiang, Beijing, Shanghai and Fujian. Notably, as the best-performing province in cross-border e-
commerce, Guangdong has promulgated new strategies consistently, made improvements on
regulatory measures to enhance the monitoring of cross-border e-commerce activities, and promoted
the Guangdong Free-Trade Zone cross-border e-commerce regulatory standard, to further propel the
development of cross-border e-commerce. In addition, Guangdong province’s focus and fostering of
the “Internet+” strategy in recent years, which aims to improve the industry and ecosystem
continually, have reaped substantial benefits on promoting cross-border e-commerce’s impacts on
the overall national economy.

       Looking at the change in rankings, various provinces have performed exceptionally and risen
through the ranks in 2016: Ningxia (up 27 spots), Inner Mongolia (up 19 spots), Special
Administrative Region Hong Kong (up 19 spots), and Qinghai (up 18 spots). These four provinces
are relatively new to cross-border e-commerce, but have undergone more rapid growth, and have
strong potential for further development.

DHGATE.COM | TSINGHUA, NELECT | CUFE, CCIER                                                      3
(ii)   2016 China Cross-Border E-Commerce Market Analysis, By
            Categories

1.    Capacity Index
     The capacity index reflects the cross-border e-commerce export capacity in the respective
provinces. They are primarily calculated based on each province’s total volume of export B2B
transactions and their respective Gross Merchandise Volume (GMV). The evaluation results with
regards to the capacity index are presented in Table 2 below.

            Table 2: China Provincial Level Administrative Regions Cross-Border E-Commerce
                                     Capacity Index & Ranking 2016
                Rank     Province         Capacity 2016   Rank in 2015   Change in Rank
                  1      Guangdong              100.000             1          -
                  2      Zhejiang                60.276             2          -
                  3      Shanghai                26.432             3          -
                  4      Jiangsu                 22.971             4          -
                  5      Fujian                  19.926             5          -
                  6      Beijing                 10.496             6          -
                  7      Shandong                 8.075             7          -
                  8      Henan                    5.364             8          -
                  9      Jiangxi                  2.550             9          -
                  10     Hunan                    2.183            12         ↑2
                  11     Anhui                    2.105            11          -
                  12     Hebei                    1.765            10         ↓2
                  13     Hubei                    1.759            13          -
                  14     Sichuan                  0.847            14          -
                  15     Hong Kong                0.808            16         ↑1
                  16     Guangxi                  0.637            15         ↓1
                  17     Shaanxi                  0.379            18         ↑1
                  18     Chongqing                0.362            17         ↓1
                  19     Inner Mongolia           0.349            24         ↑5
                  20     Jilin                    0.238            19         ↓1
                  21     Liaoning                 0.212            21          -
                  22     Heilongjiang             0.210            22          -
                  23     Guizhou                  0.199            23          -
                  24     Yunnan                   0.193            20         ↓4
                  25     Qinghai                  0.174            29         ↑4
                  26     Gansu                    0.143            26          -
                  27     Tianjin                  0.141            25         ↓2
                  28     Shanxi                   0.098            27         ↓1

DHGATE.COM | TSINGHUA, NELECT | CUFE, CCIER                                                  4
29     Hainan                   0.062           28          ↓1
                 30     Xinjiang                 0.030           30          -
                 31     Tibet                    0.022           31          -
                 32     Ningxia                  0.008           33          ↑1
                 33     Taiwan                   0.006           32          ↓1

Some notable highlights of the capacity index:
1. Guangdong, Zhejiang, Shanghai, Jiangsu, and Fujian provinces took the first five spots on the
    ranking. These provinces that are ranked higher on the index are all located along coastal areas,
    and have entered into e-commerce activities relatively earlier, hence their experience and first-
    mover advantage in cross-border e-commerce is substantial, while their unique traits and
    strengths are apparent. The turnover in the provinces of Guangdong and Zhejiang accounted for
    60% of the total turnover nationally. In terms of market size, those ranking lowest on the index
    are mainly provinces in the Northwestern region. The gap between the best-performing and
    weakest-performing provinces on the ranking is huge, with market size disparity between them
    reaching a thousand times or more. The considerable gap can be attributed to factors such as
    information technology, social awareness, standard of living, infrastructure, government
    policies and so on. There is vast room for growth and improvement for these weaker players;
2. Over 50% of provinces did not undergo any change in ranks on the 2015-2016 capacity index.
    Inner Mongolia recorded the largest move upward on the chart through the implementation of
    effective measures such as establishing its own cross-border e-commerce platform, bringing in
    e-commerce enterprises, organizing delegations to Zhejiang and other more developed
    provinces to learn from their experiences in promoting a more conducive cross-border e-
    commerce environment. The policy system of Inner Mongolia continues to improve, allowing
    the overall e-commerce ecosystem to progress as well; this brings great opportunities and
    prospects for the development of cross-border e-commerce businesses in the province.

DHGATE.COM | TSINGHUA, NELECT | CUFE, CCIER                                                        5
2.   Growth Index

     The growth index measures and reflects the provinces’ prospects and potential, focusing on and
calculated with the growth rate of the volume of export orders and overall turnover. The growth index
evaluation results are presented in Table 3 below.

           Table 3: China Provincial Level Administrative Regions Cross-Border E-Commerce
                                     Growth Index & Ranking, 2016
         Rank     Province            Growth Index 2016        Rank in 2015   Change in Rank
           1      Ningxia                        100.000                 32        ↑31
           2      Qinghai                            54.064              33        ↑31
           3      Inner Mongolia                     33.834              31        ↑28
           4      Shandong                           32.914              23        ↑19
           5      Hong Kong                          16.514              30        ↑25
           6      Zhejiang                           16.397              28        ↑22
           7      Beijing                            15.199              26        ↑19
           8      Shanghai                           14.477              29        ↑21
           9      Guangdong                          14.075              24        ↑15
          10      Gansu                              13.443              21        ↑11
          11      Henan                              13.353              16        ↑ 5
          12      Jiangxi                            12.794               8        ↓ 4
          13      Tianjin                            12.587              14        ↑ 1
          14      Guizhou                            12.543              27        ↑13
          15      Hunan                              12.232               9        ↓ 6
          16      Hainan                             10.723               5        ↓11
          17      Shaanxi                            10.508              25        ↑ 8
          18      Taiwan                             10.308              11        ↓ 7
          19      Fujian                             10.044              18        ↓ 1
          20      Anhui                               9.735              19        ↓ 1
          21      Heilongjiang                        8.686              17        ↓ 4
          22      Liaoning                            8.639              20        ↓ 2
          23      Shanxi                              8.201              13        ↓10
          24      Hubei                               7.773              12        ↓12
          25      Jiangsu                             7.274              22        ↓ 3
          26      Jilin                               7.167              15        ↓11
          27      Chongqing                           6.650              10        ↓17
          28      Guangxi                             6.203               4        ↓24
          29      Hebei                               4.932               6        ↓23
          30      Sichuan                             3.973               3        ↓27
          31      Yunnan                              3.965               7        ↓24
          32      Tibet                               2.513               2        ↓30
          33      Xinjiang                            0.000               1        ↓32

Some notable highlights of the provinces’ growth index:

DHGATE.COM | TSINGHUA, NELECT | CUFE, CCIER                                                        6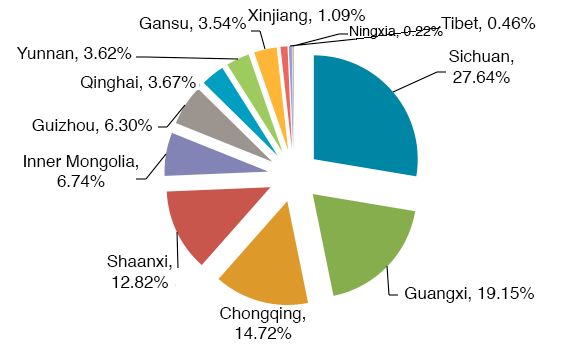
1. Ningxia, Qinghai and Inner Mongolia took the top three spots on the cross-border e-commerce
   growth index; they are considered newer entrants to the e-commerce market but have massive
   potential for development. The three major approaches adopted by the Western regions to
   promote the growth of cross-border e-commerce activities are: nurturing cross-border e-
   commerce business entities, improvements on supporting infrastructure and to foster an
   ecosystem conducive for cross-border e-commerce activities;
2. Nearly 50% of the provinces have undergone a change of 10 positions or more, compared to their
   ranking in the previous year. Shandong moved upwards 19 spots on the growth index, benefitting
   from the establishment of policy and regulatory systems that are viable to the development of
   cross-border e-commerce, efforts on resolving prominent issues that hinder the growth of cross-
   border e-commerce, guiding enterprises to capitalize on “internet+ foreign trade” to realize
   optimized import and export activities as well as to transform and modernize their business model,
   to promote a systematic approach and standardization to the development of cross-border e-
   commerce, and to enable steady growth through such a systematic approach.

DHGATE.COM | TSINGHUA, NELECT | CUFE, CCIER                                                        7
3.   Penetration Index

     The penetration index reveals the impact exerted by each province’s cross-border e-commerce
activities, as a weightage on their overall import and export trade. The assessment results are
presented in Table 4 below.

             Table 4: China Provincial Level Administrative Regions Cross-Border E-Commerce
                                    Penetration Index & Ranking, 2016

       Rank      Province        Penetration Index 2016          Rank in 2015   Change in Rank
         1       Beijing                       100.000                      4         ↑ 3
         2       Fujian                          56.248                     1         ↓ 1
         3       Zhejiang                        39.538                     3          -
         4       Guangdong                       38.813                     2         ↓ 2
         5       Shanghai                        33.372                     7         ↑ 2
         6       Hunan                           26.020                     6          -
         7       Henan                           24.077                     5         ↓ 2
         8       Jiangxi                         20.207                     9         ↑ 1
         9       Qinghai                         18.328                    14         ↑ 5
         10      Hong Kong                       17.600                    29         ↑19
         11      Taiwan                          17.600                    28         ↑17
         12      Anhui                           16.966                     8         ↓ 4
         13      Shandong                        16.285                    12         ↓ 1
         14      Hubei                           13.901                    10         ↓ 4
         15      Jiangsu                         12.863                    13         ↓ 2
         16      Gansu                           10.903                    21         ↑ 5
         17      Heilongjiang                     9.108                    22         ↑ 5
         18      Jilin                            8.257                    15         ↓ 3
         19      Guangxi                          8.209                    17         ↓ 2
         20      Hebei                            8.060                    11         ↓ 9
                 Inner
         21      Mongolia                         6.908                    19         ↓ 2
         22      Guizhou                          6.672                    20         ↓ 2
         23      Sichuan                          5.444                    18         ↓ 5
         24      Shaanxi                          5.097                    16         ↓ 8
         25      Tibet                            4.632                    27         ↑ 2
         26      Hainan                           1.768                    25         ↓ 1
         27      Shanxi                           1.605                    23         ↓ 4
         28      Yunnan                           1.604                    26         ↓ 2
         29      Chongqing                        1.395                    24         ↓ 5
         30      Liaoning                         0.213                    31         ↑ 1
         31      Tianjin                          0.116                    30         ↓ 1
         32      Ningxia                          0.039                    33         ↑ 1
         33      Xinjiang                         0.000                    32         ↓ 1
Some notable highlights of the provinces’ penetration index:

DHGATE.COM | TSINGHUA, NELECT | CUFE, CCIER                                                      8
1. The provinces that ranked higher on the penetration index are essentially the same provinces that are placed higher on the capacity index. This signifies that the cross-border e-commerce activities in these provinces have a larger impact on their overall trade. Cross-border e-commerce already plays an important role in China’s export and import trade, and other provinces can draw on the experiences of these successful players, to continuously improve the overall penetration rate of cross-border e-commerce on the domestic economy; 2. Although Beijing is ranked at the sixth place on the capacity index this year, its ranking on the penetration index has improved, moving upwards to the number one position. The penetration index of Hong Kong and Taiwan has also advanced significantly. The improvements to penetration rate can be largely attributed to local government policy support as well as the optimization of the industry value chain; 3. The provinces that fared poorer on the penetration index are mainly landlocked inland provinces such as Xinjiang and Ningxia, implying that cross-border e-commerce activities are affected by economic development, and a degree of economic openness to a certain extent. DHGATE.COM | TSINGHUA, NELECT | CUFE, CCIER 9
4.   Support Index

     The support index examines environmental factors to reflect the provinces’ overall market
landscape and mechanisms that support the development of digital trade, through assessing indicators
such as infrastructure, logistics framework, and human resources. The assessment results are
presented in Table 5 below.

           Table 5: China Provincial Level Administrative Regions Cross-Border E-Commerce
                                     Support Index & Ranking, 2016

         Rank     Province              Support Index 2016    Rank in 2015   Change in Rank
           1      Guangdong                         73.582               1          -
           2      Zhejiang                          56.293               4         ↑ 2
           3      Beijing                           53.822               2         ↓ 1
           4      Shanghai                          45.331               3         ↓ 1
           5      Jiangsu                           31.096               5          -
           6      Fujian                            19.753               6          -
           7      Sichuan                           16.545               8         ↑ 1
           8      Shandong                          15.844               7         ↓ 1
          9       Liaoning                          15.252              15         ↑ 6
          10      Hubei                             12.526              12         ↑ 2
          11      Hebei                             12.148              13         ↑ 2
          12      Tianjin                           10.346              11         ↓ 1
          13      Shaanxi                           10.277              14         ↑ 1
          14      Hong Kong                         10.000              10         ↓ 4
          15      Taiwan                            10.000               9         ↓ 6
          16      Anhui                              9.685              21         ↑ 5
          17      Henan                              8.593              23         ↑ 6
          18      Jilin                              7.893              16         ↓ 2
          19      Heilongjiang                       6.990              19          -
          20      Hunan                              6.769              26         ↑ 6
          21      Jiangxi                            6.545              24         ↑ 3
          22      Inner Mongolia                     5.942              20         ↓ 2
          23      Shanxi                             5.708              18         ↓ 5
          24      Chongqing                          5.574              22         ↓ 2
          25      Hainan                             5.368              17         ↓ 8
          26      Tibet                              4.081              27         ↑ 1
          27      Guangxi                            3.958              30         ↑ 3
          28      Yunnan                             3.263              32         ↑ 4
          29      Gansu                              3.148              31         ↑ 2
          30      Xinjiang                           2.852              25         ↓ 5
          31      Guizhou                            2.802              33         ↑ 2
          32      Qinghai                            2.689              28         ↓ 4
          33      Ningxia                            2.689              29         ↓ 4

DHGATE.COM | TSINGHUA, NELECT | CUFE, CCIER                                                      10
Some notable highlights of the provinces’ e-commerce support index: 1. The seven provinces Guangdong, Zhejiang, Beijing, Shanghai, Jiangsu, Shandong and Fujian all have a viable environment for the development of growth of digital trade, with internet penetration rate, capital flows and logistical networks presently in leading positions nationally. 2. Provinces in Western China fared relatively poorer on the support index. These provinces require more support mechanisms in the forms of policymaking, financing and funding, for the establishment of infrastructure, logistics network, and human resources. 3. Liaoning, Henan and Hunan climbed 6 positions upwards on the support index, and their progress can be attributed to various factors. Liaoning had established a cross-border e-commerce public service platform, focused on developing business logistics services and the overall e-commerce sector, and accelerated on the establishment of the Liaoning cross-border e-commerce demonstration area, to facilitate the rapid growth of its support environment. Henan has been endorsed recently as a Free Trade Zone, and has been successfully approved for the comprehensive pilot program; these facilitated the robust growth of Henan’s cross-border e- commerce environment. Lastly, Hunan has gradually nurtured the growth of a core group of e- commerce enterprises, through the establishment of exemplary e-commerce demonstrations and the fostering of key projects. The core group of such e-commerce enterprises have a stimulating effect on their respective market sectors, with e-commerce platforms competing healthily and thriving together, forming a cluster effect, further boosting the entire province in its overall e- commerce landscape development. DHGATE.COM | TSINGHUA, NELECT | CUFE, CCIER 11
2. Overall Trading Partner & Products Traded

(i) Trading Partner
       In 2016, the top three major countries of export for China’s cross-border e-commerce are United
States, Russia and Spain respectively. Russia accounted for 21% of the total export trade volume, up
from 16% in 2015, its performance is essentially on par with United States. Paraguay experienced
the highest year-on-year growth rate, with trade volume increasing by over 10 times, the following
chart below features the top 10 countries recording the fastest growth in 2016.

                        Chart 1: Top 10 Countries in Cross-Border Export Growth, 2016

             Top 10 in Cross-      Top 10 in Cross-              Top 10 in Cross-        Top 10 in Cross-
               Border E-             Border E-                     Border E-               Border E-
              Commerce By           Commerce By                   Commerce By             Commerce By
  Rank        Volume, 2015          Volume, 2016       Rank       Growth, 2015            Growth, 2016
   1           United States         United States       1             Latvia               Paraguay
   2              Russia                Russia           2             Chile            Dominican Republic
   3              Brazil                Spain            3           Slovakia                Morocco
   4              Spain                 France           4            Bulgaria             Netherlands
   5         United Kingdom        United Kingdom        5           Slovenia               Argentina
   6             Canada                 Brazil           6           Lithuania              Philippines
   7              France                Israel           7          South Korea              Pakistan
   8              Israel               Canada            8          Kazakhstan              Sri Lanka
   9             Belarus             Netherlands         9             India               South Africa
   10             Chile                Ukraine           10          Moldova                  Ghana

       From the composite index of export by continent, featuring the top 5 countries of respective
regions, Russia has surpassed United States at the number one spot this year, while Canada and Brazil
both recorded a larger drop from 2015.

DHGATE.COM | TSINGHUA, NELECT | CUFE, CCIER                                                                  12
Table 6: Composite Index of Export by Continent, Top 5 Countries, 2016
Region 2015 2016 Region 2015 2016
North America Africa
United States 83.49 81.14 South Africa 27.31 37.10
Canada 51.81 39.30 Morocco 25.97 32.06
Mexico 34.44 35.59 Ghana 27.86 27.12
Costa Rica 25.37 25.70 Nigeria 22.06 23.35
Honduras 18.22 24.67 Guinea 14.27 22.98
South America Europe
Brazil 61.28 45.48 Russia 77.48 88.20
Paraguay 10.71 40.92 France 50.61 54.01
Chile 46.84 39.84 Netherlands 41.26 52.80
Argentina 20.54 38.10 Spain 62.82 49.90
Colombia 28.03 32.62 Ukraine 36.45 47.74
Oceania Asia
Australia 38.17 39.31 Israel 49.07 47.65
New Zealand 35.34 36.99 Turkey 44.17 41.38
American Samoa 26.40 32.73 Indonesia 31.22 36.94
Fiji 17.24 23.49 Saudi Arabia 35.36 36.19
French Polynesia 12.73 22.06 Lebanon 37.80 35.70
(ii) Product Categories
Along with the development of the industry and shifts in the overall trade environment, there
have been significant changes in rankings on the product categories index in 2015-2016. In 2016,
cross-border e-commerce export product trade volume and growth have been registered primarily in
over 20 major product categories such as mobile phones & accessories, fashion apparel, maternity &
baby products, health & beauty, household items, consumer electronics, as well as sports & outdoor
products.
Looking at the composite index of market size and growth, (see Table 7), product categories
with the most marked improvements in ranking are gaming products and footwear, while product
categories recording the sharpest decline are luggage, bags & accessories, and fashion accessories.
Table 7: Major Product Categories Size & Growth Ranking 2016
Rank Product Category 2015 2016 Change in Rank
1 Mobile Phones & Accessories 89.38 91.69 -
DHGATE.COM | TSINGHUA, NELECT | CUFE, CCIER 132 Fashion Apparel 79.55 91.58 ↑1
3 Health & Beauty 73.96 89.62 ↑1
4 Maternity & Baby Products 58.35 80.07 ↑2
5 Household & Gardening 82.47 75.72 ↓3
6 Consumer Electronics 63.54 72.34 ↓1
7 Sports & Outdoor Products 47.70 56.73 ↑2
8 Hair Products 50.58 54.64 ↓1
9 Computers & Networking 41.28 51.56 ↑2
10 Jewelry 50.57 44.65 ↓2
11 Cars, Motorcycles 37.40 43.37 ↑1
12 Watches 29.33 38.72 ↑2
13 Commercial & Industrial 35.65 36.97 -
14 Footwear & Accessories 25.24 32.53 ↑4
15 Toys & Gifts 28.01 27.82 -
16 Luggage, Bags & Accessories 44.17 27.55 ↓6
17 Gaming Products 15.62 25.10 ↑3
18 Lighting 28.00 23.48 ↓2
19 Digital Camera, Photography Equipment 22.16 21.89 -
20 Security & Surveillance 14.42 18.97 ↑1
21 Bridal Gowns 11.28 15.62 ↑2
22 Fashion Accessories 26.69 12.79 ↓5
23 Musical Instruments 11.55 10.90 ↓1
With respect to specific product line (chart 2), the top 10 product sub-categories with the best
potential for growth are virtual reality headsets, sports & action cameras, kitchen accessories,
cosmetic bags, slippers, manicure tools & supplies, wearable devices, professional sports & outdoor
shoes, hair care products and outdoor equipment. With virtual reality headsets and wearable devices
recording rapid growth for two years consecutively.
Chart 2: Top 10 Product Sub-Categories, By Growth
DHGATE.COM | TSINGHUA, NELECT | CUFE, CCIER 14Top 10 Product
Top 10 Product Categories For Top 10 Product Top 10 Product
Categories For Cross-Border Categories For Categories For
Cross-Border E-Commerce, By Cross-Border Cross-Border
E-Commerce, Volume, 2016 E-Commerce, E-Commerce, 2016 -
Rank By Volume, 2016 – Weightage Rank By Growth, 2016 YOY Growth
Mobile Phones &
1 Accessories 10.1% 1 Computing Gaming 114.7%
2 Hair Products 9.3% 2 Health & Beauty 110.8%
Maternity & Baby
3 Fashion Apparel 8.9% 3 Products 75.9%
4 Health & Beauty 8.2% 4 Watches 73.6%
Digital Camera,
Photography
5 Maternity & Baby 7.7% 5 Equipment 52.0%
Consumer
6 Electronics 6.6% 6 Cars, Motorcycles 41.8%
Household &
7 Gardening 6.2% 7 Musical Instruments 39.3%
Security &
8 Watches 5.6% 8 Surveillance 37.5%
Household &
9 Jewelry 5.4% 9 Gardening 36.4%
Mobile Phones &
10 Sports & Outdoor 4.9% 10 Accessories 32.7%
DHGATE.COM | TSINGHUA, NELECT | CUFE, CCIER 153. China’s Cross-Border E-Commerce
Development & Distribution Analysis 2016
This section is an analysis on the development of China’s e-commerce (export B2B) sector through
three dimensions: regional development, product classifications, and trade partnerships.
(a) Eastern Region
1. Trade Volume & Growth
The Eastern region consists of 11 provincial level administrative areas including Beijing,
Tianjin, Hebei, Liaoning, Shanghai, Jiangsu, Zhejiang, Fujian, Shandong, Guangdong and Hainan.
The Eastern region accounted for 93% of the total cross-border e-commerce export trade volume,
with a growth rate of 28%, outperforming both the Central and Western regions considerably. With
respect to trade volume, the top 5 ranking provinces – Guangdong, Zhejiang, Shanghai, Fujian and
Jiangsu remain unchanged. In terms of growth, the export trade volume of Tianjin surged by 208%,
making it the fastest developing province.
Chart 3: China Cross-Border E-Commerce (Export B2B) Regional Distribution: Size
2. Trade Partners
Statistics by country and region from respective provinces pertaining to their export trade
DHGATE.COM | TSINGHUA, NELECT | CUFE, CCIER 16activities also reveals traits unique to each province. For instance, Guangdong, the leader of cross-
border e-commerce, exports primarily to two major trade partners, the United States and United
Kingdom, while their export trade volume with Slovenia and Turkey has experienced the most rapid
growth. On the other hand, Zhejiang’s trade volume with Philippines and Poland has experienced the
greatest growth.
Table 8: Eastern Region Export Composite Index, By Continent & By Country, 2016
2015 2016
North America
United States 84.78 83.84
Canada 70.81 65.65
Mexico 49.98 42.98
The Dominican Republic 27.74 30.49
Puerto Rico 30.48 28.19
South America
Paraguay 18.01 64.33
Brazil 36.32 47.48
Colombia 33.51 43.82
Argentina 21.73 37.62
Peru 28.27 37.27
Oceania
Australia 60.66 60.18
American Samoa 28.74 55.12
New Zealand 35.76 34.54
Wallis and Futuna 9.90 24.07
Independent State of Samoa 9.96 23.33
Africa
Egypt 24.34 39.85
Ghana 33.23 39.25
Nigeria 40.75 36.26
South Africa 43.58 33.07
Botswana 30.92 29.20
Europe
Russia 71.52 72.20
United Kingdom 70.69 67.40
Belgium 29.33 55.83
France 48.49 55.43
Spain 43.50 54.21
Asia
Republic of the Philippines 33.56 47.73
India 64.34 44.77
Saudi Arabia 38.51 42.35
Turkey 20.18 41.25
Israel 27.82 40.59
DHGATE.COM | TSINGHUA, NELECT | CUFE, CCIER 17From the composite index exhibiting the region’s top 5 export trade partner countries from each
continent, United States is still the country accounting for the largest trade volume this year, with
Russia trailing closely behind in the second spot, narrowing the gap with the United States gradually.
3. Trade Product Categories
From the index of the Eastern region (table 9), the product categories undergoing the biggest
change in positions this year are footwear & accessories, bridal gowns, watches, and jewelry.
Table 9: Eastern Region Major Trade Product Categories, By Volume & Growth, 2016
Rank Product Category 2015 2016 Change in Rank
1 Mobile Phones & Accessories 91.72 92.36 -
2 Fashion Apparel 53.84 69.86 ↑3
3 Health & Beauty 88.25 66.82 ↓1
4 Maternity & Baby Products 65.15 65.28 ↓1
5 Consumer Electronics 41.03 62.73 ↑3
6 Sports & Outdoor Products 59.31 60.12 ↓2
7 Household & Gardening 41.08 44.15 -
8 Hair Products 42.11 31.19 ↓2
9 Footwear & Accessories 24.13 26.82 ↑7
10 Bridal Gowns 21.18 26.52 ↑8
11 Computers & Networking 28.01 23.56 ↑1
12 Commercial & Industrial 33.55 23.12 ↓2
13 Fashion Accessories 26.94 22.86 ↑1
14 Watches 15.05 22.54 ↑8
15 Gaming Products 22.85 22.04 ↑2
16 Automobile, Motorcycles 21.04 21.06 ↑3
17 Digital Camera, Photography Equipment 29.71 19.57 ↓6
18 Jewelry 35.74 18.42 ↓9
19 Toys & Gifts 27.59 17.93 ↓6
20 Lighting 24.20 17.86 ↓5
21 Luggage, Bags & Accessories 20.90 17.25 ↓1
22 Musical Instruments 11.06 13.38 ↑1
23 Security & Surveillance 16.09 13.31 ↓2
With respect to specific products, the product sub-categories with the most robust growth in
2016 (Chart 4) for the Eastern region are fairly consistent with the overall national findings on
product growth. In addition, underwear and LED light-up toys are also performing well.
DHGATE.COM | TSINGHUA, NELECT | CUFE, CCIER 18Chart 4: Top 10 Product Sub-Categories, By Growth, Eastern Region
(b) Central Region
1. Trade Volume & Growth
The Central region is made up of 8 provincial level administrative regions in total, comprising
of Shanxi, Jilin, Heilongjiang, Anhui, Jiangxi, Henan, Hubei, and Hunan. The Central region
accounted for 5% of the total cross-border e-commerce export trade volume. With respect to growth,
Jiangxi province recorded a growth rate of 43%, while Hunan recorded a growth rate of 29%. And
in terms of trade volume, Henan and Jiangxi are the two best performing provinces in the Central
region. Henan’s trade volume weightage in the Central region remains unchanged in 2016, with India
being its fastest growing trade partner of the country that it exports to. Jiangxi’s fastest growing
export trade partners are Turkey, Poland and Israel respectively.
2. Trade Partners
From the composite index exhibiting the region’s top 5 export trade partner countries from each
continent (table 10), Russia has surpassed the United States to clinch the spot at the top of the table,
this is also due to the United States slight decline in performance compared to 2015.
Table 10: Central Region Export Composite Index, By Continent & By Country, 2016
2015 2016
North America
United States 82.48 82.07
Canada 70.22 63.28
Mexico 46.07 37.58
The Bahamas 14.57 27.76
Puerto Rico 34.78 25.03
South America
Paraguay 10.81 46.35
DHGATE.COM | TSINGHUA, NELECT | CUFE, CCIER 19Brazil 36.16 42.96
Colombia 26.74 34.63
Peru 24.92 32.32
Chile 34.79 29.60
Oceania
Australia 62.02 72.93
American Samoa 23.41 46.96
New Zealand 37.42 33.45
Independent State of Samoa 9.98 20.63
Republic of Kiribati 21.10 12.86
Africa
Republic of Cape Verde 22.59 79.56
South Africa 46.08 49.89
Nigeria 37.40 29.22
Republic of Botswana 26.78 25.96
Republic of Sierra Leone 10.04 21.69
Europe
Russia 81.87 82.18
United Kingdom 74.58 66.44
Italy 42.80 50.42
Spain 39.73 49.48
Sweden 40.19 49.37
Asia
India 61.05 52.19
Saudi Arabia 33.46 48.87
Singapore 34.90 42.95
Iran 15.94 42.51
Israel 25.22 38.86
3. Trade Product Categories
In the Central region’s trade product categories index (table 11), product categories that have
undergone relatively greater changes in position are footwear & accessories, gaming products, and
watches.
Table 11: Central Region Major Trade Product Categories, By Volume & Growth, 2016
Rank Product Category 2015 2016 Change in Rank
1 Footwear & Accessories 38.02 96.10 ↑ 9
2 Household & Gardening 89.17 82.53 ↓ 1
3 Sports & Outdoor Products 61.49 62.85 -
4 Health & Beauty 51.02 61.97 ↑ 2
5 Fashion Apparel 46.04 44.08 ↑ 2
6 Gaming Products 17.98 43.20 ↑ 17
7 Mobile Phones & Accessories 65.20 42.97 ↓ 3
DHGATE.COM | TSINGHUA, NELECT | CUFE, CCIER 208 Hair Products 42.21 38.42 ↓ 3
9 Consumer Electronics 71.62 36.04 ↓ 1
10 Watches 21.82 34.95 ↑ 11
11 Fashion Accessories 25.77 33.92 ↑ 4
12 Commercial & Industrial 20.12 28.01 ↓ 11
13 Computers & Networking 23.68 27.42 ↑ 3
14 Cars, Motorcycles 28.98 26.20 ↓ 3
15 Maternity & Baby Products 25.85 23.33 ↓ 3
16 Jewelry 37.22 23.23 ↓ 7
17 Luggage, Bags & Accessories 29.22 20.55 ↓ 4
18 Musical Instruments 19.64 19.92 ↑ 4
19 Bridal Gowns 21.20 16.22 ↓ 2
20 Toys & Gifts 75.42 15.64 ↓ 1
21 Lighting 24.60 14.91 ↓ 7
22 Security & Surveillance 20.23 14.90 ↓ 2
23 Digital Camera, Photography Equipment 23.75 10.28 ↓ 5
With respect to specific products, product sub-categories that have undergone robust growth in
2016 (Chart 5) for the Central region are household slippers, computer accessories, as well as art &
craft & gift products. Out of the top ten major product categories, two of them, namely slippers and
festive & party supplies, are also in the top ten growing product sub-categories.
Chart 5: Top 10 Product Sub-Categories, By Growth, Central Region
DHGATE.COM | TSINGHUA, NELECT | CUFE, CCIER 21(c) Western Region
1. Trade Volume & Growth
The Western region consists of 11 provincial level administrative areas including Sichuan,
Chongqing, Guizhou, Yunnan, Tibet, Shaanxi, Gansu, Qinghai, Ningxia, Xinjiang, Guangxi and
Inner Mongolia. The Western region accounted for 1% of the total cross-border e-commerce export
trade volume in 2016, constituting a relatively modest national market share presently. Sichuan and
Guangxi are the best performing provinces in the Western region with the highest cross-border e-
commerce trade volume, while Ningxia and Qinghai recorded the most rapid growth.
Chart 6: Western Region Cross-Border E-Commerce (Export B2B) Provinces Weightage, By Market Share
2. Trade Partners
Taking Guangxi as an example, its three major country of export are the United States, United
Kingdom and Germany, while their export trade volume with Indonesia and Germany has
experienced the most rapid growth.
In the Western region, the province that has recorded the fastest growth in the past year is
Ningxia. And with respect to primary country and region of export, export volume to Australia has
overtaken Canada, moving upwards to the number two spot, and at the same time, Australia is also
the country with the most rapid growth in the past year.
Table 12: Western Region Export Composite Index, By Continent & Top 5 Country
Region 2015 2016 Region 2015 2016
North America Africa
DHGATE.COM | TSINGHUA, NELECT | CUFE, CCIER 22United States 82.09 79.15 Morocco 30.75 35.49
Canada 72.28 63.58 South Africa 46.13 33.58
Mexico 48.36 40.22 Nigeria 36.61 27.83
Dominican Republic 21.05 35.69 Ivory Coast 9.97 27.17
El Salvador 11.84 32.01 Republic of Liberia 10.02 27.06
South America Europe
Brazil 39.2 54.76 United Kingdom 73.67 67.35
Colombia 26.08 48.22 Germany 46.61 66.17
Chile 35.31 45.94 Spain 42.58 63.52
Peru 32.89 42.22 Russia 39.88 56.75
Venezuela 14.65 34.27 Norway 29.77 55.17
Oceania Asia
Australia 66.31 67.84 India 59.86 75.29
New Zealand 35.33 41.49 United Arab Emirates 51.69 49.51
American Samoa 22.4 29.56 Indonesia 32.11 45.28
Kiribati 21.6 26.33 Turkey 35.83 44.45
Papua New Guinea 13.81 19.30 Saudi Arabia 34.78 43.60
From the composite index exhibiting the region’s top 5 export trade partner countries from each
continent, European countries (with the exception of United Kingdom) have undergone the most
significant improvements on the index. Lastly, United States and India are the top two countries with
the highest index scores.
3. Trade Product Categories
From the index of the Eastern region (table 13), the product categories undergoing the biggest
change in positions this year are bridal gowns, maternity & baby products and sports & outdoor
products. Export volume of jewelry products has been on the decline in 2016, resulting in its drop in
overall weightage.
Table 13: Western Region Major Trade Product Categories, By Volume & Growth, 2016
Rank Product Category 2015 2016 Change in Rank
1 Household & Gardening 93.28 93.51 ↑ 1
2 Computers & Networking 64.86 85.33 ↑ 1
3 Fashion Apparel 50.83 64.52 ↑ 1
4 Health & Beauty 46.22 51.65 ↑ 2
5 Sports & Outdoor Products 16.66 46.66 ↑ 18
6 Footwear & Accessories 34.68 37.82 ↑ 1
7 Mobile Phones & Accessories 27.31 35.86 ↑ 6
8 Watches 97.69 34.64 ↓ 7
9 Bridal Gowns 20.86 30.91 ↑ 10
10 Cars, Motorcycles 32.01 30.42 ↑ 1
DHGATE.COM | TSINGHUA, NELECT | CUFE, CCIER 2311 Maternity & Baby Products 19.86 28.07 ↑ 10
12 Consumer Electronics 46.76 27.65 ↓ 7
13 Fashion Accessories 24.80 25.59 ↑ 1
14 Commercial & Industrial 33.54 20.75 ↓ 4
15 Toys & Gifts 31.07 19.88 ↓ 3
16 Luggage, Bags & Accessories 34.10 18.19 ↓ 8
17 Jewelry 33.82 16.51 ↓ 8
18 Security & Surveillance 20.33 13.44 ↑ 2
19 Musical Instruments 24.14 12.64 ↓ 4
20 Digital Camera, Photography Equipment 22.29 11.85 ↓ 2
21 Lighting 23.00 11.34 ↓ 4
22 Hair Products 17.18 9.63 -
23 Gaming Products 23.00 9.32 ↓ 7
With respect to specific products’ growth rate in the Western region (chart 7), docks and stands
under the electronic products category, and massage products under the health & beauty product
category undergoing the most rapid growth. In addition, computer accessories, casual footwear, and
medical products are sub-categories with great potential for growth in the Western region.
Chart 7: Top 10 Product Sub-Categories, By Growth, Western Region
DHGATE.COM | TSINGHUA, NELECT | CUFE, CCIER 244. China Cross-Border E-Commerce Development
Trends & Outlook 2016
(a) The “Belt and Road” National Strategy: Constructing an Online Silk Road,
Leading Enterprises to “Make A Mark Globally”
Development Overview of Cross-Border E-Commerce Along the Belt & Road
The 18 provinces under the “Belt and Road policy initiative accounted for 78% of the total
national export B2B trade turnover, evidently they are key provinces for export trade activities. The
“Belt and Road” national strategy has developed extensively with far-reaching impacts, creating
massive opportunities and potential for enterprises to make a mark globally. It has also spurred the
growth of provinces benefiting under this policy initiative, bringing along substantial changes to the
growth index of various provinces in recent years, causing great changes to the positions on the index:
of which notably, Ningxia, Qinghai and Inner Mongolia has undergone massive development to
clinch the top 3 spots on the 2016 growth index.
Table 14: Growth in Trade Turnover, By Change in Rank, 2015-2016
Province Change in Rank Province Change in Rank
Ningxia ↑ 17 Fujian ↓ 2
Qinghai ↑ 15 Liaoning ↓ 1
Inner Mongolia ↑ 13 Guangxi ↓ 5
Gansu ↑ 7 Heilongjiang ↓ 4
Zhejiang ↑ 8 Chongqing ↓ 8
Shanghai ↑ 9 Jilin ↓ 10
Hainan ↓ 4 Yunnan ↓ 12
Shaanxi ↑ 6 Tibet ↓ 15
Guangdong ↑ 3 Xinjiang ↓ 17
Of the Chinese provinces under the “Belt and Road” policy initiative, the cross-border e-
commerce sector in the Central and Western region have the greatest potential for development. How
to best capitalize on the “Online Silk Road” strategy, and leverage on the platform’s strengths to
implement a digital trade strategy to facilitate on the transformation and modernization of local cross-
border trade activities, these are key issues that the local authorities, enterprises, and other relevant
industry players shall examine, brainstorm and strategize on together.
The “Belt and Road” Major Trade Partners Analysis
Central Asia, Russia, South Asia and South-East Asia are regions that the “Belt and Road”
policy initiative has pledged to prioritize; with the Middle Eastern and East African countries being
where the “Belt and Road” shall converge eventually, while trade cooperation with Europe,
DHGATE.COM | TSINGHUA, NELECT | CUFE, CCIER 25Commonwealth of Independent States and various African countries shall be implemented in the
long-run. Of the over 60 countries involved under the “Belt and Road” initiative, 26 of them has
experienced year-on-year growth in sales by 30% and above. Looking at trade volume, Russia
continues its leading positing, with a boost in growth rate as well. And finally, looking at growth,
Bhutan, Kyrgyzstan and Qatar are the top three fastest growing trade partners. The table below
presents overview on the cross-border e-commerce (B2B) performance of countries under the “Belt
and Road” initiative.
Table 15: China’s Cross-Border E-Commerce (Export B2B),
Major Trade Partners & Growth: “One Belt One Road” Countries, 2016
Rank Market size Market growth
1 Russia Bhutan
2 Israel Kyrgyzstan
3 Ukraine Qatar
4 Poland Oman
5 Turkey Republic of the Philippines
6 Czech Republic Pakistan
7 Saudi Arabia Bangladesh
8 Belarus Sri Lanka
9 Hungary Bahrain
10 Slovakia Republic of Serbia
11 Kazakhstan Vietnam
12 India Russia
13 Latvia Nepal
14 Lithuania Jordan
15 Bulgaria Montenegro
16 Romania Turkmenistan
17 Estonia Indonesia
18 Thailand Egypt
19 Singapore Tajikistan
20 Indonesia Cambodia
With respect to specific products’ growth rate in countries under the “Belt and Road” initiative,
virtual reality headsets, kitchen products, wearable devices and health & beauty product categories
have undergone the most rapid growth (see Chart 8).
DHGATE.COM | TSINGHUA, NELECT | CUFE, CCIER 26Chart 8: Top 10 Product Sub-Categories, By Growth, One Belt One Road Trade Partner Nations
(b) Outstanding Development Potential of the ASEAN Market
The ASEAN region is comprised of ten countries, including Indonesia, Malaysia, the
Philippines, Singapore, Thailand, Brunei, Vietnam, Laos, Myanmar and Cambodia. The Philippines
and Vietnam are the two fastest growing countries as China’s cross-border e-commerce export
partners this year. The chart below illustrates the top 5 ranking ASEAN countries with the most
significant growth in trade volume. Thailand’s growth in the past year has been sluggish, while
Malaysia’s year-on-year trade volume has declined from 2015.
Chart 9: China’s Cross-Border E-Commerce (Export B2B), Trade Partners’ Growth (ASEAN Region), 2016
Table 16: Composite Index of Cross-Border E-Commerce Export, ASEAN Nations
2015 2016
Indonesia 31.22 36.94
Singapore 24.18 29.28
Philippines 23.99 28.93
Thailand 39.36 25.26
Vietnam 22.42 22.46
Malaysia 30.96 20.62
Cambodia 22.19 19.89
Brunei 18.35 19.54
Myanmar 20.02 14.55
Laos 16.90 13.85
DHGATE.COM | TSINGHUA, NELECT | CUFE, CCIER 27Chart 10: China Cross-Border E-Commerce (Export B2B)
Trade Product Categories, By Growth, ASEAN Region
From the trade product categories exported, consumer electronics (computing,
communication, and consumer) products accounted for the highest weightage of 29%, followed by
health & beauty and fashion accessories products. Fashion accessories registered the highest
growth this year, while luggage & bags, watches, and health & beauty products all recorded year-
on-year growth of over 80%.
DHGATE.COM | TSINGHUA, NELECT | CUFE, CCIER 28(c) Support for Product Branding, Putting “Chinese Brands” on the Map
Since the reform and opening of China’s economy, foreign trade has been one of the three major
pillars in fostering the national economy. It has continually sustained growth higher than the growth
of China’s GDP, and is one of the major drivers in the rapid development of the Chinese economy.
Historically, Chinese foreign trade enterprises have been relying on the low cost of labor, raw
materials and resources to provide competitive pricing and competitive advantage – essentially
positioning itself as the “factory of the world.” However, as the cost of labor is rising and as resources
are gradually depleting, “Made in China” is currently on the brink of transitioning. The China
economy has a critical need to move upwards from the manufacturing industry value chain, and to
disassociate itself from the “low cost, cheap quality” label, to transition into providing value-added
products with branding. It has shifted from “exporting economical products” to “establishing
valuable Chinese brands”, and gradually eliminate products that are low in quality or counterfeits,
and reposition itself as provider of high quality, branded products to attract and retain customers, and
to sustain a high market share.
Through this process, cross-border e-commerce can certainly provide a diversity of options and
channels to promote Chinese brands to consumers globally. Through the synergy effect of platforms
established for the trading of goods and services, reducing the overdependence on the middlemen in
conventional wholesale business models, to consequently reduce on the need for large amount of
capital and liquidity for enterprises, and maximize on operational efficiencies to the greatest extent.
Current statistics on e-commerce B2B export indicates that since 2015, export weightage of Chinese
brands have been surging, and it is forecasted that the rapid development will continue in the coming
few years. To revitalize the significance behind the “Made in China” label, and to firmly establish
Chinese brands on the world map are what Chinese manufacturers and foreign trade enterprises shall
continually strive for in the coming days.
DHGATE.COM | TSINGHUA, NELECT | CUFE, CCIER 2935%
32%
30% 30%
25%
23%
20%
19%
15%
12% 12%
10% 10%
9%
5%
0%
2011 2012 2013 2014 2015 2016 2017 E 2018 E
Chart 11: Sales Weightage of Branded Items in China’s Cross-Border E-Commerce, 2011-2018
(d) Nurturing of Local Industry Clusters, Connecting to Global Merchants
Each city shall anchor itself with its key industries and unique products, tapping on their local
expertise as the core driver of economic development. The key trait of local industry clusters is a
complete industry value chain, where raw materials are sourced, processed, manufactured locally,
while product marketing and logistics are also completed within the area. This generates momentum
and gives more focus for industry players to provide the market with quality products at the most
competitive pricing, right at the primary source. In the past two years, as Chinese internet industries
proliferate and as the digital economy undergoes rapid development, many industries are realizing
the shortcomings and inadequacies of traditional offline commerce business models, and have begun
developing their presence on online e-commerce platforms, utilizing cross-border e-commerce
platforms to promote their products to the vast overseas market, with a growing awareness and
emphasis on brand identity. This phenomenon brings two major benefits: firstly, to promote and
strengthen the development of local industry clusters, and secondly, to act as a catalyst for local
industries to develop and launch branded products. Export statistics from this report substantiates
this development trend and attribute.
Taking Suzhou for instance, the B2B export e-commerce trade data for 2016 indicates that bridal
gown products accounted for the highest weightage of Suzhou’s overall e-commerce exports at 68%,
followed by household products. Bridal gowns are almost synonymous with foreign trade in Suzhou
exports, with the bridal industry forming its own massive trade sector independently, catering to the
broadest segments of the market with the latest fashion trends at the most competitive pricing. From
branded bridal gowns to independent boutique designers, from exclusive tailor-made items to ready-
DHGATE.COM | TSINGHUA, NELECT | CUFE, CCIER 30to-wear products, and in addition to bringing in renowned global brands, Suzhou has transformed the
traditional business model in the bridal industry into a value chain comprised of the trifecta of
professional standards, quality, and branding.
There are plenty of similar cases to Suzhou, with the local industry expertise bringing dynamic
growth in the area’s cross-border e-commerce. For instance, Fujian’s export e-commerce has a robust
presence in sports shoes products, accounting for 90% of its exports. Meanwhile, in Xuchang city,
which specializes in hair products, massive growth has been recorded, with trade turnover surging
by 93%, with the market share increasing from 90% to 94%. Other areas with industry clusters
include: printers and consumables in Zhuhai, stainless steel products in Chaoshan, furniture in
Foshan, luggage and bags in Guangzhou, toys in Chenghai, children’s clothing in Zhili, and so on.
These cities are focusing on establishing an entire value chain dedicated to products unique to their
locality and corresponding to their expertise.
Chart 12: Cross-Border E-Commerce Regional Product Distribution, 2016
(e) B2B as Key Driver, E-Commerce’s Transition from B2C to B2C
From export B2B statistics (chart 13), it is evident that the growth rate of large volume orders
far surpasses the growth in the quantity of overall orders. The trend of engaging in larger orders for
e-commerce, pursuing commercial clients shall become increasingly salient.
DHGATE.COM | TSINGHUA, NELECT | CUFE, CCIER 31Chart 13: China Cross-Border E-Commerce B2B, Growth of Orders, 2016
How products from Chinese brands can be launched to the global market more rapidly and
consistently, how to add value for Chinese foreign trade enterprises and bridging them to more
resources, how to revitalize industries unique to a locality through clustering – these are all intricately
linked to the development and reform of cross-border e-commerce business models. They also
converge to further advance the development of the overall cross-border e-commerce sector.
Along with the impacts of supply-side reform policies nationally, and as industries transform
and modernize, there will be an increasing number of traditional enterprises embracing internet
technologies to dive deeper into the foray of digital trade activities; e-commerce is shifting from
targeting consumers to targeting industry players, and progressing from purely cross-border e-
commerce activities to conducting transactions completely via digital trade. In the future, purely e-
commerce enterprises and purely offline business entities will cease to exist, remaining foreign trade
businesses will adopt a highly-integrative online-and-offline business model. At the same time, as
transitions from B2C to B2B continues, trade transactions will be digitized and conducted online,
with service platforms catering to such functions being the development trend in the near future. In
the next 5-10 years, traditional enterprises will shift rapidly to online, while internet-based business
entities will continually make their presence felt offline. The market will no longer emphasize
whether the enterprise is online or offline, as the boundary will be blurred. Such far-reaching
integration shall permeate across all industries, with the successful adopters emerging as the business
leader in their field, along with the restructuring of the industry’s ecosystem. Under the “integration
and conducting large commercial transactions via online platform” strategy, the entire industry value
DHGATE.COM | TSINGHUA, NELECT | CUFE, CCIER 32chain and periphery services along the chain shall be restructured; the shift to online platforms shall
connect with the relevant government authorities through a uniform channel, offering one-stop export
services for businesses, and offering them cost savings and increased efficiency. Using the digital
trade platform as its core, the value chain upstream and downstream shall integrate all relevant actors
from merchants, customs offices, service providers, government authorities, financial organizations,
industry clusters, buyers, overseas channels, industry associations, forming a brand new massive
digital trade ecosystem with the ability to develop to an even broader horizon.
(f) The Dawn of the Digital Trade Era
1. The Definition of Digital Trade
Digital trade is the crux of the digital economy, it is the evolution and development of cross-
border e-commerce. Digital trade is comprised of not only the trade transactions for goods through
e-commerce, it also encompasses comprehensive services pertinent to the delivery of goods, such as
marketing, payment, logistics, supply chain financing, customs clearance, goods inspection, tax
refunds, settlements of exchange, as well as all other services along the industry value chain. The
“Digital Globalization: The New Era of Global Flows” report published by McKinsey in 2016 stated
that approximately 12% of the global goods trade is conducted via e-commerce, with 50% of cross-
border services trade facilitated by digital means.
Four Key Traits of Digital Trade
Trade of both tangible goods and virtual economy; integrates online and offline
Synergy in the development of both goods and services trading platforms
Multilateral strategy and cooperation between various countries
Enhances the trading ecosystem, solves various issues of traditional trading business
models via a one-stop solution
2. The Interconnectedness of Digital Trade & the Online Silk Road
Under the Chinese “Belt and Road” policy initiative, the “online silk road” is declared as one of
the innovative strategy approach, hence by allowing the countries involved in the initiative to
leverage on the establishment of digital trade instruments, is an important step in accomplishing an
enhanced trade flow.
DHGATE.COM | TSINGHUA, NELECT | CUFE, CCIER 33You can also read