Chart-Watchers January 2020 - Euphoria Phase Kicks In - Edelweiss
←
→
Page content transcription
If your browser does not render page correctly, please read the page content below

Chart-Watchers January 2020
                               Euphoria Phase Kicks In

                                             Currency              Bond

                                         Commodity                  Equity

Sagar Doshi                      Ankit Narshana                    Abhishek Chinchalkar
Research Analyst                 Research Analyst                  Research Analyst
91 (22) 4088 5757 Ext.6226       +91 (22) 4040 7596                +91 (22) 6141 2725
Sagar.doshi@edelweissfin.com     ankit.narshana@edelweissfin.com   abhishek.chinchalkar@edelweissfin.com
                                                                                                           Date: 9th January 2020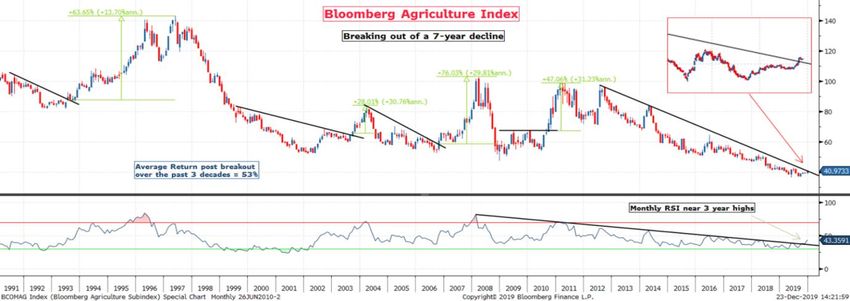
Edelweiss Professional Investor Research
ChartWatchers – “Part 2: Euphoria Phase Kicks in”
Sagar Doshi
Research Analyst Part 1: Beginning of the Final Crest before the Tide Changes (September 2019)
91 (22) 4088 5757 Ext.6226 Part 2: Euphoria Phase Kicks in (January 2020)
Sagar.doshi@edelweissfin.com
Part 3: Final Call (April 2020)
Ankit Narshana
Research Analyst
In our previous ChartWatchers, we had shown why global markets rally between the time
+91 (22) 4040 7596 US yield curve inverts and recession begins. Based on this, we had highlighted that world
Ankit.narshana@edelweissfin.com markets could rally until 1HCY20.
Abhishek Chinchalkar In line with our expectations, global markets have rallied sharply since 4QCY19. In fact, all
Research Analyst
+91 (22) 6141 2725 the 4 asset classes including bonds, currency, commodity and equity have started moving
Abhishek.chinchalkar@edelweissfin.com higher.
All asset classes moving higher is a classic sign of Euphoria, which we believe will
continue in 1HCY20.
The US yield curve has now shifted from inversion to steepening. Looking at the history,
when an inversion is soon followed by steepening, it is not a good sign as it is usually
followed by a recession.
Based on our analysis of the historic yield curve and the subsequent recessions, we still
foresee the possibility of the US economy falling into a recession in 2HCY20.
Our time cycle analysis and central bank policy actions indicate that EMs are likely to
outperform DMs in the coming few months, which is a typical characteristic of a mature
bull market.
Commodities have been underperforming equities for decades. In fact, the ratio of
commodities to equities is at a record low. With the dollar showing signs of softening as
central banks turn increasingly accommodative, we expect commodities to be nearing
the end of their bear cycle.
As we are in the euphoric cycle, our analysis suggests that midcaps in India will outperform
large cap by minimum 25%.
Looking forward, we expect Nifty to extend gains in 1HCY20. We foresee the index
rallying towards 13500 mark and as such, recommend creating longs above 12250, while
keeping a stop loss of 11800.
Sectors which we like are Metal, Cement, Pharma, and Midcap.
FOCUS STOCKS FOR TRADING:
Long ideas – Ramco Cement, Vedanta, Bharat Forge
Short ideas – Titan
1 Edelweiss Professional Investor Research – Trading Desk
Date: 1st August , 2017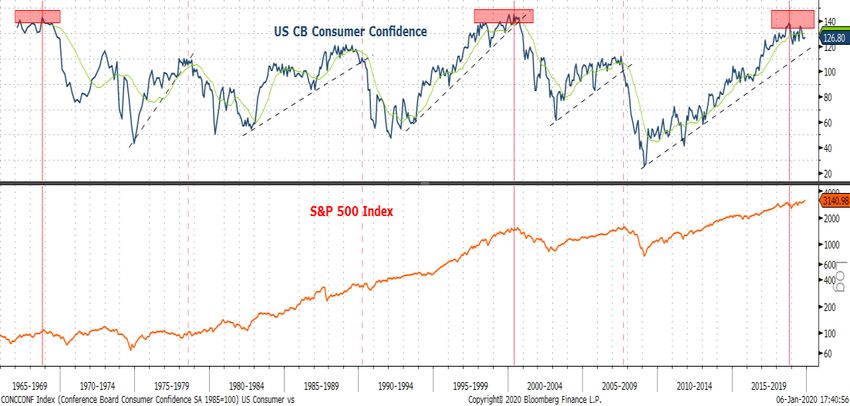
EUPHORIA PHASE KICKS IN AS ALL ASSET CLASSES RALLY

Equities, commodities,
bonds, and currencies
have all started to rally,
indicating we have
entered 3rd phase of
business cycle, which is
the euphoria phase

                                                                                Source: Bloomberg, Edelweiss Professional Investor Research

                              The above is an equal-weighted chart of all the four asset classes (equity, commodity, bond, and
                              currency) from a global perspective. It can be seen that this index has given a breakout, indicating
                              that the market is now entering a euphoria phase. On the previous occasions as well, during 2000
                              and 2008, the index had entered similar euphoria phase before falling steeply a few months
                              down the line. The charts below show the performance of these individual asset classes.

Individual charts of the
asset classes, each showing
bullish breakouts

                                                                                Source: Bloomberg, Edelweiss Professional Investor Research

     2                                                                      Edelweiss Professional Investor Research – Trading Desk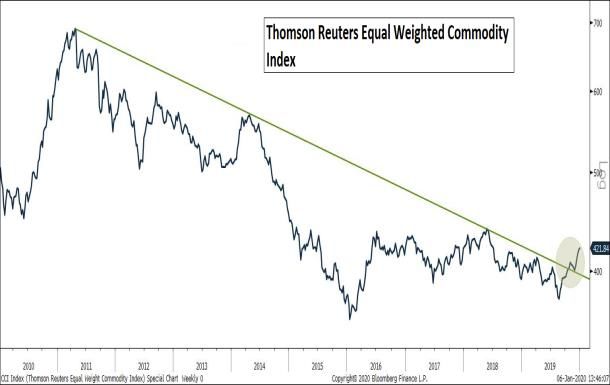
Notice from the above charts that each of these indices has started moving higher
                             simultaneously, an indication that we are now entering the Euphoria phase. In the coming
                             sections, we will talk about factors that have contributed to such euphoria as well as state our
                             view as to why the current up trend is likely to extend for the next 5-6 months, before an
                             eventual peak in the market.

                                         WORLD MARKETS SURGE AS GLOBAL RATE CYCLE TURNS SOUTH
                                               Fed begins cutting rates for the first time in nearly a decade

Fed Balance Sheet
expansion and interest
rate cut lift S&P 500 to a
record high

                                                                              Source: Bloomberg, Edelweiss Professional Investor Research

                             Over the course of 2019, not only did the Fed cut rates thrice but it also started expanding its
                             balance sheet for the first time in over 5 years. This combination of rate cuts and balance sheet
                             expansion has caused the S&P 500 index to rise to historic highs, while also breaking above a
                             trend line resistance, signaling at gains in the coming weeks. Increased liquidity because of the
                             Fed’s actions should offer equities support in the weeks ahead.

                                         ECB continues its ultra-accommodative stance as growth remains fragile

Euro Stoxx index breaks
20-year secular
resistance line, boosted
by an accommodative
ECB stance

                                                                              Source: Bloomberg, Edelweiss Professional Investor Research

     3                                                                    Edelweiss Professional Investor Research – Trading Desk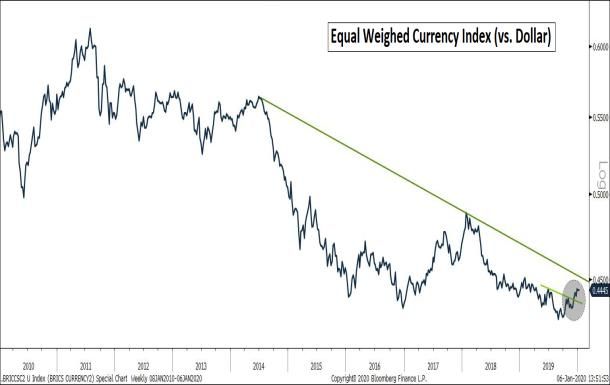
While the ECB has been on a pause mode as far as rates are concerned, it has nevertheless been
                          expanding its balance sheet. With inflation and growth expected to remain subdued in the
                          coming months, the ECB is likely to maintain its accommodative stance and continue the ongoing
                          €20b monthly bond purchases for the foreseeable future. Given this and considering that
                          Europe’s headline markets have given a long-term breakout, we expect European equities to
                          maintain bullish momentum in the weeks ahead.

                                       BOJ too remains accommodative amidst struggling Japanese economy

Nikkei 225 continues to
gain upside momentum,
partly underpinned by
BoJ’s liquidity push

                                                                            Source: Bloomberg, Edelweiss Professional Investor Research

                          Not only the Fed and the ECB but even the BOJ has been expanding its balance sheet at an
                          unprecedented pace over the years to revive growth and inflation in Japan. This has now been
                          accompanied by a breakout in the Japanese markets. Accommodative monetary policy of the BOJ
                          along with the possibility of government spending in 2020 to partially mitigate the impact of sales
                          tax hikes is likely to keep the Japanese markets supported in the coming weeks.

    4                                                                   Edelweiss Professional Investor Research – Trading Desk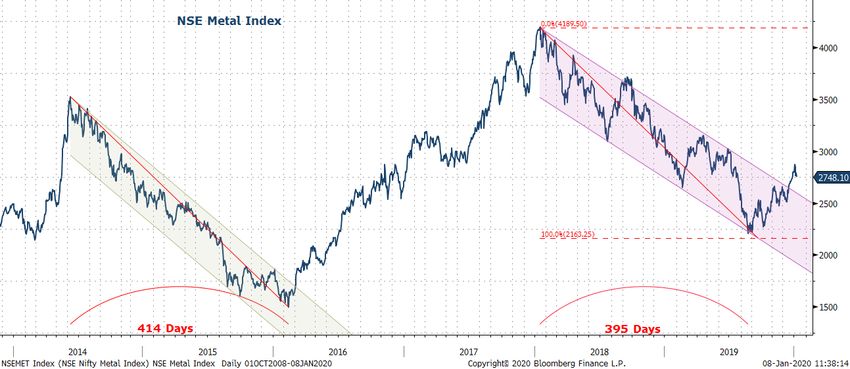
Central banks around the world turning more dovish
                               Country      Policy Rate   3m Chg (BPS)   6m Chg (BPS)    12m Chg (BPS)      Interest Rate Trend (12m)
                              Argentina      52.00%          -1500          -1500            -800                      Cut
                               Australia      0.75%            -25            -75             -75                      Cut
                               Bahrain        4.00%            -25            -50             -25                      Cut
                                 Brazil       5.00%           -150           -150            -150                      Cut
                                  Chile       1.75%            -75           -125            -100                      Cut
                              Czech Rep.      2.00%             0              0               25                     Neutral
                                 Egypt       14.25%           -250           -250            -350                      Cut
                              Hong Kong       2.26%            -24            -49             -24                      Cut
                                Iceland       3.00%            -75           -150            -125                      Cut
Central banks continue to         India       5.15%            -60            -85            -135                      Cut
be in an accommodative        Indonesia       5.00%            -75           -100             -75                      Cut
stance, boosting global          Israel       0.25%             0              0               15                     Neutral
liquidity                      Malaysia       3.00%             0              0              -25                     Neutral
                                Mexico        7.50%            -50            -75             -50                      Cut
                             New Zealand      1.00%             0             -50             -75                      Cut
                               Norway         1.50%            25             50               75                      Hike
                                 Oman         2.22%          -44.5          -71.6            -57.7                     Cut
                               Pakistan      13.75%           250            325              575                      Hike
                                  Peru        2.25%            -25            -50             -50                      Cut
                              Philippines     4.00%            -25            -50             -50                      Cut
                                 Qatar        2.00%            -50            -50             -50                      Cut
                                 Russia       6.50%           -100           -125            -100                      Cut
                             Saudi Arabia     2.25%            -50            -75             -50                      Cut
                              Singapore       0.08%             5              4                5                      Hike
                             South Africa     6.50%             0             -25               0                     Neutral
                             South Korea      1.25%            -50            -50             -25                      Cut
                               Sweden         -0.25%            0              0               25                     Neutral
                               Thailand       1.25%            -50            -50             -25                      Cut
                                Turkey       14.00%          -1000          -1000           -1000                      Cut
                                 U.A.E.       2.00%            -50            -75             -50                      Cut
                               Ukraine       15.50%           -150           -200            -250                      Cut
                                   U.S.       1.75%            -50            -75             -50                      Cut
                              Venezuela      20.12%           -338            -66             -93                      Cut

                                                                                 Source: Bloomberg, Edelweiss Professional Investor Research

                            2019 has been a year that has been characterized by most global central banks easing their
                            monetary policies. The primary objective was to revive growth and, more importantly, to prevent
                            the adverse impact of global trade uncertainties. Notice in the table above that the number of
                            red bars (rate cuts) clearly outweighs the number of green bars (rate hikes). This trend is likely to
                            continue in the foreseeable future, which we expect to underpin risk assets, primarily equities.

    5                                                                       Edelweiss Professional Investor Research – Trading Desk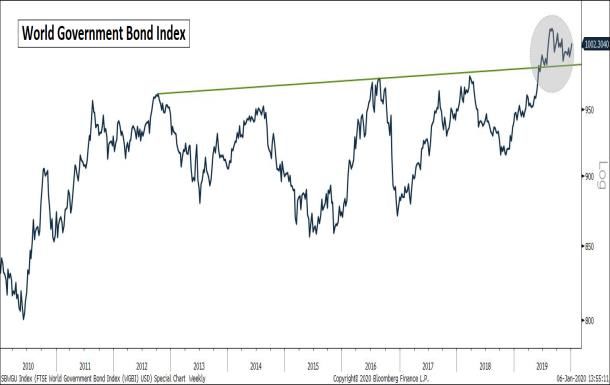
Fed Balance Sheet expansion and US, world market capitalization are closely linked

Expansion in Fed B/s is
leading to an expansion in
US & World market
capitalization as well

                                                                              Source: Bloomberg, Edelweiss Professional Investor Research

                             Note above that the Fed B/s expansion and the US/world market capitalization are closely linked.
                             Observe that the 135% Fed B/s expansion from 2009 to 2014 was accompanied by the US and
                             world market cap increasing by a similar percentage during this period. Now, a 10+% increase in
                             the Fed’s B/s in 2019 has again caused market cap to gain 10+%. This chart highlights that
                             liquidity has played a key role in driving US markets higher. We expect the current rally to
                             continue for as long as the Fed’s expansionary policies remain in place. Once this support from
                             the Fed ends, the US markets are likely to attract selling pressure.

                                          Despite the recent yield curve steepening, recession risks still prevail

    6                                                                     Edelweiss Professional Investor Research – Trading Desk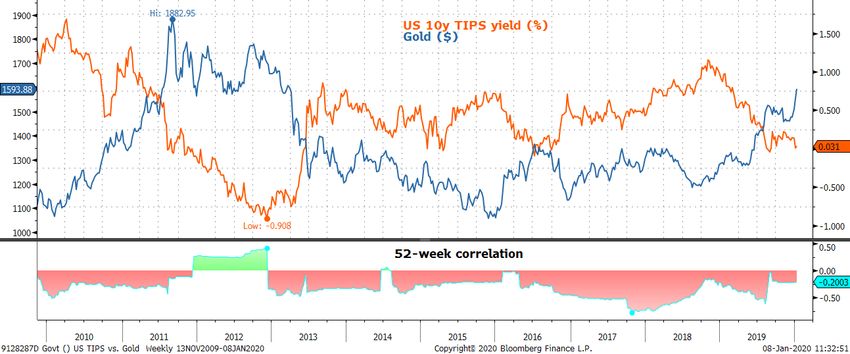
Looking at history, the
odds of US slipping into
recession in 2H20 still
prevail

                                                                                Source: Bloomberg, Edelweiss Professional Investor Research

                              After having inverted in the 3QCY19, the US yield curve has since steepened quite a bit. History
                              shows that the prior three recessions of 1990, 2000, and 2008 were each preceded by a yield
                              curve inversion. On each of these occasions, the inversions were then followed by a steepening of
                              the yield curve before the onset of a recession. This indicates that despite the recent steepening,
                              the US remains in risk of slipping into a recession in 2HCY20, as indicated by the table above.

                                            Consumer confidence at an extreme, indicating euphoric behaviour

Consumer confidence at a
peak level, indicating that
we are at the euphoria
phase

                                                                                Source: Bloomberg, Edelweiss Professional Investor Research

                              The above chart compares consumer confidence (top) with S&P 500 index (bottom). Notice the
                              solid and dashed red vertical lines. It can be seen that a peak in consumer confidence and a
                              subsequent decline below its moving average has usually coincided with a peak in the S&P 500
                              index as well. The rectangular boxes show regions wherein after an initial blip, the index made a
                              second high before eventually going lower. A similar kind of setup seems to be forming now.

     7                                                                      Edelweiss Professional Investor Research – Trading Desk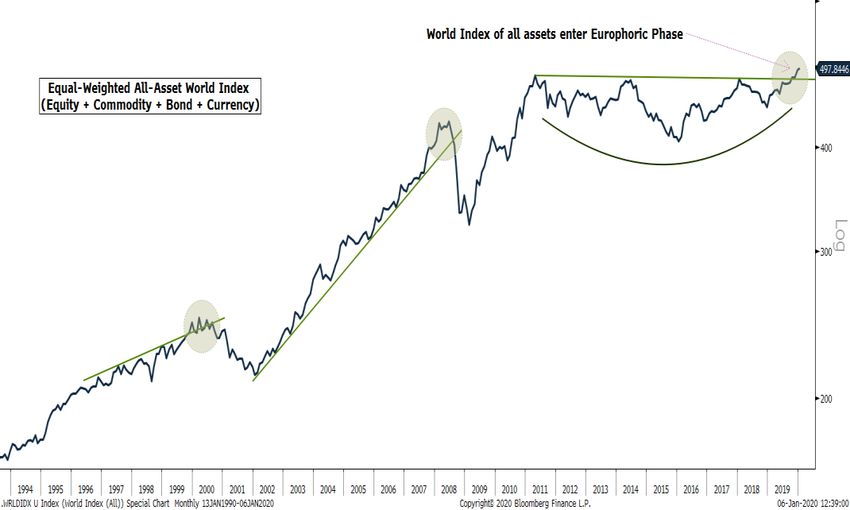
RALLY IN THE US MARKETS LED BY MIDCAPS
                                         US markets surge when Fed cuts rate well ahead of the start of recession

Fed rate cuts well ahead of
the onset of a recession
benefits US equities

                                                                                Source: Bloomberg, Edelweiss Professional Investor Research

                              Since the 1980s, there have been five occasions in which the Fed has cut its rates thrice i.e.
                              without any hikes in between. During this time period, we have seen that if the Fed cuts its policy
                              rates as a precaution against recession, the US markets rally sharply in the weeks ahead.
                              However, cuts to fight an ongoing recession don’t have any positive impact on US markets. If
                              history is to go by, then the current round of rate cuts by the Fed as a precaution against
                              recession should bode well for the US markets in the weeks ahead.

                                               During Fed cuts, US midcaps outperform as the dollar softens

Fed rate cut, if also
accompanied by dollar
softness, bolsters midcaps
over large caps

                                                                                Source: Bloomberg, Edelweiss Professional Investor Research

                              Since 1990s, there have been three major rate cut cycles that the Fed has undertaken.
                              Historically, we have seen that there exists a negative correlation between DXY and Russell 2000
                              (US midcap proxy) to S&P 500 (US large cap proxy) ratio. In other words, this ratio underperforms
                              when the Dollar is strengthening, and vice versa. With the DXY starting to show signs of cracks,
                              midcaps could start outperforming large caps in the days to come.

    8                                                                       Edelweiss Professional Investor Research – Trading Desk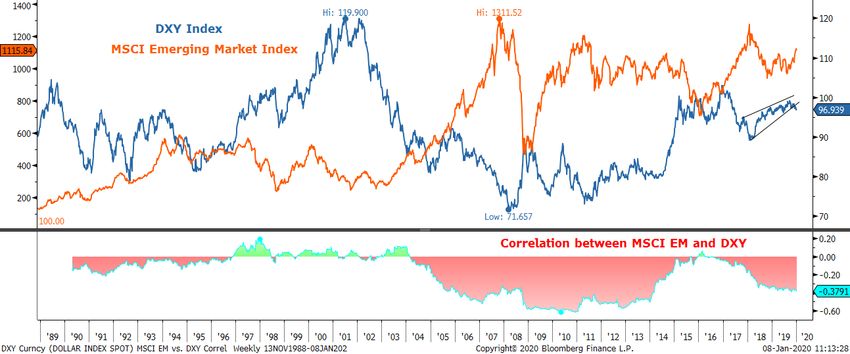
Steepening US yield curve underpins Midcaps over Large caps

A steepening yield curve
following an inversion
leads to broader market
participation

                                                                                  Source: Bloomberg, Edelweiss Professional Investor Research

                               The US yield curve (measured by the difference between the 10-year and the 3-month US yield)
                               recently steepened after having inverted for a brief period of time. Historically, we have seen that
                               on the past three occasions, whenever this spread has steepened after having inverted, it has led
                               to strong rally in midcaps relative to large caps. The recent steeping of the curve following a brief
                               inversion suggests that midcaps could start outperforming large caps over the next few weeks.

                                                Diverging breadth indicates market could be in last leg of rally

The up move in US
markets over the last
couple of years has been
accompanied by
weakening breadth,
indicating we might be in
the final leg of bull market

                                                                                  Source: Bloomberg, Edelweiss Professional Investor Research

                               The above chart compares S&P 500 index with its breadth, measured as the number of stocks
                               trading above the 200dma. It can be seen that major tops in the index in 2000 and 2007 were
                               accompanied by bearish divergences with breadth, suggesting that the final leg of rally in SPX was
                               driven by fewer number of stocks. Even in 2015, a divergence formed between the two, but the
                               correction then was moderate and not severe. Now, a major divergence has formed again, with
                               the S&P 500 scaling new highs but with fewer stocks joining in the rally. This suggests that the
                               current bull market could be in final stages of the up move.

     9                                                                        Edelweiss Professional Investor Research – Trading Desk
EMs THE KEY BENEFICIARIES OF AN ACCOMODATIVE FED
With the Fed turning accommodative, expect Emerging markets to strengthen
Time cycle analysis
suggests EMs could rally
for a few more months,
before eventually topping
out
Source: Bloomberg, Edelweiss Professional Investor Research
Emerging markets, as measured by the MSCI EM index, have exhibited three major trends since
the turn of the century: a rally from 2004 to 2008, a consolidation from 2009 to 2015, and then a
rally from 2016 till date. The current up move that started in 2016 has been 200 weeks old, as
compared with the prior rally that lasted for 227 weeks. If time cycle is to repeat, then we are
likely to see an EM rally continuing in 1HCY20, before potentially topping out.
Since 2004, EMs have had a strong negative correlation with the Dollar
Given the strong negative
correlation between EMs
and the dollar, a softening
DXY is likely to offer a
strong boost to EMs
Source: Bloomberg, Edelweiss Professional Investor Research
The above chart can be split into two parts: before 2004 and after 2004. We can see that post
2004, the MSCI EM index has shared a very strong negative correlation with the DXY. This
correlation turned positive only once, but that was negligible as it was for a very brief period of
time. Since this brief hiatus, the negative correlation has started strengthening again. The DXY
has recently broken below a rising wedge pattern, signaling at weakness in the days to come.
This, we believe, will bode well for the MSCI EM index, moving forward.
10 Edelweiss Professional Investor Research – Trading DeskA weak Dollar leads to capital moving out of the US into other nations
A weakening dollar would
benefit world markets
more than it would benefit
the US markets
Source: Bloomberg, Edelweiss Professional Investor Research
The above chart compares the DXY index with the MSCI ACWI to ACWI ex US ratio. The ACWI
stands for All Country World Index. A rising ratio means ACWI is outperforming ACWI ex US, and
vice versa. Notice the correlation between DXY and this ratio. A strengthening dollar leads to
greater inflows into the US, causing ACWI index (the numerator) to outperform ACWI index ex US
(the denominator), and vice versa. Ahead, with the Fed expected to remain accommodative in
the foreseeable future, the DXY looks set to weaken, which in turn should cause capital to move
out of the US and into other nations, such as EMs.
EMs to DMs ratio chart shows EMs at attractive levels
EMs to DMs ratio is at a 15-
year low, indicating EMs
are quite cheap relative to
DMs at present
Source: Bloomberg, Edelweiss Professional Investor Research
During periods of expansionary Fed policy, there is a tendency for emerging markets (EMs) to
outperform developed markets (DMs). Similarly, during periods of contractionary Fed policy, the
opposite occurs (2004 to 2007 was an exception though, as the China growth story offered a
massive support to EMs despite tight Fed policy). It can be observed that EMs have been
underperforming DMs for the past decade. However, with the Fed turning from tightening mode
to easing mode, we believe that the EM underperformance could be in its final stages, before the
tide changes.
11 Edelweiss Professional Investor Research – Trading DeskGLOBAL RISK APPETITE, TAX CUTS UNLEASH RALLY IN INDIAN MIDCAPS & SMALLCAPS
NSE Midcap to Nifty ratio suggests we are entering Phase 5, the euphoria phase
NSE Midcap to Nifty ratio
enters into Phase 5, the
euphoria phase
Source: Bloomberg, Edelweiss Professional Investor Research
The above chart is the ratio chart of Nifty Midcap index to Nifty index. We have split this chart
into two phases: first is from 2001 to 2008 and second is from 2009 till date. We have seen that in
each of the phase, the ratio has moved in 5 sub phases. Sub phase 1 and 3 are the strongest for
the midcaps, while sub wave 5 indicates euphoria, a stage when midcaps outperform large caps
very swiftly. Meanwhile, sub phases 2 and 4 indicate midcaps underperforming large caps.
Currently, we seem to have ended sub phase 4 within phase (II). If history were to repeat, we
could now enter sub phase 5, wherein midcaps outperform large caps swiftly.
NSE Midcap stocks at very attractive levels relative to US Midcaps
Indian midcaps at a much
attractive levels relative to
US midcaps
Source: Bloomberg, Edelweiss Professional Investor Research
The above chart is the ratio chart comparing Indian midcaps with US midcaps. This ratio has been
in an uptrend since 2004, but has recently broken its 15-year trendline. However, the break has
not been accompanied by continued selling, as the ratio has been consolidating near the trend
line for quite some time now. This has also been accompanied by the RSI forming a bullish
divergence with price. If the ratio manages to move back above the trend line, it would signal that
Indian midcaps could start outperforming US midcaps in the weeks to come.
12 Edelweiss Professional Investor Research – Trading DeskCompared to the global markets, Indian markets have more room for an up move
Index Country % components above 20dma Index Country % components above 50dma
CAC 40 INDEX France 60 CAC 40 INDEX France 70
DAX INDEX Germany 60 DAX INDEX Germany 63
FTSE 100 INDEX UK 69 FTSE 100 INDEX UK 74
HANG SENG INDEX Hong Kong 94 HANG SENG INDEX Hong Kong 76
KOSPI INDEX S Korea 56 KOSPI INDEX S Korea 45
Nifty 50 India 56 Nifty 50 India 52
Nifty 500 India 43 Nifty 500 India 50
NIKKEI 225 Japan 85 NIKKEI 225 Japan 83
S&P 500 INDEX US 68 S&P 500 INDEX US 73
Given last year’s SHANGHAI SE COMPOSITE China 76 SHANGHAI SE COMPOSITE China 43
underperformance, Indian Index Country % components above 100dma Index Country % components above 200dma
markets have more upside CAC 40 INDEX France 75 CAC 40 INDEX France 80
DAX INDEX Germany 77 DAX INDEX Germany 80
room than global markets FTSE 100 INDEX UK 70 FTSE 100 INDEX UK 74
HANG SENG INDEX Hong Kong 74 HANG SENG INDEX Hong Kong 50
KOSPI INDEX S Korea 45 KOSPI INDEX S Korea 28
Nifty 50 India 62 Nifty 50 India 54
Nifty 500 India 56 Nifty 500 India 45
NIKKEI 225 Japan 91 NIKKEI 225 Japan 81
S&P 500 INDEX US 73 S&P 500 INDEX US 78
SHANGHAI SE COMPOSITE China 38 SHANGHAI SE COMPOSITE China 29
Source: Bloomberg, Edelweiss Professional Investor Research
The four tables above compare the breadth of some of the major global indices. The breadth
indicator used here is simple moving average, namely the 20dma, 50dma, 100dma, and 200dma.
The red vertical dotted line stands for the average of the number of constituents above a specific
SMA. It can be seen here that the breadth of the Indian markets is below this average in all four
cases, suggesting that the Indian markets have more room for an up move in the coming weeks
than do the global markets.
Nifty seems headed towards 13000-14000 zone in the next few months
Subwave V of Wave 3 is in
progress, which suggests at
Nifty upside extending
towards 13000-14000
Source: Bloomberg, Edelweiss Professional Investor Research
The long-term chart of Nifty suggests that we are in wave 5 of larger degree wave III. As per our
Elliott Wave count, wave 5 should ideally complete between 13000 and 14000. Post the
completion of wave III, we could see one year of correction in the index.
13 Edelweiss Professional Investor Research – Trading DeskWave 5 in NSE 500 index potentially underway
NSE 500 is in Wave 5 of an
impulse pattern, which
could take the index
towards 12000
Source: Bloomberg, Edelweiss Professional Investor Research
The NSE 500 index seems to have entered Wave 5 of the impulsive Elliott pattern. This would be
further validated once the index sustains above 9920 level. As per the Wave theory, Wave 5 is the
euphoric phase, wherein the index rallies sharply in a relatively short time span with broad
market participation. As per the price projection, we could see the index rallying towards 12000,
a region where a potential top could be made.
COMMODITIES BULL MARKET COULD RESUME AS THE DOLLAR SOFTENS
Commodities to Equities ratio at record low, forms bullish divergence with oscillators
Commodity to equity ratio
is at a record low,
indicating commodities are
extremely cheap at present
Source: Bloomberg, Edelweiss Professional Investor Research
The above chart is the ratio chart of the GSCI commodity total return index to the S&P 500 index.
It can be seen that, at present, the ratio is at the lowest level since 1970, indicating that
commodities are extremely cheap compared to equities. Adding to this, the two major bottoms in
the ratio (1974 to 1987 and 1990 to 1999) lasted an average of 10.3 years. The current
downtrend in the ratio has been in place for the past 11.5 years, signaling that a turn in the cycle
of the ratio could not be far away. Meanwhile, at key bottoms in the ratio, the S&P 500 has a
tendency to turn down first before commodities gain upside traction. Given how depressed the
ratio is at present and given how strongly the S&P 500 has rallied over the last few years, a similar
such development cannot be ruled out in the coming months.
14 Edelweiss Professional Investor Research – Trading DeskPotential long-term top in the DXY could offer a strong boost to commodities
The Dollar index has
historically followed a 16yr
cycle
Source: Bloomberg, Edelweiss Professional Investor Research
The above chart shows the long-term time cycle chart of the DXY index. Notice that each major
DXY cycle, from one top to the next top, has lasted for 16 years. The third such cycle peaked out
in 2017. Since then, the DXY has not made a new high. Historically, between two major successive
peaks, the ensuing correction has been deep, with the index making new secular lows on each
such occasion. If this time cycle holds, then over the next few years, the DXY could be in a severe
downtrend, which if happens would offer a strong boost for commodity prices to begin their new
leg higher.
Gold moving perfectly in sync with the US inflation-adjusted yield
Gold and US real yields
continue to share a strong
negative correlation
Source: Bloomberg, Edelweiss Professional Investor Research
Since the start of 2019, gold has been trending higher, boosted by the downward trajectory in
real yields. As can be seen above, gold shares a very strong negative correlation with inflation-
adjusted yields (aka real yields), as measured by the 10y TIPS yield in the chart above. Since 2016,
this correlation has been consistently negative, meaning that a drop in the yield on TIPS benefits
gold, and vice versa. With nominal rates unlikely to rise any time soon because of the Fed’s
dovish stance on its policy, we expect the downward pressure on yields to persist. This in turn is
likely to offer support to gold.
15 Edelweiss Professional Investor Research – Trading DeskWith Chinese manufacturing rebounding, industrial metals could gain bullishness momentum
A rebound in Chinese
manufacturing PMI to
expansionary zone has
benefited non-ferrous
metals
Source: Bloomberg, Edelweiss Professional Investor Research
Another positive development for commodities, especially industrial metals, is that Chinese
manufacturing PMI is showing signs of bottoming. After hovering just below the contractionary
zone over the past few months, the PMI has moved back into the expansionary zone, indicating
that the sector could be reviving. The recovery in base metal prices off key supports has also
coincided with a rebound in PMI. If the Chinese PMI sustains above 50, then that should offer a
strong boost for metal prices to head north.
Agricultural index breaking out of multi-year lows
Agricultural index is
breaking out a multi-
month trend line, signaling
that bull trend could be
starting
Source: Bloomberg, Edelweiss Professional Investor Research
The chart above is the Bloomberg agricultural index. This index comprises of coffee (10%), corn
(20%), cotton (4%), soybeans (19%), soybean oil (11%), soybean meal (10%), sugar (11%), and
wheat (15%). It can be seen that the index has just broken out of a 7-year downtrend line and
that the RSI has broken out of a 12-year downtrend line. This indicates at the start of a new bull
market in agro-commodities. Historically, since 1990, we have observed that whenever the index
has given major breakouts, it has returned an average of 53% over the coming months.
16 Edelweiss Professional Investor Research – Trading DeskCrude oil reverses lower from key resistance, hinting at a lower move
Crude oil seems to have
formed a long-term top
Source: Bloomberg, Edelweiss Professional Investor Research
In our previous ChartWatchers, we highlighted that WTI crude oil could top out around $65. Post
the Iran US tension, crude oil prices surged higher towards $65 but failed to break the previous
swing high, resulting in the formation of a big engulfing pattern near the long-term downward
sloping trendline resistance. This, as per the Elliot wave theory, should mark a long term top in
crude oil.
WORLD CURRENCIES TO STRENGTHEN AS THE DOLLAR TURNS SOUTH
BRICS currencies forming bullish divergence with RSI
Equal weighted chart of
BRICS currencies shows
that the dollar could be set
to weaken against these
currencies
Source: Bloomberg, Edelweiss Professional Investor Research
The above is the equal-weighted chart of BRICS currencies. Notice that the index has made a
lower low, while the RSI is making a higher low, thereby forming a bullish divergence. If the RSI
crosses the 60 hurdle, it will signal at the start of a bullish momentum. If this is then accompanied
by the index breaking above its immediately prior high, it would suggest that BRICS currencies
would start strengthening against the Dollar in the coming months.
17 Edelweiss Professional Investor Research – Trading DeskEUR/USD volatility at the lowest since at least 2003
EUR/USD ATM 3-month IVs
are the lowest level since
the early 2000s, signaling
that volatility could erupt
soon
Source: Bloomberg, Edelweiss Professional Investor Research
The chart above shows the Dollar index on the top and EUR/USD 3-month Implied Volatility (IV)
on the bottom. An interesting thing to note here is that the IVs for EUR/USD are currently at the
lowest level since the time the data is available. Usually, contraction in IVs to such depressed
levels is followed by a sharp move in the currency pair over the coming weeks. While IVs do not
tell about the direction in which the move occurs, given our stance on the Dollar as mentioned
earlier, we expect the pair to head higher once IVs pick up.
Short-term trend of DXY turns lower
The short-term trend of
the DXY has turned south
Source: Bloomberg, Edelweiss Professional Investor Research
As per our Elliott Wave count, we expect weakness in the DXY to continue in the short-term. On
an immediate basis, we could see a minor pullback in the DXY given the end of minor subwave
(v). However, overall, given the wave structure, the index seems headed towards 96-95 levels in
the next few sessions.
18 Edelweiss Professional Investor Research – Trading DeskHistory suggests consolidation or a correction in USD/INR
There were two major bear market instances in the DXY in the past.
The first bear market period (see chart below) formed between 1984 to 1987. During this period,
USD/INR consolidated before breaking higher.
DXY Index
During the 1984 to 1987
DXY bear market, USD/INR
consolidated within a
USD/INR
triangle pattern
Source: Bloomberg, Edelweiss Professional Investor Research
In the second bear market (see chart below) that lasted from 2001 to 2007, USD/INR depreciated
in tandem with the fall in the DXY.
DXY Index
During the 2001 to 2007
DXY bear market, USD/INR
depreciated in tandem
with the fall in DXY
USD/INR
Source: Bloomberg, Edelweiss Professional Investor Research
Thus, if history has to repeat now, USD/INR appreciation looks unlikely in the medium-term.
19 Edelweiss Professional Investor Research – Trading DeskThe short-term trend of
the DXY has turned south
Source: Bloomberg, Edelweiss Professional Investor Research
As per our Elliott wave count, USD/INR has completed subwave (iii) of larger wave 3. What this
means is that in the short-term, there could be a correction in the form of subwave (iv). This
consolidation could be in the range of 66 to 75.
INDIA SECTORAL ANALYSIS
NSE Metal Index suggesting at a turn in time cycle
NSE Metal index time cycle
chart
Source: Bloomberg, Edelweiss Professional Investor Research
The chart above shows the NSE Metal index. It can be seen that the index has not only completely
retraced its prior decline, but has also done so in essentially the same time. The index has now
broken out of a downward sloping channel, indicating that it is poised to head higher in the
weeks ahead.
20 Edelweiss Professional Investor Research – Trading DeskNSE Pharma Index indicating at a move higher
NSE Pharma index starting
to show signs of strength
Source: Bloomberg, Edelweiss Professional Investor Research
The above chart is the NSE pharma index. It can be observed that the index has given an inverse
H&S breakout and is now close towards breaking out of a falling wedge pattern. A breakout out
of this wedge pattern would signal at a stronger rally in the weeks ahead.
Cement sector stocks are showing strength
Equal-weighted cement
index comprising of major
cement stocks has broken
out on the upside
Source: Bloomberg, Edelweiss Professional Investor Research
Above is the equal-weighted Cement Index chart comprising of JK Lakshmi, Ramco, JK Cement,
Shree Cement, and Ultra Cement. If we go back to Dec 18 - Jan 19 period, the index had given a
four month breakout and after that it gave an upside move of 31%. Currently, the same
phenomenon is taking place wherein the index has given an eight month trendline breakout with
an expansion in volume. Thus, going forward we can see upside momentum in the index.
21 Edelweiss Professional Investor Research – Trading DeskMidcap 100 index could see a sharp rally in the days ahead
Midcap 100 index could see
a modest decline, before
beginning a sharp move
higher
Source: Bloomberg, Edelweiss Professional Investor Research
After exiting from a 2-year downtrend, the Midcap 100 index seems to have bottomed out. As
per Elliot, wave 1 seems to have ended in the form of a leading diagonal. This suggests that we
could see a small decline in the index in the form of wave 2, which should be used as a buying
opportunity for an upside towards 20000.
STOCK PICKS
Buy – RAMCO CEMENT
Buy Ramco Cement for a
target of 1000
Source: Bloomberg, Edelweiss Professional Investor Research
Ramco Cement is breaking out of a triangle pattern with the emergence of a strong bullish
candle. The stock has reversed off its key 50-weekly moving average, strengthening the case of an
up move. We see the stock heading towards 1000 in the days ahead as long it holds above 690.
22 Edelweiss Professional Investor Research – Trading DeskBuy – BHARAT FORGE
Buy Bharat Forge for a
target of 580
Source: Bloomberg, Edelweiss Professional Investor Research
Bharat Forge has broken out of an inverse head and shoulder pattern. In doing so, it has also
moved above its 50-weekly moving average. With the stock holding long-term support zone and
now giving a breakout, we expect it to go higher towards 580 as long as it holds above 450.
Buy – VEDANTA
Buy Vedanta for a target of
200
Source: Bloomberg, Edelweiss Professional Investor Research
Vedanta has broken out of a falling wedge pattern with the breakout also being accompanied by
a positive divergence that had formed previously with the RSI. The stock is also just breaking
above the key 50-weekly moving average, which was not broken since mid-2018. All this suggests
at a move higher in the stock towards 200 as long as it holds above 140.
23 Edelweiss Professional Investor Research – Trading DeskSell – TITAN
Sell Titan below 1140 for a
target of 1000
Source: Bloomberg, Edelweiss Professional Investor Research
The stock is showing clear signs of weakness on the weekly time frame. Not only has it formed a
double top pattern, but this double top has also been accompanied by a bearish divergence being
formed with the RSI. Given that the stock is now breaking below the 20-weekly and 50-weekly
MA, we expect it to head lower towards 1000 once it breaks its immediate support of 1140. We
suggest maintaining a stop loss of 1180.
24 Edelweiss Professional Investor Research – Trading DeskEdelweiss Broking Limited, 6th Floor, Edelweiss House, Off. C.S.T. Road, Kalina, Mumbai 400098.
Board: 022 4009 4400
Vinay Khattar
VINAY
Digitally signed by VINAY KHATTAR
DN: c=IN, o=Personal, postalCode=400072,
st=Maharashtra,
2.5.4.20=87db74ffb17a70c89e8519a4d13e40e93
Head Research c4bcaba1a64d00f3c841d2fee3fa678,
KHATTAR
serialNumber=cd5737057831c416d2a5f7064cb6
93183887e7ff342c50bd877e00c00e2e82a1,
cn=VINAY KHATTAR
vinay.khattar@edelweissfin.com Date: 2020.01.10 10:34:36 +05'30'
25 Edelweiss Professional Investor Research – Trading DeskDisclaimer
Edelweiss Broking Limited (“EBL” or “Research Entity”) is regulated by the Securities and Exchange Board of India (“SEBI”) and is licensed to carry on the business of broking, depository
services and related activities. The business of EBL and its Associates (list available on www.edelweissfin.com) are organized around five broad business groups – Credit including Housing and
SME Finance, Commodities, Financial Markets, Asset Management and Life Insurance.
Broking services offered by Edelweiss Broking Limited under SEBI Registration No.: INZ000005231; Name of the Compliance Officer: Mr. Brijmohan Bohra, Email ID:
complianceofficer.ebl@edelweissfin.com Corporate Office: Edelweiss House, Off CST Road, Kalina, Mumbai - 400098; Tel. 18001023335/022-42722200/022-40094279
This Report has been prepared by Edelweiss Broking Limited in the capacity of a Research Analyst having SEBI Registration No. INH000000172 and distributed as per SEBI (Research Analysts)
Regulations 2014. This report does not constitute an offer or solicitation for the purchase or sale of any financial instrument or as an official confirmation of any transaction. The information
contained herein is from publicly available data or other sources believed to be reliable. This report is provided for assistance only and is not intended to be and must not alone be taken as the
basis for an investment decision. The user assumes the entire risk of any use made of this information. Each recipient of this report should make such investigation as it deems necessary to
arrive at an independent evaluation of an investment in the securities of companies referred to in this document (including t he merits and risks involved), and should consult his own advisors
to determine the merits and risks of such investment. The investment discussed or views expressed may not be suitable for all investors.
This information is strictly confidential and is being furnished to you solely for your information. This information should not be reproduced or redistributed or passed on directly or indirectly
in any form to any other person or published, copied, in whole or in part, for any purpose. This report is not directed or intended for distribution to, or use by, any person or entity who is a
citizen or resident of or located in any locality, state, country or other jurisdiction, where such distribution, publication, availability o r use would be contrary to law, regulation or which would
subject EBL and associates / group companies to any registration or licensing requirements within such jurisdiction. The distribution of this report in certain jurisdictions may be restricted by
law, and persons in whose possession this report comes, should observe, any such restrictions. The information given in this report is as of the date of this report and there can be no
assurance that future results or events will be consistent with this information. This information is subject to change witho ut any prior notice. EBL reserves the right to make modifications and
alterations to this statement as may be required from time to time. EBL or any of its associates / group companies shall not be in any way responsible for any loss or damage that may arise to
any person from any inadvertent error in the information contained in this report. EBL is committed to providing independent and transparent recommendation to its clients. Neither EBL nor
any of its associates, group companies, directors, employees, agents or representatives shall be liable for any damages whether direct, indirect, special or consequential including loss of
revenue or lost profits that may arise from or in connection with the use of the information. Our proprietary trading and investment businesses may make investment decisions that are
inconsistent with the recommendations expressed herein. Past performance is not necessarily a guide to future performance .The disclosures of interest statements incorporated in this report
are provided solely to enhance the transparency and should not be treated as endorsement of the views expressed in the report. The information provided in these reports remains, unless
otherwise stated, the copyright of EBL. All layout, design, original artwork, concepts and other Intellectual Properties, remains the property and copyright of EBL and may not be used in any
form or for any purpose whatsoever by any party without the express written permission of the copyright holders.
EBL shall not be liable for any delay or any other interruption which may occur in presenting the data due to any reason including network (Internet) reasons or snags in the system, break
down of the system or any other equipment, server breakdown, maintenance shutdown, breakdown of communication services or inability of the EBL to present the data. In no event shall EBL
be liable for any damages, including without limitation direct or indirect, special, incidental, or consequential damages, losses or expenses arising in connection with the data presented by the
EBL through this report.
We offer our research services to clients as well as our prospects. Though this report is disseminated to all the customers simultaneously, not all customers may receive this report at the same
time. We will not treat recipients as customers by virtue of their receiving this report.
EBL and its associates, officer, directors, and employees, research analyst (including relatives) worldwide may: (a) from time to time, have long or short positions in, and buy or sell the
securities thereof, of company(ies), mentioned herein or (b) be engaged in any other transaction involving such securities and earn brokerage or other compensation or act as a market maker
in the financial instruments of the subject company/company(ies) discussed herein or act as advisor or lender/borrower to such company(ies) or have other potential/material conflict of
interest with respect to any recommendation and related information and opinions at the time of publication of research repor t or at the time of public appearance. EBL may have proprietary
long/short position in the above mentioned scrip(s) and therefore should be considered as interested. The views provided herein are general in nature and do not consider risk appetite or
investment objective of any particular investor; readers are requested to take independent professional advice before investing. This should not be construed as invitation or solicitation to do
business with EBL.
EBL or its associates may have received compensation from the subject company in the past 12 months. EBL or its associates may have managed or co-managed public offering of securities
for the subject company in the past 12 months. EBL or its associates may have received compensation for investment banking or merchant banking or brokerage services from the subject
company in the past 12 months. EBL or its associates may have received any compensation for products or services other than investment banking or merchant banking or brokerage services
from the subject company in the past 12 months. EBL or its associates have not received any compensation or other benefits from the Subject Company or third party in connection with the
research report. Research analyst or his/her relative or EBL’s associates may have financial interest in the subject company. EBL, its associates, research analyst and his/her relative may have
other potential/material conflict of interest with respect to any recommendation and related information and opinions at the time of publication of research report or at the time of public
appearance.
Participants in foreign exchange transactions may incur risks arising from several factors, including the following: ( i) exchange rates can be volatile and are subject to large fluctuations; ( ii) the
value of currencies may be affected by numerous market factors, including world and national economic, political and regulatory events, events in equity and debt markets and changes in
interest rates; and (iii) currencies may be subject to devaluation or government imposed exchange controls which could affect the value of the currency. Investors in securities such as ADRs
and Currency Derivatives, whose values are affected by the currency of an underlying security, effectively assume currency risk.
Research analyst has served as an officer, director or employee of subject Company: No
EBL has financial interest in the subject companies: No
EBL’s Associates may have actual / beneficial ownership of 1% or more securities of the subject company at the end of the month immediately preceding the date of publication of research
report.
Research analyst or his/her relative has actual/beneficial ownership of 1% or more securities of the subject company at the e nd of the month immediately preceding the date of publication of
research report: No
EBL has actual/beneficial ownership of 1% or more securities of the subject company at the end of the month immediately preceding the date of publication of research report: No
Subject company may have been client during twelve months preceding the date of distribution of the research report.
There were no instances of non-compliance by EBL on any matter related to the capital markets, resulting in significant and material disciplinary action during the last three years.
26 Edelweiss Professional Investor Research – Trading DeskDisclaimer
A graph of daily closing prices of the securities is also available at www.nseindia.com
Analyst Certification:
The analyst for this report certifies that all of the views expressed in this report accurately reflect his or her personal views about the subject company or companies and its or their securities,
and no part of his or her compensation was, is or will be, directly or indirectly related to specific recommendations or views expressed in this report.
Additional Disclaimer for U.S. Persons
Edelweiss is not a registered broker – dealer under the U.S. Securities Exchange Act of 1934, as amended (the“1934 act”) and under applicable state laws in the United States. In addition
Edelweiss is not a registered investment adviser under the U.S. Investment Advisers Act of 1940, as amended (the "Advisers Act" and together with the 1934 Act, the "Acts), and under
applicable state laws in the United States. Accordingly, in the absence of specific exemption under the Acts, any brokerage and investment services provided by Edelweiss, including the
products and services described herein are not available to or intended for U.S. persons.
This report does not constitute an offer or invitation to purchase or subscribe for any securities or solicitation of any investments or investment services and/or shall not be considered as an
advertisement tool. "U.S. Persons" are generally defined as a natural person, residing in the United States or any entity organized or incorporated under the laws of the United States. US
Citizens living abroad may also be deemed "US Persons" under certain rules.
Transactions in securities discussed in this research report should be effected through Edelweiss Financial Services Inc.
Additional Disclaimer for U.K. Persons
The contents of this research report have not been approved by an authorised person within the meaning of the Financial Services and Markets Act 2000 ("FSMA").
In the United Kingdom, this research report is being distributed only to and is directed only at (a) persons who have professional experience in matters relating to investments falling within
Article 19(5) of the FSMA (Financial Promotion) Order 2005 (the “Order”); (b) persons falling within Article 49(2)(a) to (d) of the Order (including high net worth companies and unincorporated
associations); and (c) any other persons to whom it may otherwise lawfully be communicated (all such persons together being referred to as “relevant persons”).
This research report must not be acted on or relied on by persons who are not relevant persons. Any investment or investment activity to which this research report relates is available only to
relevant persons and will be engaged in only with relevant persons. Any person who is not a relevant person should not act or rely on this research report or any of its contents. This research
report must not be distributed, published, reproduced or disclosed (in whole or in part) by recipients to any other person.
Additional Disclaimer for Canadian Persons
Edelweiss is not a registered adviser or dealer under applicable Canadian securities laws nor has it obtained an exemption from the adviser and/or dealer registration requirements under such
law. Accordingly, any brokerage and investment services provided by Edelweiss, including the products and services described herein, are not available to or intended for Canadian persons.
This research report and its respective contents do not constitute an offer or invitation to purchase or subscribe for any securities or solicitation of any investments or investment services.
Disclosures under the provisions of SEBI (Research Analysts) Regulations 2014 (Regulations)
Edelweiss Broking Limited ("EBL" or "Research Entity") is regulated by the Securities and Exchange Board of India ("SEBI") and is licensed to carry on the business of broking, depository
services and related activities. The business of EBL and its associates are organized around five broad business groups – Credit including Housing and SME Finance, Commodities, Financial
Markets, Asset Management and Life Insurance. There were no instances of non-compliance by EBL on any matter related to the capital markets, resulting in significant and material
disciplinary action during the last three years. This research report has been prepared and distributed by Edelweiss Broking Limited ("Edelweiss") in the capacity of a Research Analyst as per
Regulation 22(1) of SEBI (Research Analysts) Regulations 2014 having SEBI Registration No.INH000000172.
27 Edelweiss Professional Investor Research – Trading DeskYou can also read