MANAGING POPULATION GROWTH FOR ALL VICTORIANS - Liberal | Nationals www.vicpopulation.com.au
←
→
Page content transcription
If your browser does not render page correctly, please read the page content below

MANAGING POPULATION
GROWTH FOR ALL VICTORIANS

Liberal | Nationals   www.vicpopulation.com.au

                                       www.vicpopulation.com.au
We Believe...
                                                 That through a strong Liberal Nationals
                                                population policy to grow the whole of the state,
                                               we can ensure that Victorian expectations for a
                                             liveable city and state can be achieved.
                                            • Every Victorian has the right to feel safe in their home with
                                           their families and on our streets.
                                         • Our public transport system should be affordable, reliable
                                        and accessible for all Victorians so they can spend less time
                                       commuting and more time with their friends and family.
                                      • A world class transport system will connect all Victorians,
                                     including regional communities who rely on a fast and
                                    affordable rail network.
                                   • The first priority of our roads system must be to ensure that
                                  Victorians can travel safely and spend less time sitting in traffic
                                 and more time with their friends and family.
                                • As demand for housing grows in metropolitan Melbourne, we
                               need to ensure there is enough supply to meet growing demand,
                              and that there is a good mix of different types of housing to give
                             every Victorian the opportunity to own their own home.
                            • The opportunities to access affordable housing in regional
                           Victoria where land and house prices are much lower than
                          metropolitan areas offer a great incentive for people to move
                         to regional Victoria to assist with balancing population growth
                        across the state.
                       • Every Victorian should have access to the key services they
                      need close to them, so they can lead happy and healthy lives.

Liberal | Nationals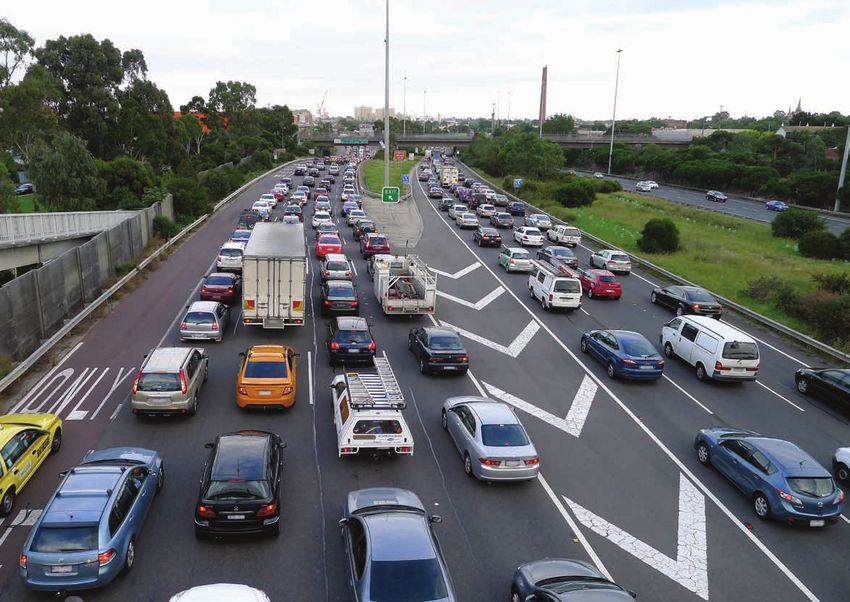
VICTORIA IS GROWING
          Every year Victoria’s population grows by the size of a packed MCG. One hundred
          thousand people are added to our state every 12 months and roughly 92 per cent
          of them are headed towards Melbourne. So it is no wonder that strained and
          congested infrastructure is something Victorians experience every day.
          The challenge for Victoria is not just about the number of people but where those
          people are choosing to live and how state government can provide incentives,
          choices and business motivation to grow the whole of our state. Population
          growth should be central to everything a state government does.
          Victoria needs a clear population policy to manage the growth of our state. The
          Liberal Nationals recognise this, which is why we are starting the work now, well
          in advance of the next election.
          We have established a Population Policy Taskforce to consider all of these things
          and develop detailed plans to manage our population growth. It will be about a
          whole–of–government approach to managing our state’s population and how we
          regionalise our growth, not just focussing on Melbourne alone.
          This is about keeping Victoria the magnificent place that it is. It is about jobs,
          infrastructure and the way we live, because we cannot continue to grow the way
          we have the past 30 years for the next 30 years.

          Matthew Guy.
                          Matthew Guy MP
                    LEADER OF THE OPPOSITION AND
                     LEADER OF THE LIBERAL PARTY
LOOKING
FORWARD
P01
                                                                                               www.vicpopulation.com.au
Message from the Leader of the Nationals
                              Regional Victoria must have a central role in any plan for our state’s future population.
                             Yet the city-centric Andrews Government has no policy to manage and grow the population of regional Victoria.
                           With Melbourne bursting at the seams, there’s never been a more vital time to look to our regional towns, cities and industries to secure the opportunities and lifestyle that
                          Victorians desire.
                         To realise these opportunities, we need the right vision, leadership and policy settings. We need a population plan that will address the current challenges and service inequities
                        within regional Victoria. We also need a population plan that will encourage business, investment and people to our regional centres.
                       The Liberal Nationals Population Policy Taskforce is a significant step towards responsible future government for all of Victoria.
                      THE HON. PETER WALSH MP, Leader of the Nationals, Member For Murray Plains

                                    About this discussion paper – from the Chair and Vice-Chair
                                   Equality of opportunity is a fundamental Liberal principle, and nowhere should it find greater expression than in state government policy that enables all Victorians
                                  equality of access to the fundamental services they need to ensure they can achieve their potential and live fulfilling lives.
                                Preservation of Melbourne and regional Victoria’s much vaunted liveability and heritage must be at the centre of future policy deliberations.
                               Population is one of the core drivers of economic growth, alongside participation and productivity. In times of rapid population growth, two new Ps, namely
                              preparation and place, are also relevant.
                             Through the establishment of this Population Policy Taskforce, the Liberal Nationals are hoping to lead an informed debate about Victoria’s future, for the benefit of
                            all Victorians. Recommendations from this Taskforce will form the basis of policy platforms to be implemented when the Liberal Nationals are returned to government.
                          TIM SMITH MP – Taskforce Chair, Shadow Parliamentary Secretary to the Leader of the Opposition, Member for Kew

                                          In many of our rural communities population is in decline, and changes to our industries means the type of jobs available in country Victoria have
                                         changed significantly over recent decades.
                                        The Liberal Nationals are committed to balanced population growth across the entire state. Rural and regional Victorians deserve to have a government
                                       that has the vision to look beyond the city limits, and to encourage lifestyle, career and plentiful business opportunities on offer in regional Victoria.
                                     There are a number of success stories of positive population growth and development in regional Victoria, but what we need is leadership and a plan so that
                                    our wonderful rural communities not just survive, but thrive into the future.
                                  I am proud to be part of the Liberal Nationals Population Policy Taskforce, and am confident that this policy leadership will ensure that both regional and
                                  metropolitan Victoria will be the envy of all Australian states for its liveability and opportunities for individual and business success.
                                EMMA KEALY MP – Taskforce Vice-Chair, Member for Lowan

Liberal | Nationals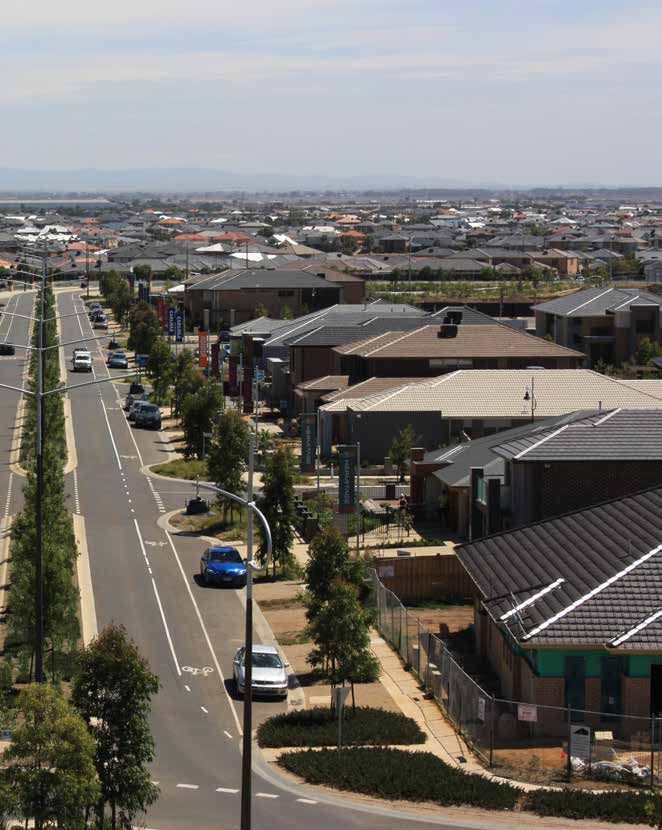
Victoria’s
           population is
          growing by one
           person every
           five minutes.
LOOKING
FORWARD
P03
                           www.vicpopulation.com.au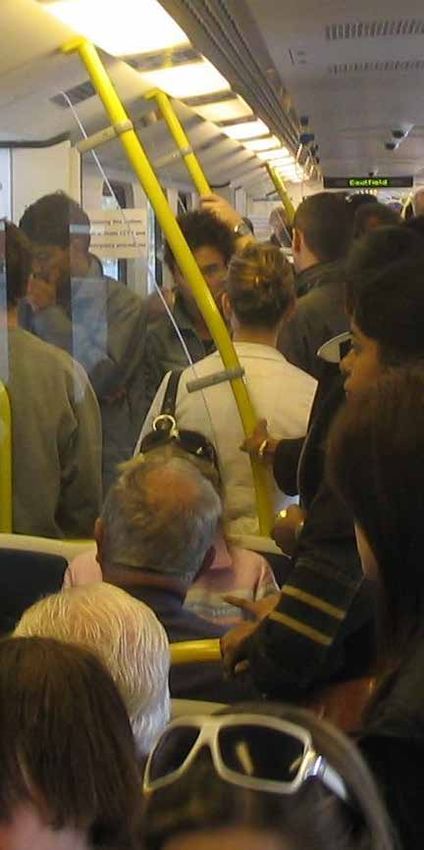
EMBAR G O :
Figure 2. Annual population change by component, Victoria 1981 to 2051
VICTORIA’S POPULATION IS BOOMING... Annual population change by component, Victoria 1981 to 2051
Total
population
120 change
Victoria’s population is growing by 1 person every 5 minutes. This adds up to over Population growth KEY F
Quarterly
100,000 more people in our state every year, which projects a population in 2051 of 100
'000 PRELI M I N A
10.1 million. At the end of March 2016, Victoria’s population exceeded 6 million people, 80
Total growth
Natural increase
160 Net
DATA
and is showing no signs of slowing down. This growth is driven by immigrants from
overseas
Net overseas migration migration
Persons ('000s)
120
overseas and interstate, and the birth rate. 60
Natural
increase
80 New South Wal
There are 3 components to Victoria’s total population change:
40
Victoria
1.
20
40 Queensland
NET OVERSEAS MIGRATION, which is the strongest driver of population change, is the net effect of “... Net South Australia
Interstate
long–term arrivals and departures over a period.” Based on Commonwealth forecasts, this is expected 0
migration
0 Western Austra
to account for 50 to 60 per cent of annual population growth over the projection period, to 2051. Mar Mar Mar
-20 Tasmania
2012 2014 2016
Northern Territo
2.
1981 1986 1991 1996 2001 2006 2011 2016 2021 2026 2031 2036 2041 2046 2051
Australian Capi
ET INTERSTATE MIGRATION is the measure of migration flow into and out of Victoria
N SOURCE: State of Victoria, DELWP, Victoria in Future 2016, Population and household projections to 2051.
to other states. This is a relatively small contribution to Victoria’s population change. Population Growth Rate Australia (a)
Population
Year Growth
ended 31 - Year
March ended 31 March 2016
2016
NSW
(a) Includes Othe
3.
Vic. and the Cocos
NATURAL INCREASE is the difference between the number of births and deaths in Victoria. The projected Qld
SA
KEY P
Total Fertility Rate over the period 2011 – 2051 for Victoria is approximately 1.8 children per woman. Life
Victoria in Future 2016 Population and household projections to 2051 Page 5
expectancy is expected to continue to increase consistently, with life expectancy for males reaching 88 WA
ESTIM AT E D
Tas.
by 2051, and for females 90 years. As both life expectancy and fertility rates increase, the net effect is an The prelim
NT
increasing Natural Increase.
ACT 24,051,40
Aust. 107,500 p
0 0.4 0.8 1.2 1.6 2.0 The prelim
% people) w
SOURCE: State of Victoria, Department of Environment, Land, Water and Planning (DELWP), Victoria in Future 2016, Population and household projections to 2051. SOURCE: ABS, Australian Demographic Statistics, March 2016.
ended 31
The prelim
I N Q U I R I E S
2016 (180
Liberal | Nationals For further information recorded
about these and related
statistics, contact the POPUL A T I O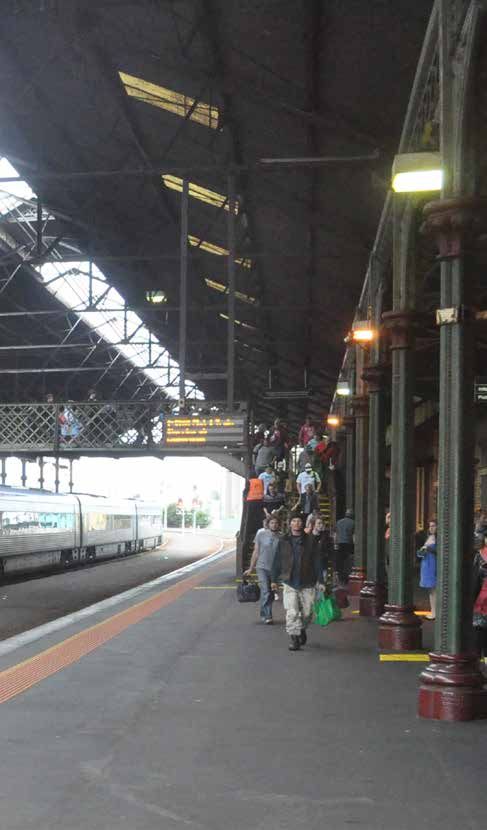
per cent. From 2015 to 2031, the population of Victoria is Over this period the population of Victoria’s regions is
projected to grow by 1.8 million to 7.7 million, at a rate of expected to grow from 1.4 million to 2.1 million – stronger
1.7 per cent per annum. As the contribution of NOM to than the ABS projection due to VIF2016 assuming a
population growth increases, Victoria is projected to add larger total net migration from Greater Melbourne to
another 2.4 million people to reach a population of 10.1 Victoria’s regions.
...MOST OF THIS GROWTH IS IN MELBOURNE
million by 2051, growing over this period at a rate of 1.3
Figure 3. Estimated Resident Population, Victoria and major regions 1971 to 2051
Estimated Resident Population, Victoria and major regions 1971 to 2051 Population growth since 2001
Victoria 6000000
10.0
5000000
Population
4000000
Greater
8.0 Melbourne 3000000
Persons (millions)
2000000
6.0 1000000
0
2001 2006 2011 2016
4.0
Melbourne Sydney
Victoria’s SOURCE: ABS, Census Services.
2.0 Regions
0
In the past 10 years, Melbourne’s population
1971 1991 2011 2031 2051
has grown by 2.1%, Sydney’s by 1.7%
SOURCE: State of Victoria, DELWP, Victoria in Future 2016, Population and household projections to 2051.
SOURCE: ID The Population Experts, “Will Melbourne’s population overtake Sydney? Maybe in…”
April 21, 2016 (id.com.au).
Victoria in Future 2016 Population and household projections to 2051 Page 6
In 2014
86.7%
of people moving from overseas
who chose to make Victoria their
Total Population
Greater Melbourne
Capital City Area
All regional areas
2011
4,169,400
1,368,500
2021
5,106,700
1,499,000
2031
6,058,800
1,674,500
2041
7,016,000
1,859,900
2051
8,024,100
2,062,400
home settled in Melbourne,
putting enormous pressure on TOTAL VICTORIA 5,537,800 6,605,700 7,733,300 8,876,000 10,086,500
infrastructure and communities.
SOURCE: Regional Net Overseas Migration 2004–05 to 2017–18, Note: Due to larger projections of net overseas migration and fertility, the Victoria In Futures 2016 projected population for Victoria in 2051 is higher than the
Department of Immigration and Border Protection, Australian Government. ABS projection of 9.4m, published in the November 2013 report. SOURCE: DELWP, Victoria in Future, 2016, Population and household projections to 2051.
LOOKING
FORWARD
P05
www.vicpopulation.com.au
of
agechange on people
structure of differentFigure
of the population. ages change
4 showsthe
the
of the totalThe
decrease. population
number this age group
of people is expected
in Victoria to to
aged up
age structure of the population. Figure 4 shows the
projected age structures for Greater Melbourne and
decrease. The number of people in Victoria aged up to
17 years remained relatively constant from 1971 to 2011.
projected age structures
Victoria’s regions for Greater
in 2011 and 2051. Melbourne and
17 years
Over theremained relatively
40 years to constant
2051, VIF2016 from 1971
projects a 67to 2011.
per cent
Victoria’s regions in 2011 and 2051.
The number of people aged 65 years and over in Over the in
increase 40this
years togroup.
age 2051, VIF2016 projects a 67 per cent
OUR POPULATION IS AGEING The number
Victoria of people
is likely aged
to almost 65 from
triple years2011
andtoover
2051inas the
Victoria is likely to almost triple from 2011 to 2051 as the
increase in this age group.
Figure 4. Age structure, Greater Melbourne and Victoria’s regions 2011 and 2051
Figure 4. Age structure, Greater Melbourne and Victoria’s regions 2011 and 2051
2051 projected age distribution Age structure, GreaterGreater
MelbourneMelbourne
and Victoria’s regions 2011 and 2051
Greater Melbourne
in Victoria Males
85 +
80-84
85 +
Females
Males 75-79
80-84 Females
By 2051, when Victoria’s population is expected to hit 2011
70-74
75-79
65-69
2051 70-74
10.1 million, a greater proportion of Victorians will be above 2011 60-64
65-69
2051 55-59
the age of 70. The number of people aged 65 years and over in 60-64
50-54
55-59
Victoria is likely to triple from 2011 to 2051. As our population 45-49
50-54
40-44
45-49
ages, there will be greater demand for support services and 35-39
40-44
30-34
35-39
activities for older people. 25-29
30-34
20-24
25-29
15-19
Regional and country Victoria will experience this more than 20-24
10-14
15-19
Melbourne. By 2051, older Victorians will comprise a greater 5-9
10-14
0-4
5-9
proportion of the overall population in Victoria’s regions than they 300 250 200 150 100 50 0 0-4 0 50 100 150 200 250 300
300 250 Persons ('000s)
200 150 100 50 0 0 50 100Persons ('000s) 200
150 250 300
will in Greater Melbourne. Persons ('000s) Persons ('000s)
In regional Victoria, younger adults tend to move to city centres for Victoria’s regions
education or employment opportunities. These people often return to Victoria’s regions
85+
rural and regional Victoria to raise their family or care for their older Males 80-84
85+ Females
75-79
80-84
relatives as they age. Males 70-74
75-79
Females
2011 65-69
70-74
60-64
2051
With Melbourne’s population projected to rise to 8 million by 2051, 2011 65-69
55-59
60-64
2051 50-54
how we deal with this influx of people is of vital importance to 55-59
45-49
50-54
40-44
keep Victoria a great place to live and work for everyone. 45-49
35-39
40-44
30-34
35-39
SOURCE: State of Victoria, DELWP, Victoria in Future 2016, Population and household 25-29
30-34
projections to 2051. 20-24
25-29
15-19
20-24
10-14
15-19
5-9
10-14
0-4
5-9
100 75 50 25 0 0-4 0 25 50 75 100
100 75 Persons ('000s)
50 25 0 0 25 Persons50
('000s) 75 100
Persons ('000s)
SOURCE: State of Victoria, DELWP, Victoria in Future, 2016, Population and householdPersons
projections('000s)
to 2051.
Victoria in Future 2016 Population and household projections to 2051 Page 7
Victoria in Future 2016 Population and household projections to 2051 Page 7
Liberal | Nationals
THE WHOLE GOVERNMENT IS RESPONSIBLE FOR POPULATION GROWTH
Population growth affects every aspect of people’s lives. People are
spending more time sitting in traffic and away from their families
                                                                                 The Infrastructure Australia Audit found that this corridor [Eastern
                                                                                 Freeway to CityLink] had the highest 2011 road congestion delay cost
                                                                                                                                                                     Victoria won’t be able to
because our roads are congested and our trains, trams and buses                  in Melbourne, with a delay cost of $73 million. This is expected to                 meet the challenges of
                                                                                 worsen by 2031, with delay cost increasing to $144 million.
overcrowded. As more than 100,000 people come to Victoria every year,
the services we rely on, including schools, hospitals and police are under
                                                                                                                                                                     population growth
increasing pressure and need more resources and better support.                  Labor has no population policy and,                                                 “Our analysis indicates that Victorian Government policies
                                                                                                                                                                     are inadequate to meet the challenges of population
Regional Victoria has a greater capacity to absorb greater population            as such, Victoria will suffer                                                       growth. (Recent growth projections for Victoria published in
growth, which will support business growth, our volunteer
                                                                                 Victoria’s population is experiencing significant growth, with                      July 2016)… reveal that the population imbalance between
organisations, schools and hospitals, and build demand and access to
                                                                                 infrastructure and services strained. Yet, during a recent                          Melbourne and regional Victoria will be greater by 2051 than
other services to improve liveability for all Victorians.
                                                                                 Parliamentary Committee hearing, Minister for Regional                              now. This outcome does not meet the Government’s own
                                                                                 Development Jaala Pulford was forced to admit the government
Victorians pay a price for Labor                                                 has no population plan for regional Victoria.
                                                                                                                                                                     statutory planning and strategic planning objectives which
                                                                                                                                                                     require that Victoria’s population be rebalanced from Melbourne to
scrapping infrastructure projects                                                        SOURCE: Hansard, Public Accounts and Estimates Committee, Enquiry into
                                                                                                  Budget Estimates 2016 – 17, Melbourne, 13 May 2016                 regional Victoria.”
Infrastructure Australia continues to identify the East West Link                In a document titled ‘Victorian Labor Platform 2014’, there was                                      SOURCE: Rail Futures Institute, August 2016.

as a High Priority infrastructure requirement for Melbourne, to                  no policy for population growth for either Victoria as a whole,
be completed in “Near term (0–5 years)”                                          or for the regions.

                                                                    DANIEL ANDREWS HAS NO POPULATION POLICY
                                                              and it gets worse... the decision to scrap the East
                                                              West Link has cost Victorian taxpayers at least...                                $1.2 BILLION
                                  Problem                                 Problem                     Initiative
                                                        Location                                                                       Problem description           Proposed Initiative
        Infrastructure            Category                               time scale               Development Stage
                                                                                                                                                                                                  SOURCE: Infrastructure
        Australia lists the       Urban Congestion       Victoria            Near term       Initiative development                 Connectivity between          Improve the connection          Australia, Australian
        East West Link                                                                                                              Melbourne’s Eastern Freeway   between eastern Freeway         Infrastructure Plan,
                                                                                                                                                                                                  The Infrastructure
        as priority.                                                                                                                and CityLink                  and CityLink                    Priority List, Feb 2016.

LOOKING
FORWARD
 P07
                                                                                                                                                                                                  www.vicpopulation.com.au
PAYING THE PRICE FOR A LACK OF VISION
            Crime is on the rise                                                     Victorian Sworn Police numbers               November 2014                            June 2016                                        Variation
            Every Victorian has the right to feel safe in their home
          with their families and on our streets. But the latest                     Regional FTE                                      9840.57                               9758.76                                        –81.81
         crime statistics show why Victorians are increasingly                       Total Police FTE                                  13151.68                              13311.47                                       159.79
        concerned about their safety.
                                                                                                                                                                                                                                   SOURCE: Victoria Police

     Under the Andrews Government                                                   Victoria is stuck in a crime epidemic                                     violence have all risen at an alarming rate, with carjackings increasing
                                                                                                                                                              by a staggering 80%.
    the number of police on the beat                                                Public safety should be the number one concern of any                                      SOURCE: Crime Statistics Agency, Data for June Qtr 2016.

   is declining                                                                     government. Statistics published by the Crime Statistics Agency for
                                                                                                                                                              Police are also increasingly under threat, with their cars being rammed
                                                                                    the year ended 30 June 2016 report an overall increase in offences
  With population growth of more than 100,000 people a year,                                                                                                  more than 135 times in the past twelve months alone. Ron Iddles believes
                                                                                    in Victoria of 13.4% compared with the previous year.
 the Police Association analysis shows that we need 3301 new                                                                                                  he hasn’t seen crime ‘as bad as what I do today in 43 years of policing’.
                                                                                    Weapons and explosives offences, home invasions, and gang                       SOURCE: Ron Iddles, Police Association Secretary, Herald Sun, 14 October 2016.
police officers by 2022 to keep Victorians safe.
                           SOURCE: Herald Sun, Ron Iddles: Embarrassing choices
                                for hard-pressed police officers, 5 October 2016.
                                                                                     Crime Type                                                            2015                             2016                                % change
  Under the Andrews Government, in almost two years, only
   160 Full Time Equivalent police have been sworn in since                          Justice procedures                                                   6,887                             12,854                                +86.6%
    November 2014, with front-line, first responder police
                                                                                     Public Nuisance                                                       2,655                             3,452                                +30.0%
     numbers at stations actually down by 82 in the same period.
      The Police Association has requested an extra 1,880 police                     Dangerous and Negligent act endangering other people                 4,338                              5,341                                +23.1%
       under this term of government, with Police Association
        Secretary Ron Iddles saying that the community’s safety                      Theft Offences                                                       151,834                          180,988                                +19.2%
         is compromised and officers’ health is being put at risk
                                                                                     Burglary/Break and enter offences                                    46,250                           52,087                                  +12.6
          by excessive work.
                                 SOURCE: Cranbourne Leader, 15 September 2016        Total Number Offences                                                472,611                         535,826                                 +13.4%

                                                                                                                                                                            SOURCE: CSA Fact Sheet: Recorded Crime Statistics – Year Ending June Qtr 2016.

                 Liberal | Nationals
Crime Statistics Agency (CSA) – Total number of Offences (years to June Qtr)
June Qtr June Qrt % June Qtr June Qrt % June Qtr June Qrt %
LGA LGA LGA
2015 2016 increase 2015 2016 increase 2015 2016 increase
Benalla 1,085 1,527 40.7% Greater Bendigo 8,486 9,521 12.2% Wodonga 3,365 3,505 4.2%
Colac–Otway 1,328 1,821 37.1% Ararat 1,246 1,375 10.4% Wangaratta 2,509 2,597 3.5%
Mount Alexander
1,138 1,473 29.4% Wellington (Sale) 4,333 4,778 10.3% Horsham 2,854 2,890 1.3%
(Castlemaine)
Latrobe (Moe, Morwell,
Greater Geelong 19,410 23,589 21.5% 12,977 14,165 9.2% Swan Hill 2,225 2,252 1.2%
Traralgon)
Campaspe (Echuca) 2,992 3,575 19.5% Greater Shepparton 7,422 8,101 9.1%
Bass Coast (Wonthaggi) 2,460 2,911 18.3% Mildura 5,908 6,312 6.8% Statewide 472,611 535,826 13.4%
Mitchell (Seymour) 3,775 4,418 17.0% Ballarat 11,244 11,883 5.7% SOURCE: Crime Statistics Agency, June Qtr 2016.
East Gippsland
Baw Baw (Warragul) 3,523 4,082 15.9% 4,116 4,315 4.8%
(Bairnsdale)
CRIME EPIDEMIC SWEEPING rime getting worse
C Crime up by
ACROSS THE ENTIRE STATE under Labor: poll. 36.6 per cent.
THE AGE, 4 SEPTEMBER 2016 BENALLA ENSIGN, 22 JUNE 2016
As the Crime Statistics Agency figures show, this crime epidemic
sweeping Victoria is not confined to Melbourne – it is happening Lack of police to blame rime on rise all
C
all over the state. Eight rural and regional local government areas for violent crime wave. over state.
have experienced a substantial increase above the state average HERALD SUN, 25 JULY 2016 HERALD SUN, 17 JUNE 2016
in the year to June 2016.
The correlation between the lack of police resourcing and the urglary spike hits
B Police bracing for
increase in crime cannot be more obvious. Less police equals a record high. youth crime wave.
rise in crime. That’s exactly what is happening in Victoria. MANNINGHAM LEADER, 5 SEPTEMBER 2016 HERALD SUN, 21 AUGUST 2016
LOOKING
FORWARD
P09
www.vicpopulation.com.auPUBLIC TRANSPORT IS STRETCHED...
Our public transport system should be Bus Light rail Heavy rail Number of kilometres travelled
– Metropolitan public transport
affordable and reliable for all Victorians so services
they can spend less time commuting and Notes: Values for ‘bus’ include a
rough allowance for charter/hire
more time with their friends and family. and other private use of buses/
Billion passenger–kilometres
minibuses, as well as UPT route
buses (which include SkyBus
Higher demand for metropolitan services).
public transport services SOURCE: Cosgrove (2011), ABS (2013
and earlier, BITRE (2014) and BITRE
estimates),
There has been a sharp rise in public transport use in Melbourne Bureau of Infrastructure, Transport and
from a low point in 1981 until now. Regional Economics, ‘Information Sheet
59: Urban public transport: updated
trends’, 2013.
Much of this growth has been on trains, where passenger numbers are
edging up to 250 million on current estimates for 2016–17.
Tram patronage is not far behind, projected to be 200 million for the
2016–17 period. Public Transport Patronage
SOURCE: BITRE, “Information Sheet 59: Urban Public Transport Updated Trends”, 2013. – Metro
Tram services
Melbourne’s metropolitan rail network Metropolitan train services
voted ‘worst rail in Australia’ Metropolitan bus services
No. (million)
SOURCE: Department
Melbourne commuters have voted its metropolitan rail network of Treasury and Finance, ‘Budget Paper
the worst in Australia for the fifth consecutive year. The national No. 3: Service Delivery’*
*Actual figures for years from 2003–04
Canstar Blue review found discontent in the Victorian capital to 2014–15, revised figures for 2015–16,
stemmed from Metro Trains’ myki ticketing system and ticket budget figures for 2016–17.
pricing, with each receiving a survey low of two stars. A total
of 70% of Melbourne passengers also reported frequent
overcrowding.
SOURCE: news.com.au 16 September 2016.
Liberal | Nationals...TO THE LIMIT IN MELBOURNE
Percentage of Metro passengers travelling during peak times
on services that are loaded ‘above benchmark levels’
Melbourne’s public transport services
Alamein line
are well off the pace
Victorians deserve a world-class public transport system. This SNAMUTS (Spatial Network
Glen Waverley line Analysis for Multi–Modal Urban Transport Systems) Composite Index Comparison aggregates
Ringwood Corridor*
metrics to give an overview of public transport accessibility, combining results for closeness
centrality, degree centrality, contour catchment, nodal betweenness, nodal resilience and
Dandenong Corridor** nodal connectivity indicators for a visual comparison of public transport systems.
Frankston line It shows that Melbourne’s public transport accessibility, whilst higher than other Australian
capital cities, is considerably less accessible than other international cities.
Sandringham line
SOURCE: www.snamuts.com.
South Morang line
Hurstbridge line
Craigieburn line
Melbourne’s Public Transport Accessibility Rating
Sunbury line
Upfield line
Overcrowding
Werribee line
Williamstown line
Network Average getting worse
Per cent
on Melbourne’s
* Services starting or finishing at Lilydale, Mooroolbark, Belgrave, Upper
train network.
THE AGE, 22 SEPTEMBER 2016
Ferntree Gully, Ringwood or Blackburn stations.
** Services starting or finishing at Pakenham, Berwick, Cranbourne,
Dandenong, Westall and Oakleigh stations.
SOURCE: The Age newspaper, Public Transport Victoria Metropolitan
Train Load Survey Report, May 2016.
LOOKING
FORWARD
P011
www.vicpopulation.com.auPUBLIC TRANSPORT IN REGIONAL VICTORIA IS IN CRISIS
40
A world class public transport system should connect
all Victorians, including regional communities who rely
35
Growth in V/Line passenger journeys
30
on a fast and affordable rail network. But our growing (Excludes scheduled road coach journeys)
25
regional communities are being impacted by declining
No. (million)
20
performance in regional public transport services.
15
Daniel Andrews’ Regional Network Transport Plan failed 10
to outline what the government is actually going to do to
improve public transport beyond Ballarat and Geelong, and
5
0
13.6 million 2014/15
local people deserve better.
Improving accessibility of all services by investing in
infrastructure to expand passenger rail services and public bus Public Transport Patronage – Regional
services between communities will improve connectivity and Regional train and coach services Regional bus services
liveability for regional Victorians. Victorians need to be able to SOURCE: Department of Treasury and Finance, ‘Budget Paper No. 3: Service Delivery’*
commute smarter.
Regional rail patronage is
increasing dramatically Over the past 20 years,
Victorians are travelling by train more often, with V/Line
growth in V/Line passenger
journeys has increased by: 6.4 million 2004/05
138%
patronage more than doubling over the past decade, with
this trend expected to continue.
5.7 million 1994/95
SOURCE: Rail Futures Institute, ‘Introducing InterCity’, July 2016.
Liberal | NationalsV/Line V/Line services are unable to
Passenger frustration unleashed on Twitter
SOURCE: V/Line Staff Tweets Summer 2016
performance cope with the extra demand
lags. Perceptions of unsatisfactory reliability and punctuality are
BALLARAT COURIER
3 FEBRUARY 2016
‘widespread’ among most V/Line users, undermining the ability
of people living in regional communities to live and work
outside of Melbourne. To operate a reliable rail network, a more
rigorous level of operating discipline is required than the current
performance criteria.
V/Line Overall journey times have not improved, and the provision of
regional rail additional services will be hindered by capacity gaps. Significant
investment in infrastructure is required for future expansion.
crisis could SOURCE: Rail Futures Institute, Intercity Report, July 2016.
drag on for The final straw was in the V/Line crisis of summer 2016, where
months... customers complained of long delays, frustration, confusion and
misunderstandings.
HERALD SUN
3 FEBRUARY 2016
Rail Corridor Rail Distance Journey Time Typical commute
journey times
State’s Melbourne – Geelong 81km 60 mins in 2016
$50 million Melbourne – Ballarat 115km 75 mins SOURCE: Intercity,
Rail Futures Institute,
rail crisis. Melbourne – Bendigo 162km 110 mins August 2016.
Melbourne – Seymour 99km 85 mins
GEELONG ADVERTISER
10 FEBRUARY 2016 Melbourne – Warragul 100km 100 mins
LOOKING
FORWARD
P013
www.vicpopulation.com.auMORE VEHICLES ON THE ROAD The Eddington Report in 2008
identified the need for the East West Link
The first priority of our roads system must be to
ensure that Victorians can travel safely and spend less
Melbourne needs a genuine
time sitting in traffic and more time with their friends congestion busting project
and family.
The East West Link was already needed in 2008, when the
We need to be building better roads that are not just short- Eddington Report advocated for construction of a new 18 km cross
term fixes but will last the test of time and account for the city road connection, extending from the western suburbs to the
future needs of both metropolitan and regional Victorians. Eastern Freeway. In 2015 Infrastructure Australia conducted an audit
which stated that “...this corridor [Eastern Fwy to CityLink] had the
Melbourne roads are gridlocked highest 2011 road congestion delay cost in Melbourne, with a delay
cost of $73 million. This is expected to worsen by 2031.”
and congestion costs doubling
There has been a massive increase in road use over the last
70 years. The total number of passenger kilometres travelled in By 2031 congestion delay costs
Melbourne between 1945 and 2013 has gone up by around 600%.
This is at a time when Melbourne’s population has increased by on the Eastern Freeway to the
330% – from 1.3 million to 4.3 million. The vast majority of this
increase has come from private vehicle use.
CityLink corridor will double to
This trend shows no sign of slowing down. In the decade from $144 million.
2005 to 2014, the number of vehicle kilometres travelled has SOURCE: Australian Infrastructure Plan–Infrastructure Australia, February 2016.
increased by 16%.
SOURCE: Bureau of Infrastructure, Transport and Regional economics, Information
Sheet 60: Long–term trends in urban public transport, 2013.
600%
The total number of passenger
kilometres travelled in Melbourne
between 1945 and 2013 has gone
up by around:
Liberal | NationalsMORE CONGESTION, SLOWER TRAVEL
Average speeds are suffering and so Growth in passenger kilometres
NOTE (Values for ‘Mass
is Victoria’s productivity Mass transit Motorcycles Transit’ include all bus
travel, i.e. charter/
Commercial Vehicles Cars
At the same time as we have experienced changes in population growth and an increase in the hire and other private
use buses/minibuses,
total kilometres travelled by vehicles, we have also seen a dramatic and sustained decrease in the
Billion Passenger-kilometres
as well as UPT route
average travel speed on our road network. buses (which includes
SkyBus services. Values
Road and rail are crucial as part of state–wide transport corridors, with many dangerous roads putting for ‘commercial road
people’s lives at risk as people travel to and from their jobs and their homes. Every Victorian should vehicles’ relate to
have access to roads that are of high quality to make sure they are travelling on a safe transport non-freight use of
such vehicles). The
network and spending less time sitting in traffic. In regional Victoria, road quality is appalling.
source for this graph
Roads all across Victoria are in a dangerous state – affecting safety and economic development. is Cosgrove (2011)
ABS (2013 and earlier,
In the 2016 budget, there was no sign of the promised money for regional Victoria, whilst BITRE (2014) and
Road Operations and Network Improvements funding was cut by 3.4%. BITRE estimates)
SOURCE: 2016–17 State Budget, Service and Delivery, Budget Paper No 3.
Change in vehicle KMs travelled and change in population for each zone
Change in average speed on the monitored road network by time period in metropolitan Melbourne (2002 - 2012)
This VicRoads
AM peak PM peak analysis shows that
Inner Middle Outer
as our population
grows, people are
spending more time
in their cars and
travelling
more slowly.
SOURCE: VicRoads, ‘Traffic Monitor
2012–13’, September 2014.
Year
LOOKING
FORWARD
P015
www.vicpopulation.com.auUNABATED DEMAND FOR HOUSING...
As demand for housing grows, we need to ensure Impact of Net Overseas Migration Melbourne’s change in number of households by age group
there is enough supply to meet growing demand, and on Projected Household numbers
that there is a good mix of different types of housing 1,000
to give every Victorian the opportunity to own their NOM
=240,000
own home. 800
Population growth means 600
overwhelming demand for NOM
= Nil 400
dwellings required 200
The number of additional dwellings needed is dependant on the 0 500k 100k 150k 200k
level of population growth, and this in turn is significantly affected No. Households 0...LEAVING YOUNG PEOPLE STRANDED Home
ownership
The housing boom is pushing up house prices harder than
The pressure of a booming housing market means the next generation is struggling to get a foot in the
door. According to the 2010 Sustainability Report, “having access to affordable, secure, healthy housing is ever for young
fundamental to the well being of Australians.” The proportion of people owning and occupying their home has Aussies.
declined over recent years, due to a number of reasons, including:
NEWS.COM.AU, 21 AUGUST 2015
increased household mobility,
changing household patterns (e.g. couple partnering and having children later, adult children staying
in parental home for longer), and
economic factors, mainly the increasing cost of buying a home. Home
SOURCE: A sustainable population strategy for Australia, DELWP.
ownership
Over the longer term, an increase in housing supply would be expected to follow strong job growth
and population growth in a region, assuming there are no constraints on building appropriate
out of reach
new supply. SOURCE: State of Victoria, NRHC State of Supply 2014.
for young
Australians.
AUSTRALIAN FINANCIAL REVIEW
6 SEPTEMBER 2016
Regional Victoria is an opportunity for young Victorians
The opportunities to access affordable housing in regional Victoria where land and house prices are much lower than
metropolitan areas offer a great incentive for people to move to regional Victoria to assist to balance population growth
Young
across the state. Greater investment in regional housing, infrastructure and services is required however, to ensure that the Victorians
quality of life and standard of housing is available to meet the expectations of young professionals and families.
likely to miss
out on home
ownership.
HERALD SUN, 20 JULY 2016
LOOKING
FORWARD
P017
www.vicpopulation.com.auVICTORIA IS ALREADY CRACKING UNDER THE PRESSURE POPULATION TASKFORCE
MP calls for
EDUCATION growth plan.
With rapid population growth, we need more schools, and better ways of using our existing school resources to ensure every Victorian child has
access to a world class education system. With the cost of a primary school estimated at $15 million, and more than double that for secondary
PROGRESS LEADER
school, a budget allocation of $3–6 billion is required to build government schools. This doesn’t include the cost of maintaining existing schools. 19 APRIL 2016
SOURCE: Goss, Should you worry about a schools shortage? It really depends on where you live, The Conversation, 22 January 2016.
ENERGY
Every Victorian should have access to affordable, efficient and reliable electricity to heat and cool their homes. With the imminent closure of the
Hazelwood power generator, Victorian electricity prices are forecast to rise, increasing the cost of living. This also risks Victoria’s energy security in the
future. The ACCC’s recent report into the energy sector found that “...new supplies from new producers are vital to promote competition and to ensure
supply into the future.” Victoria’s gas industry needs reform, yet the current Government was the only state not to sign up to a national gas strategy at School need
a recent COAG energy council meeting. Without such reforms, future prices will rise and supply will tighten.
SOURCE: The Hon. Josh Frydenberg MP, 19 August 2016; CME “Projected retail price impacts associated with Hazelwood closure”.
on agenda.
DANDENONG LEADER
WATER 18 JANUARY 2016
As our population grows, the government must ensure that every Victorian has access to clean and plentiful water. Water management is one
of the most important policy areas for government. Following significant rainfall, and water storage levels at more than 70% (rated in the
secure high zone), the Andrews Government has placed an order for water from the desal plant at a cost of $27 million to Melburnians. This is in
addition to the $608 million for annual service payments for the desal plant.
SOURCE: Essential Services Commission, Victorian Urban Utility Benchmarking 19 January 2015.
Our central
JOBS
The ABS labour figures from July told us what we already know – some of Victoria’s regions are doing it tough when it comes to jobs. problem.
The region of Latrobe-Gippsland has experienced a surge in the number of unemployed people since December 2014, from 6.1% to
WEEKLY TIMES,
8.5%, or 2,763 people. However, this only tells part of the story. The number of full-time jobs has dropped by almost 10,000 and
the overall labour force numbers have gone down by over 5,000. The imminent closure of Hazelwood power generator will only
17 AUGUST 2016
exacerbate this problem.
SOURCE: ABS, Labour Force, Australia, Detailed, July 2016.
HEALTH
Our health system should be high quality, responsive and affordable so all Victorians can access the health services they
need and live healthy and happy lives. Ambulance Victoria’s annual report showed that patients in regional Victoria are still Jobs gap must
particularly disadvantaged with response times well below targets. 21 regional and rural local government areas are not
meeting response time targets half of the time, putting people’s lives at risk. The Annual Report shows that fewer patients be closed.
are being transferred within 40 minutes from the ambulance to the emergency department compared to last year.
SHEPPARTON NEWS
SOURCE: Ambulance Victoria 2015-2016 Annual Report.
16 AUGUST 2016
Liberal | NationalsABOUT THE TASKFORCE
We need to seize the opportunities this unprecedented Key areas of Taskforce
population growth will have for all Victorians member expertise
In April 2016, the Leader of the Opposition, Matthew Guy, announced the formation of the Victorian
Population Policy Taskforce. In articulating his vision for the Taskforce and the future of Victoria, Demography
Matthew identified management of population growth as the biggest challenge Victoria faces today.
Housing and Property
With the announcement of the Taskforce, the Liberal Nationals have committed to developing a clear
strategy to manage Victoria’s population growth, to seize the opportunities and challenges it brings Urban Planning and Development
for the economic prosperity and social wellbeing of all Victorians. The dimensions of total Australian
population growth has been examined by the Productivity Commission in a report tabled in September Economics
this year (Migrant Intake Into Australia). This report provides a basis to estimate the likely population
growth in Victoria and the likely impact of such growth. We will take the estimates provided in the Roads, Rail and Infrastructure
report and examine the manner in which the Liberal Nationals can provide policy settings to facilitate
optimal sustainable growth in Victoria. Local Government Authorities
The Taskforce will consult extensively, and report back to the Liberal Nationals, setting out a range
Sustainable Regional Development
of recommendations. The report of the Taskforce will form the basis of detailed policy
recommendations that the Liberal Nationals will incorporate into policy platforms to present to the
Community Support
community before the next election.
Members of the Taskforce have been selected to ensure a broad range of experts, experienced in Sustainability
every facet of population growth, so that the best possible outcome is achieved.
LOOKING
FORWARD
P019
www.vicpopulation.com.auTHE TASKFORCE’S BRIEF
As Victorians, we want our state to flourish and remain the best state in Australia
to live. To achieve this, the government must create appropriate policy settings that
Key areas of relevance include:
foster this growth so it benefits all Victorians, and consult widely with the community. Growing the entire state through regionalisation Provision of services
Jobs and economic development Transport, connectivity and infrastructure
The effect of changing demography in Victoria, both from increased population and the
H ousing, housing affordability and including tackling congestion
ageing of that population, affects four domains:
urban planning Sustainability
Economic growth and productivity
Management of Victoria’s population growth in a sustainable way can only be achieved with pre–planning,
Liveability
careful analysis of policy settings, and other mechanisms necessary for efficient and optimal outcomes.
Social inclusion
Environmental sustainability The obvious strategy to reduce pressure on Greater Melbourne is to develop the regions. This assumption
needs to be tested by developing services and an efficient and reliable commute to Melbourne.
To adequately manage this demographic shift in a rapidly growing population, the Liberal
Nationals recognise that incremental policy adjustments will be required across many domains The taskforce will recommend ways to encourage and incentivise population of all ages, socio–economic
to prevent a population crisis. Through wide consultation, innovative solutions can be formed to levels and ethnicities to settle in regional areas. This will enhance the lifestyle of those regions, reduce
circumvent a situation that spirals out of control. pressure on and improve liveability of urban and peri–urban areas, as well as optimising the potential for
economic growth. With a strategy of developing corridors of economic activity rather than just economic
The Liberal Nationals see population growth as an opportunity rather than a burden, and the centres, commuter and economic movement in both directions will be achievable.
Victorian Population Policy Taskforce will work with the Liberal Nationals on how Victoria can
optimise these opportunities. Questions to be answered:
• What defines a sustainable regional centre? • What investments in seed infrastructure
The Taskforce’s brief is to formulate recommendations across many policy areas, intersecting
• How can government agencies be used to are required?
multiple government departments, with a key focus on examining the costs associated with
encouraging people to live in the regions. This will incorporate recommendations about foster change? • Where are the areas of “Social Benefit”?
how a future government can implement policies to maximise the benefits of population • What have other countries done? • How can this development best preserve
growth overall and include the analysis of the likely impact of such growth on existing • Where are the gaps in existing infrastructure? the environment?
work opportunities in communities and the costs of government services that will be
needed, to support the initiative. The efficacy of various management and funding models in the current low interest rate environment
and the loss of confidence in the Victoria to complete projects will be examined by the Taskforce. The
The Taskforce will analyse relevant data, review Plan Melbourne and current Taskforce may identify areas where it considers business is more likely to provide an effective investment
Victoria in Future forecasts. Ultimately, it is all about protecting our liveability outcome than government, thus providing the opportunity for business to partner with government and
well into the future. communities in new projects.
Liberal | NationalsREACHING OUT TO ALL VICTORIANS
The Taskforce is looking for the involvement of as many people as But, above all, we value the involvement of members of the ONLINE
possible. We want to engage groups from across society. We want public, from communities all across Victoria. Visit the Victorian Population Policy Taskforce
representation from across all of Victoria. online at www.vicpopulation.com.au for info on
The Liberal Nationals Population Policy Taskforce will be meeting
the Taskforce, its members and activities, how to
with stakeholders from local government bodies in inner–urban, HERE’S HOW YOU CAN HAVE YOUR SAY: make submissions and latest news.
outer–metropolitan and regional areas to hear their concerns • Visit www.vicpopulation.com.au and follow the links to
the submissions page REGIONAL FORUMS
and ideas.
Regional forums will be an important opportunity for
In addition, we will also be sitting down with key experts • Email Taskforce Chairman, Tim Smith, directly at local communities to come together and engage with
from transport, industry and business, regional, and other tim.smith@parliament.vic.gov.au the Taskforce.
organisations to map out potential ways forward. • Send your thoughts to Suite 1/400 High Street Kew 3101 Regional forums will be held in outer–urban and regional
areas. Details of these forums will be available on the
Taskforce’s website.
Melbourne from the International Space Station 2013. SOURCE: NASA
LOOKING
FORWARD
P021
www.vicpopulation.com.auAuthorised by Tim Smith MP, Suite 1, 400 High Street, Kew.
Printed by Blueprint, 225 Ingles Street, Port Melbourne. www.vicpopulation.com.au
Paid for by the Liberal Party of Australia – Kew SEC
Liberal || Nationals
Liberal NationalsYou can also read