AUDITED RESULTS FOR THE YEAR ENDED 30 JUNE 2021 - Discovery
←
→
Page content transcription
If your browser does not render page correctly, please read the page content below

AUDITED RESULTS FOR THE YEAR ENDED 30 JUNE 2021

Global Network

                                                                                                                                                                                                                    USA

                Discovery Health

                                                                        Discovery Insure
                                                     Discovery Invest

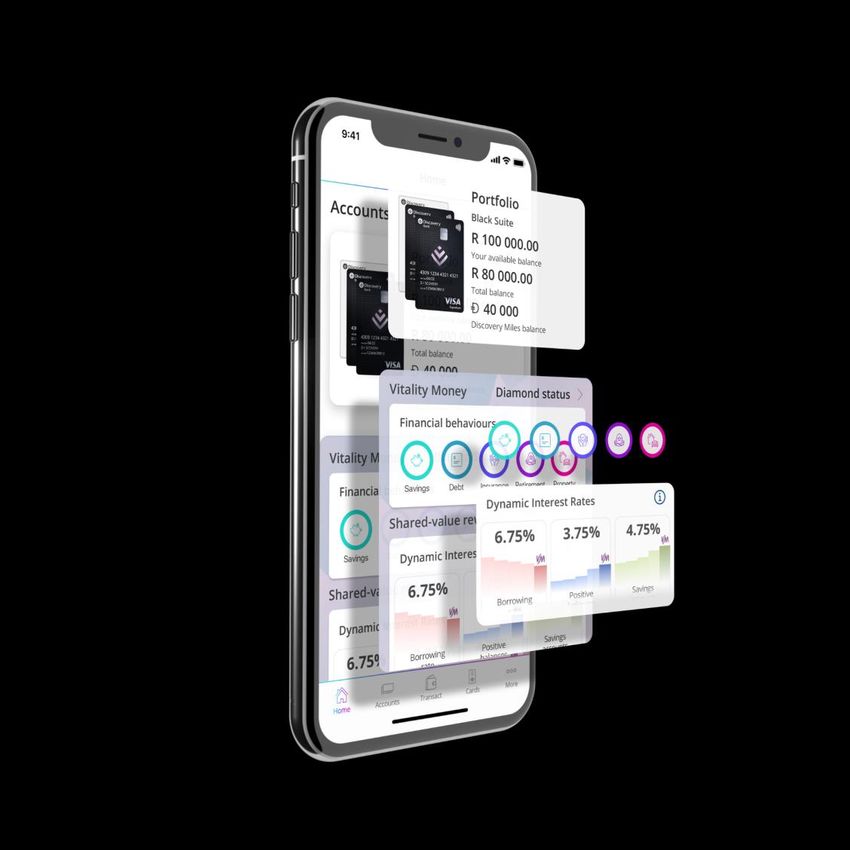
                                                                                           Discovery Bank

                                                                                                                Vitality Health
                                    Discovery Life

                                                                                                                                                  Vitality Invest
                                                                                                                                  Vitality Life

                                                                                                                                                                    Vitality Car
Life COVID-19                      New business                                                               Normalised                                                NHE before forex              Normalised          Headline
  provisions                                                                                                operating profit                                                impact                 headline earnings      earnings

R2.8bn                             +11%                                                                        +7%                                                                 +12%                 -9%               +909%
                                   to R22 595m                                                                to R6 494m                                                           to R3 711m          to R3 406m         to R2 986m
                    +9% core new business API, i.e. excluding DH
                    take-on of new closed schemes and gross
                    revenue for Vitality Group

                                                                                                                                                                                                                                       2
The period under review

                          Navigating the significant impact of COVID-19; meeting our
     Navigating
 1   COVID-19
                          core purpose and serving society by ensuring quick and
                          efficient vaccination of all South Africans

     Resilient            Resilient performance with operating profit up 7%, new
 2   operating            business up 11% and actuarial dynamics in line with
                          expectation
     performance

                          Capital strength and liquidity remained a key focus - all
     Capital strength
 3   and liquidity
                          metrics above target and with sufficient buffers
                          Require capital for Ping An Health to support business
                          growth and product diversification

     Three                A pivot to growth by capitalising on the applicability of the

 4   dimensions
                          Vitality Shared-value model to ensure:
                               a)   Organic growth
     of growth                 b)   Geographic growth
                               c)   Platform-led growth

                                                                                          3
1
Navigating COVID-19 and
meeting our core purpose
Our strategic response to the pandemic

  Employee vaccine                          Structural and pricing                              Central role in state-led
  mandate                                    changes to products                                    COVID-19 response
  Implement mandatory vaccination         Preferred premiums for vaccinated DL                               9 DH vaccination sites
  policy from 1 January 2022                           members                                                 1 000 staff deployed
  DSY offices and sites become               Product incentives to vaccinate                   >550 000 vaccinations administered
  vaccination-only zones                                                                        - c5% of total national vaccinations
                                                                                                    cR200m allocated to campaign
                                                                                                            (R42m in this period)

                             Protect            Protect and support our            Support
                            our people                   clients                 our country

                                    Maintain financial strength and resilience

                                      R2 800m Life provisions across the Group
                                 R2 448m DL earnings impact for period under review

                                                                                                                                       5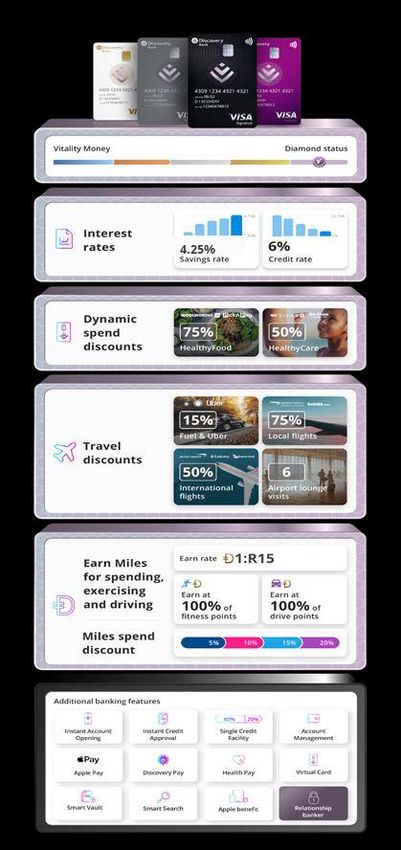
COVID-19 in South Africa was worse than predicted

DSY predicted the                DSY underestimated the peak of Wave 2 and the timing and extent of Wave 3
first wave well
                                 Deaths (90% excess deaths)
 Initial predicted deaths to
                                               Orig.                         Beta                         Delta
 Dec 20, at May 2020
                                  16,000
                                                              Infectious variant coincided with    Delay in vaccination
  87k            Discovery
                 medium           14,000
                                                              holiday season
                                                              CFR for Beta variant higher
                                                                                                   programme
                                                                                                   Higher proportion of
                                  12,000                                                           infections in younger

  48k            ASSA
                 Scenario 1       10,000
                                                                                                   age groups

                                              90% excess                                   DSY

  50k                                                                                 prediction for
                                   8,000
                 Government
                                                deaths
                 model                                                                 current FY
                                   6,000

  12k            PANDA
                                   4,000

                                   2,000

76k
                 Actual deaths        -
                 (90% Excess
                 deaths)

                                                                                                                           6
SA’s epidemic was 5x worse than the UK’s
160,000 16,000 450,000 9,000
Deaths (90% excess)
New cases
New cases
Deaths
140,000 14,000 400,000 8,000
350,000 7,000
120,000 12,000
300,000 6,000
100,000 10,000
Vaccinations
80,000 8,000
250,000
decouple 5,000
200,000 infections 4,000
60,000 6,000
150,000 and deaths 3,000
40,000 4,000
100,000 2,000
20,000 2,000 50,000 1,000
- - - -
20200503
20200517
20200531
20200614
20200628
20200712
20200726
20200809
20200823
20200906
20200920
20201004
20201018
20201101
20201115
20201129
20201213
20201227
20210110
20210124
20210207
20210221
20210307
20210321
20210404
20210418
20210502
20210516
20210530
20210613
20210627
20210711
20210725
20210808
20200503
20200517
20200531
20200614
20200628
20200712
20200726
20200809
20200823
20200906
20200920
20201004
20201018
20201101
20201115
20201129
20201213
20201227
20210110
20210124
20210207
20210221
20210307
20210321
20210404
20210418
20210502
20210516
20210530
20210613
20210627
20210711
20210725
20210808
Infections Deaths Infections Deaths
Deaths Implied % population Deaths Implied % population
IFR Population IFR Population
(90% excess) infections infected (90% excess) infections infected
0.39% -
0.5%
215k 45m 60m 70% - 80% 1.09% 132k 12m 68m 18%
Given SA’s younger age profile, expect deaths to be 64% lower, but when adjusting for population size
(12% smaller) the data indicates epidemic currently 5.5x worse than UK
7
Factors that influence COVID-19 waves

         COVID Wave                                      =      (1-Immunity)                     x        P(contact)                    x         Risk index

                                                             Population      70%-80%                  Behaviour     Mobility
                                                                                                                    Social distancing
                                                                                                                                            Resilience index
                                                             immunity        of the population                      Mask wearing
                                                                             infected                                                       Life COVID-19 mortality rate by
                                                                                                                                            Vitality status
                                                             Reinfection     20%-25%                  COVID-19      Unknown
                                                             rates           of the population        variants
                                                                             re-infected

                                                             Vaccines        24%                      Community     Changing
                                                                             of the population        prevalence
                                                                             vaccinated
                                                                             >90%
                                                                             effective in
                                                                             reducing death

                       1       Risk of (re)infection                       At least 40% of the population are still vulnerable to new or reinfection

                       2       Reduced vulnerability                       Vaccinated and previously infected people have far higher levels of protection
                                                                           New variants are emerging constantly, e.g. C1.2. Awaiting data but probably lower
                       3       New variants                                risk than Delta
                       4       Vaccination                                 Significant additional protection against severe disease and death
                                                                                                                                                                              8
https://sacoronavirus.co.za/latest-vaccine-statistics/
Data supports efficacy of vaccination against COVID-19
COVID-19 vaccination reduces Vaccine is >90% effective in reducing death
risk of mortality relative to Discovery Health data on vaccine effectiveness*
influenza1
Confirmed
Deaths per million of the population Admission High care/ICU Death
infection
Reduction in Reduction in Reduction in Reduction in
50-80% risk relative to 70-85% risk relative to
unvaccinated
70-90% risk relative to >90% risk relative to
unvaccinated
unvaccinated unvaccinated
100 100 100 100
1 813
90 90 90 90
80 80 80 80
70 70 70 70
8-10x 60 60 60 60
impact of flu 28% 50
40
50
40
50
40
50
40
reduction if 30 30 30 30
vaccinated
20 20 20 20
208 150
10 10 10 10
0 0 0 0
Without a Influenza With a COVID J&J Pfizer J&J Pfizer J&J Pfizer J&J Pfizer
COVID vaccine vaccine
J & J 28+ days since vaccination2
Pfizer 7+ days - second dose3
1 Surveillance of influenza and other respiratory viruses in the UK Winter 2019 to 2020
2 Sisonke and SAMRC, test negative refreshed to 17 July 9
3 Test negative study refreshed to 15 August *Excludes data on members vaccinated in the public sector. To be submitted for peer review and publication
Demand generation is paramount to ensure capacity utilisation
Vaccination Profile (doses) Stock Profile Slow take up in Discovery clients
younger cohorts vaccinated* by age band
350 -
168
154
231
212
185
140
204
250
325
315
275
355
320
370
Constraints Delivery schedule First dose ramp up per age group
Supply Demand 18
80% 80%
Millions
2.5 16 76%
Millions
Millions
70% 70%
Millions
14 65%
2.0 60% 60%
12 55% 54%
9 weeks 50%
50%
1.5 10
6 weeks 7 weeks
40% 40% 40%
8
1.0 4 weeks 4 weeks 30%
6 30%
25%
5 weeks 22%
4 20% 20%
0.5
2 10% 10%
4%
0.0 0 0%
0%
2-Aug
16-Aug
30-Aug
13-Sep
27-Sep
8-Nov
5-Jul
11-Oct
25-Oct
19-Jul
2 Aug
16 Aug
30 Aug
13 Sep
27 Sep
06 Dec
5-Jul
19 Jul
08 Nov
22 Nov
11 Oct
25 Oct
10-May
24-May
21-Jun
19-Jul
2-Aug
16-Aug
30-Aug
7-Jun
5-Jul
10-May
24-May
21-Jun
19-Jul
2-Aug
16-Aug
7-Jun
5-Jul
60+ 50-59
J&J Pfizer first Pfizer second J&J Pfizer
35-49 18-34
>101k Outbound calls
Underutilised Daily doses based >19m Emails and SMSes sent
xx
capacity on a 6 day week
*partial or fully
10The likelihood of a mortality impact in the 4th wave is low
4th wave depends on the R factor and proportion of people Encouraging Discovery population
infected. Given the high infection rate, together with vaccines, to get vaccinated
higher 4th wave mortality would require very high assumed R1
National incremental deaths scenarios Actual % vaccinated
FY20 FY21 FY22 At least partially
2,000
vaccinated Fully
vaccinated
1,800 Total Members
90% excess
Low Medium High
No over age 60
deaths Vaccine lives over age 60
1,600
Total (k) 235 240 245 265 Health 51.2% 76.2% 64.4%
1,400
Individual
1,200
Life2 61.8% 76.6% 62.1%
1,000
Group Life2 51.1% 78.4% 62.8%
800
Aiming to vaccinate
600
400
>80% 60+yrs members by end September
200
>80% whole book by end 2021
- 100% take-up of the 2nd dose where applicable
20200201
20200219
20200308
20200326
20200413
20200501
20200519
20200606
20200624
20200712
20200730
20200817
20200904
20200922
20201010
20201028
20201115
20201203
20201221
20210108
20210126
20210213
20210303
20210321
20210408
20210426
20210514
20210601
20210619
20210707
20210725
20210812
20210830
20210917
20211005
20211023
20211110
20211128
20211216
20220103
20220121
20220208
20220226
20220316
20220403
20220421
20220509
20220527
20220614
20220702
20220720
20220807
20220825
20220912
20220930
20221018
20221105
20221123
20221211
20221229
1 R assumption peaks at 1.5 in Medium, 1.6 in High and 2.0 in New variants 11
2 Sum assured weightedIntent to implement mandatory vaccination policy from 1 January 2022
>220k excess deaths since May 2020 >30k
Unprecedented health tragedy; with the fourth
1 wave posing further risk
>14k client deaths
20 employee deaths
Lives saved if >60%
population vaccinated
over coming months
Compared to those who are unvaccinated:
890k vaccinated
enhance and protect their lives 300k individuals outside of this
6 Supported by a legal obligation to protect and safeguard all employees from all potential risks
12Increasing the COVID-19 provision in SA, and releasing in the UK
Discovery Life Vitality Life
Provisions and positive lapse experience in Individual Life more than sufficient to cover in- Provisions more than sufficient
period COVID-19 claims, net loss recorded in Group Life due to UK’s effective and early
vaccine campaign
Income statement impact COVID-19 provisions COVID-19 provisions
500
(R2 448m) (R1 058m) R2 693m
0
£28.8m
-500 R2 160m
-1000
-1500
-2000
-2500 £5.4m
-3000
Individual Life* Group Life New AURR Group FY21 earnings FY20 earnings
individual Life Life impact impact
30-Jun-20 30-Jun-21 30-Jun-20 30-Jun-21
provisions
net of
In period COVID-19 margins
impact net of provisions
and lapse gains
R2 800m Life provisions across the Group
R2 448m DL earnings impact for period under review
13
*Claims provision release of R1175m + lapse gain of R831m minus identified COVID-19 claims of R1673m2
Resilient
operating performanceResilient performance
+7% +11%
R6.5bn R22.6bn
Operating profit New business
Continued operational excellence, growth in DHMS lives and providing significant support
Health 3 423 +7% 6 453 +6%* to members and society
Significant negative COVID-19 mortality impact but delivering positive actuarial variances
Life 1 341 -55% 2 264 -1% through excellent retention experience and maintaining financial strength
Strong earnings growth, retention and excellent investment returns for customers. New
Invest 1 084 +31% 2 737 +3% business growth curtailed by lower guaranteed plan sales
Strong new business growth and robust underwriting performance with earnings impacted
Insure 250 +2% 1 287 +18% by lower investment yields
>81 000 Strong high-quality client and deposit growth while deliberately pursuing a prudent,
Bank (1 094) -7% New-to-Bank +86% quality-focused credit strategy
clients
Robust operating performance driven by continued good retention. Careful management
Vitality Health 953 +15% 1 367 +10% of delay of elective healthcare in the COVID-19 environment
Strong recovery, strengthening of underlying actuarial basis and successful execution of
Vitality Life 644 +337% 1 141 -9% management plan. New business slowed with lockdowns and the focus on quality business
Robust growth due to increasing integration and traction with existing partners and
Vitality Group 417 +35% 1 270 +12% accelerating roll-out to new markets and adjacencies
Focus on profit quality and scale through both distribution channels and product
Ping An Health 411 +126% 3 938 +10% diversification. Capital injection to support long-term growth
Other New (978) -7% 2 114 +156% Lower spend combined with excellent growth in new business API
15
*Including new closed schemesOperating profit and New business
Operating profit New business
Before SA COVID-19 impact Including new closed schemes and Vitality Group
Recovered from 2020 COVID-19 Emerging and New growing strongly
impact, 8% CAGR on 2019
10,000 +25% 38%
25,000
+11% 25,000 Emerging
and New
8,000 +5%
20,000 +14% 20,000 11% Emerging
+7% +10% Emerging
and New
and New
6,000
15,000 15,000
4,000
10,000 10,000
Established
2,000 5,000 5,000
- - -
2017 2018 2019 2020 2021 2017 2018 2019 2020 2021 2017 2018 2019 2020 2021
Operating profit COVID-19 impact
Health Life Invest Vitality
SA mortality
VH VL Emerging New
16Resilient operating performance, actuarial dynamics
within expectation
Health Life Invest Insure Health Life
Paid up
98% 76% 76% 92% 88% 72%
150% 150% 150% 150% 150% 150%
– vs expected
Lapses
100% 100% 100% 100% 100% 100%
50% 50% 50% 50% 50% 50%
0% 0% 0% 0% 0% 0%
Nov
Jan
Jul
Sep
Mar
May
Nov
Jul
Jan
Sep
Mar
May
Nov
Nov
Nov
Nov
Jul
Jan
Jul
Jan
Jul
Jan
Jul
Jan
Sep
Sep
Sep
Sep
Mar
May
Mar
May
Mar
May
Mar
May
Withdrawals
91% 100%1 82% 98% 84% 102%2
150% 150% 150% 150% 150% 150%
– vs expected
Claims
100% 100% 100% 100% 100% 100%
50% 50% 50% 50% 50% 50%
0% 0% 0% 0% 0% 0%
Nov
Jan
Jul
Sep
Mar
May
Nov
Jan
Jul
Sep
Mar
May
Nov
Jan
Jul
Sep
Mar
May
Nov
Jan
Jul
Sep
Mar
May
Nov
Jan
Nov
Jan
Jul
Jul
Sep
Sep
Mar
May
Mar
May
FY AvE
1 Individual Life, excluding identified COVID-19 claims 17
2 Excluding identified COVID-19 claimsReported profit for period affected by foreign exchange movements
12 months 12 months
Rm ended ended %
Stabilisation of long term interest
Jun 2021 Jun 2020
rates in SA and the UK resulted in
Normalised profit from operations 6,494 6,069 7% materially lower economic basis
1
Economic assumptions adjustment DL -411 -3,635 changes than the prior year, R4.3bn
1
Economic assumptions adjustment VL -108 -1,195 swing
Finance charges excl. 1DP finance lease -1,291 -1,218
Unrealised (losses)/gains on foreign exchange contracts not designated as a hedge -304 263 Mark-to-market foreign currency
2 losses arising from a recovery of the
Foreign exchange (losses)/gains -389 578 2 Rand during the reporting year
Deferral fees related to Prudential Book transfer -187 -71 compared to a gain in the previous
Investment income and fair value remeasurements 83 338 financial year, R1.5bn swing
3 Dilution gains from equity accounted investments 554 3
Other -234 -609 Unrealised gain from the transaction
Profit before tax 4,207 523 704% 3 in which Cambridge Mobile Telematics
Tax -987 -347 (CMT) acquired TrueMotion
Profit attributable to preference and minority shareholders -63 -79
Profit attributable to equity holders 3,157 97 3155% Due to the continued uncertainty and
potentially volatile economic environment
Headline adjusting items -171 199
caused by the COVID-19 pandemic, the
Headline earnings 2,986 296 909% Discovery Board has decided to retain its
Economic assumptions adjustment (DL and VL) 383 3,584 prior stated position during the pandemic
Other normalisation adjustments 37 -133 and has decided not to declare an ordinary
Normalised headline earnings 3,406 3,747 -9% final dividend for the period ended 30 June
2021. The reintroduction of an ordinary
Forex exchange (gains)/losses net tax 305 -424
dividend will be considered on an ongoing
Normalised headline earnings excl forex impact 3,711 3,323 +12%
basis
183 Capital strength and liquidity
Group is well capitalised and highly liquid

                                                                                                                               Highly liquid across                 Sufficient liquidity
Strongly capitalised                                          FLR is within target                                             the Group2                           at the centre
                                                                                                                               Liquid excess assets above minimum
                                                                                                                               regulatory capital requirements
                                                               FLR                                                              R millions                          SA Liquidity3 , R millions
                         Jun 20         Jun 21
                          Cover          Cover
                                                                29%                                     28%                       15,000                            2,000

Life                       1.8x           1.8x                  27%

                                                                                                                                                                    1,500
Insure                     1.8x           1.8x                  25%

VH                         1.7x           1.6x                  23%
                                                                                                    25.7%                         10,000

                                                                                                                                                                    1,000
                                                                21%
VL                         2.0x           2.4x
                                                                                                                                   5,000
                                                                19%
                                                                                                                                                                     500
Bank1                      1.6x           1.4x
                                                                17%

PAH                        1.9x           2.3x                  15%                                                                       -                            -
                                                                        FY17 FY18 FY19 FY20 FY21                                              FY18 FY19 FY20 FY21           FY18 FY19 FY20 FY21
DHMS solvency                         36.9%

1 Capital Adequacy Ratio
2 Considers SA Liquidity and liquid excess assets for Discovery Life, Discovery Insure, VitalityHealth, VitalityLife and Discovery Bank                                                           20
3 SA cash + undrawn committed facilities
Cash generation positive prior to COVID-19
Gross Life
Cash Cash
COVID-19 Funding
generated used
claims
R13.0bn
Cash generated from in-force
R3.0bn R1.0bn
R14.3bn
Vitality Life
Net cash Tax and finance
generated from Vitality Health Debt costs
Cash used net of funding
in-force business Reinsurers
R2.6bn
R13.0bn Discovery Life New business
R7.9bn
and Invest
(R1.3bn)
Net cash flow Discovery
Health
New businesses
R1.8bn
Net cash flow1
R1.3bn
1 Movement in shareholder free cash 21Group Embedded Value
4.6%
Annualised ROEV
11% excluding COVID-19, Group revenue
~25%
forex and economic changes
total adjusted revenue1
attributable to Emerging and New
R78 608m
Rm
R74 645m 70,000
60,000
R70 834m 50,000
40,000
30,000
20,000
10,000
-
Opening EV Value of new Unwind of risk Non-Economic COVID-19 Operational EV Economic Forex Other Closing EV 2017 2018 2019 2020 2021
business discount rate Experience impact Experience
Variances and Variances and Total Group
Methodology & Methodology & Group excl Emerging and New
Assumption Assumption
Changes Changes
22
1 Including 25% Ping An Health earned premium and Bank NII and NIR and excluding insurance premium revenue from the Invest segments4
Three dimensions
of growthSignificant increase in ecosystem strategies globally
Blurring of boundaries Insurtech and ecosystem Many have invested substantially into
in these three trends strategies are increasing health ecosystems2
Record quarter for insurtech xx Health funding in EUR m Core business Funded health start-ups
investment activity1 Funded start-ups from other ecosystems (mobility, housing, education, B2B services)
3,000
USD m
2,500
Mortality
The rise of digital 2,000
Morbidity
Ways of work 1,500
Driving 1,000
Ecommerce
Investing 500
Telemedicine
Banking -
Contactless Q1 Q2 Q3 Q4 Q1 Q2 Q3 Q4 Q1 Q2 Q3 Q4 Q1 Q2 Q3 Q4 Q1 Q2 Q3 Q4 Q1
2016 2017 2018 2019 2020 2021
ESG
Moral money
Climate change Number of mentions of ecosystems in
Social movements leading European insurers and medtech
providers2
76%
p.a.
Sample of 20 large insurers globally have strategically invested into
various ecosystems over the last few years, with health being a
prominent theme (32% of investments)
8x 16x 20x 40x 77x
(of 2/20) (of 4/20) (of 5/20) (of 10/20) (of 11/20)
1 CB Insights 24
2 McKinsey 2021Evolving the business model to an ecosystem
Ecosystem
Composite
Institution
Health Life Invest Motor Bank
Institution
Platform
Platform
“Make people healthier”
25Three dimensions of growth
1 2 3
Organic growth Geographic growth Platform-led growth
ESTABLISHED
Institution
EMERGING
Platform
NEW
Grow organically Expand the Vitality global insurtech
Grow globally with the ability to platform
Build new businesses that scale
repeat and scale
Achieve superior returns on capital Create superior institutions
261 Organic growth
Operating profit
10,000 +13% +3% +0%
+15%
+15%
to Established
businesses
R9.9bn
-13% -1%
5,000
ESTABLISHED remain robust
(-1% to R7.5bn)
-
2017 2018 2019 2020 2021
After COVID-19 impact COVID-19 impact SA mortality
1,500
Emerging
1,000 +74%
+46%
+46% businesses
500
+94% to
are scaling
EMERGING -
-500
2017 2018 2019 2020 2021
R1.1bn rapidly
% in New*:
5% 7% 14% 24% 19% New
Turning point
5% 8% 17% 31% 23% Old definition
NEW
- in the spend
-1,000
-2,000
R2.0bn on New
-3,000 businesses
2017 2018 2019 2020 2021
*Pre-COVID-19 impacts 27
New definition is as % of core (Established and Emerging) instead of total operating profitEmerging businesses are growing rapidly and achieving good returns
Insure Ping An Health Vitality Group Strong growth from Emerging
+2%
Operating profit Operating profit Operating profit
Operating profit Rm
1,200
1,000
800
600
400
200
-
-200
2017 2018 2019 2020 2021 2017 2018 2019 2020 2021 2017 2018 2019 2020 2021 2017 2018 2019 2020 2021
10.4%
ROE ROE ROE
14.5%
ROE
28
Normalised RoE in local currency, and only considers Emerging parts of business – Insure excludes CMT and VG excludes new initiativesNew businesses are seeing considerable traction
Bank Vitality Invest Vitality1 DBI Umbrella Funds
+86%
New-to-Bank Clients
+75%
New business (£m) New markets launched
+52%New business
+290%
New business
FY20-FY21
90,000 40 200 1,400
Millions
Millions
80,000 180
35
1,200
160
70,000
30
140 1,000
60,000
25
120
50,000 800
20 100
40,000
600
80
15
30,000
60 400
10
20,000
40
200
10,000 5
20
- 0 0 0
FY19 FY20 FY21 FY19 FY20 FY21 FY19 FY20 FY21 FY19 FY20 FY21
292 Geographic growth
Operating profit 8,000
Operating profit
+9% 2,000 +334%
-5% +1% +6%
7,000
1,500
+12% -61%
+84%
+6% to
6,000
1,000
5,000 -15%
R7.1bn 4,000
-17%
500
(-17% to R4.7bn) 3,000 -
2017 2018 2019 2020 2021 2017 2018 2019 2020 2021
After COVID-19 impact COVID-19 impact
SA mortality
DBI Umbrella Funds VG New
303 Platform-led growth
BEHAVIOURAL DESIGN GLOBAL INTEGRATED PARTNERS
INCENTIVE LAYER
Pre-commitment Nudge theory Loss Aversion Resonance design
PREDICT INTERVENE
Next-best Gateway
BEHAVIOURAL LAYER action model Portal
FUTURE HEALTH
GLOBAL DATA ENGINEERING
300k >50m >3.5m 13bn
New members Life years of Device tracking km tracked
DATA LAYER every month behavioral linked events a week HEALTH
insurance data
INSURANCE PRICING BEHAVIOURAL VALUE MATCHING
Device- Dynamic Wedge ABC
PRODUCT LAYER led pricing funding pricing
Net VIF uplift model
VITALITY 1 PLATFORM ENABLEMENT MOBILE CONTENT MANAGEMENT
Enables instant multi-language
TECHNOLOGY AND ANALYTICS LAYER World-class technology platform Transforms Vitality customization
launches
ENHANCED INSURANCE
Attract Price Change Behaviour Retain
VALUE CHAIN
PREDICT VALUE INTERVENE
31Platform seeing good engagement and growth
Platform income* Customer engagement Shared Value outcomes
Actuarial value – initial selection, better retention, improved
R4.0bn claims, lower prices, selective lapses
Shared Value to
41m
Claims ratios by status
+8% Impacted lives
Life
customers in FY21
30 Markets
Insurance
SA UK Market A R4.6bn
Revenue through the platform
(Rm)
12bn Average steps per
day
Health
Insurance SA UK
245
3.5m Workouts logged
per day Long-term 1,864 2,499
Savings
4k New devices
registered per day
Motor
20k Health assessments
per day
Insurance
Premium discounts
600k
Cash backs
2019 2020 2021 Goals achieved per
week Banking Boosts
Offshore SA Arrears Blue Bronze Silver Gold and
Diamond
32
*Platform income made up of Vitality membership premiums and Vitality Group revenueManifesting as unique composites and partnerships
Global Network
USA
Discovery Health
Discovery Insure
Discovery Invest
Discovery Bank
Vitality Health
Discovery Life
Vitality Invest
Vitality Life
Vitality Car
1 Perfect composite model, #1 in every industry, and the Bank pivoting to growth as the composite-maker within SA
2 Best-in-breed products across businesses and operating as a fully integrated composite business with a seamless
One Vitality client journey. A successful entry into motor insurance
3 Ping An Health delivers on its plan to become the leading health insurer in China with over 50m clients
4 Vitality is the world’s largest and most sophisticated behavioural platform linked to financial services
33Discovery Health
Discovery Insure
Discovery Invest
Discovery Bank
Discovery Life
Strong high-quality client and deposit
growth while deliberately pursuing a
prudent, quality-focused credit strategy
34Discovery Bank
Total clients Total accounts Retail deposits Advances Spend
362k 649k R8.2bn R3.8bn R20.2bn YTD spend
R8.2bn
4,000,000,000.00
R3.8bn
649k R20.2
362k R3.6bn
3,500,000,000.00
505k
3,000,000,000.00
307k 2,500,000,000.00
2,000,000,000.00
R3.1bn 1,500,000,000.00
1,000,000,000.00
500,000,000.00
R1.1bn
0.00
J A S O N D J F M A M J J A S O N D J F M A M J J A S O N D J F M A M J J A S O N D J F M A M J J A S O N D J F M A M J
Primary Secondary
35A full-service shared-value Bank
Strategic focus areas
Banking
ecosystem 1 High-quality client growth
2 Attracting deposits
Behavioural
3 Growing quality advances
4 Powerful shared-value
fundamentals and currency
Functionality 5 Market-leading functionality
361. Strong growth to ±500 average daily sales with high-quality growth
New-to-Bank daily sales Quality client growth Opportunity within DSY and
non-DSY client base
±500
Primary versus secondary clients DSY product uptake – Bank new business
average daily
new-to-Bank sales
Achieved the medium-term targets
40%
600 60%
92%
500 490
Primary Secondary Bank client with DSY products Bank only
400
Vitality penetration
353 Average NIR per client per month
300 Current penetration Opportunity
264
200 198
100 32%
26%
20%
9% 13%
0
FY21 Q1 FY21 Q2 FY21 Q3 FY21 Q4 DSY Bank Big 4 Top 5 Retail
Blue Bronze Silver Gold Diamond
Banks
Big 4 and Top 5 NIR is the client-weighted average
Big 4 include Standard Bank, FNB, ABSA and Nedbank 37
Top 5 Retail Banks include Standard Bank, FNB, ABSA, Nedbank and Capitec2. Deposits have continued their strong growth trajectory
Consistent growth in retail deposits Deposits are sticky and diverse
R8.18bn Duration
Growth of 167% from July 2020 to June 2021 vs 7% for the market
R8.2bn
49% 38%
> 3 months
< 3 months - None/Blue
< 3 months - Bronze+
13%
Concentration
R3.1bn 5%
Top 10 depositors
Others
J A S O N D J F M A M J 95%
383. Deliberate decision to pursue a prudent, quality-focused credit
strategy
Retail advances New-to-Bank credit Credit loss ratio Superior credit risk
application metrics (excl. COVID-19 overlay) metrics
NEW CLIENTS RISK DISTRIBUTION
Growth of 5% from July 2020 to June JAN – MAR 2021
2021 – above market growth of 4.5% Applications Approve rate
9% Subprime Near prime Prime
Prime plus Super prime
R3.8bn 40,000 30%
4,000,000,000.00
R3.6bn 100%
35,000
3,500,000,000.00
25%
50%
30,000
3,000,000,000.00
6%
20% 34% 52%
2,500,000,000.00
25,000 0%
Discovery Bank Market
3.96%
2,000,000,000.00
20,000 15%
EXISTING CLIENTS RISK DISTRIBUTION
JAN – MAR 2021
15,000
3%
1,500,000,000.00
10% 100%
1,000,000,000.00
10,000 80%
5% 60%
500,000,000.00
5,000
40%
0 0% 0% 20%
30%
0.00
J A S O N D J F M A M J 17%
FY21 FY21 FY21 FY21 J A S O N D J F M A M J 0%
Q1 Q2 Q3 Q4 Discovery Bank Market
394. Shared-value fundamentals emerging as expected with Discovery
Miles as a powerful currency
Shared-value fundamentals The Discovery Miles currency is central to the Bank’s ecosystem and
the SA composite
4.9bn earned
94%
3.20%
in FY2021
1.26% Cumulative Miles earned
0.62%
lower arrears 0.18%
rate Blue Bronze Silver Gold and
Gold and Diamond
Diamond
vs Blue
202007
202008
202009
202010
202011
202012
202101
202102
202103
202104
202105
202106
Online and in-
Physical activity
9x
store
92
2.9bn spent
Prepaid products in FY2021
higher average 1 2 12 Drive
and services
deposits Continuous innovation
Blue* Bronze Silver Gold and
Gold and Diamond vs
book average Diamond New ways to New ways to
Indexed to Blue Spend Travel earn Miles spend Miles
Transfer and
4x
4 Healthy living
convert
2
1
1 Miles spend
8.5
greater spend 5.5
Gold and Diamond vs Blue Bronze Silver Gold and 1
Blue
Get up to when you spend
Diamond
Discovery Miles in the Vitality Mall, online and Daily average Black Friday Miles D-Day
on prepaid products and services (July)
405. Differentiated, market-leading functionality with a focus on digital
sophistication
Continued innovation Continued innovation
Innovations successfully rolled out Several enhancements being rolled out in
September
Examples; not exhaustive
Forex proposition
Account
Sign up 24/7/365 inDiscovery Health
Discovery Insure
Discovery Invest
Discovery Bank
Discovery Life
Continued operational excellence, growth in
DHMS lives and providing significant
support to members and society
42Discovery Health
Normalised operating New business Direct manex Membership
profit Rm (plpm)
+7% +6% +3% >3.7m
to R3 423m to R6 453m lives under administration
Non-scheme products
133.48 Closed schemes
127.93
DHMS
2020 2021
1993
1995
1997
1999
2001
2003
2005
2007
2009
2011
2013
2015
2017
2019
2021
2017 2018 2019 2020 2021 2017 2018 2019 2020 2021
43Discovery Health Medical Scheme performance summary
Growth and stability Value Security
>2.75m lives 36.9%
Delayed contribution increase
R2.2bn
1
Solvency1
57% market share 2 Contribution savings for DHMS
members
AAA GCR credit rating1
5.2% lapse rate1
2021 weighted average increases Reserve build-up
Debit order rejections
2.95% R27.5bn reserves 1
7%
6%
5%
4%
Scheme B
Scheme F
Scheme A
Scheme C
Scheme D
Scheme E
DHMS
2002 2004 2006 2008 2010 2012 2014 2016 2018 2020
Source: Discovery Health Medical Scheme and the Council of Medical Schemes
1 As at 31 December 2020
2 Based on beneficiaries, according to the Council for Medical Schemes Quarterly Report for the period ended 30 September 2020
44Utilisation patterns, which are the main driver of medical inflation,
have been disrupted
COVID-19 1 COVID-19 admissions Wave 2 and 3 peaks
600
ADMISSIONS 500
400
Wave 1 peak 300
200
100
0
IN-HOSPITAL 2 Total hospital admissions
CARE Pre-COVID levels 3,000
2,000
1,000
-
OUT-OF- 3 OH Claims GP Consults OTC Meds
2.0
HOSPITAL CARE 1.6
Pre-COVID levels 1.2
0.8
0.4
-
Mar - 20 May - 20 Jul - 20 Sep - 20 Nov - 20 Jan - 21 Mar - 21 May - 21 Jul - 21
45Emerging non-COVID-19 utilisation patterns over the period
2 3
IN-HOSPITAL CARE OUT-OF-HOSPITAL CARE
Reduced across the board, with a shift from large Starting to increase, with increased care at home
acute hospitals to smaller day surgery type facilities and changes in health-seeking behaviour
Decline in discretionary Decline in maternity- Spike in pathology Move to care outside Decline in preventative
medical admissions related utilisation claims large hospitals and screening care
Proportion of admissions
600,000,000
occurring in a day clinic Depression registrations
Cardiac Admissions
-20%
catheterisation Admissions average LOS 500,000,000
400,000,000
+56%
Neonatal
Endoscopies
Claimants admissions 300,000,000 Breast cancer screening
Tonsillectomy % Pre-38 week
200,000,000
-55%
100,000,000
and adenoid Admissions births
0
Diabetes management
-27%
Jun
Jan
Feb
Jul
Apr
Aug
May
Mar
2016 2017 2018 2019 2020
Spinal medical NICU
Admissions 2019 2020 2021
procedures admissions
46Accelerated digitisation of the healthcare system | DH ideally positioned
Global expansion of Discovery Health has a fully integrated digital healthcare platform
digital healthcare
Evidenced by telemedicine use Ecosystem has a comprehensive patient record, and
connects the communities of doctors, members and DH is already deploying AI and
Platform achieved scale
case managers across a common platform with digitisation for homecare and
through vaccination journey
Growth in provider integration to various parts of the medical system enhanced quality
remote consults 2019 to
2020
~ 50 – 175 x
Detailed medical Convergence of clinical and data insights
examinations and to offer high quality care at home
Member logins 1,118,689
advanced virtual
consultations
% of US consumers using telehealth
46%
24/7 doctor support
269,907
129,640
2019: 2020: 2021:
DrConnect DrConnect Connected End-to-end digital
(Pre-COVID) (COVID) Care (Since experience
1 Apr-21)
11%
Connected Care Vaccine Navigator
1.01m 3.68m
logins logins
2019 2020
47Discovery Health
Discovery Insure
Discovery Invest
Discovery Bank
Discovery Life
Significant negative COVID-19 mortality impact but delivering
excellent retention experience and maintaining financial strength
48Discovery Life
Normalised operating profit New business API Strong capital and liquidity position
-55%
to R1 341m
-1%
to R2 264m
SCR coverage Liquidity coverage
FY21
7x net cash
outflow
182% 183%
-6%
Before 4,420
COVID-19 impact
4,149
125%
SCR target
2017 2018 2019 2020 2021 2017 2018 2019 2020 2021 2020 2021 2020 2021
COVID-19 impact
49Discovery Life gross COVID-19 claims
FY 2020 FY 2021 FY 2022* Total (Rm)
Individual (Rm) 31 Individual (Rm) 2 207 Individual (Rm) 2 253 4 491
Group (Rm) 24 Group (Rm) 835 Group (Rm) 866 1 725
Total (Rm) 55 Total (Rm) 3 042 Total (Rm) 3 119 6 216
Wave 3 Actual to Aug 21 (Rm) 2 156
800 to 30 June 2021 = R689m
700
Monthly Death Outgo (R’m)
Provision Scenario
600 Wave 2 = R1 871m Prudent best estimate
60% vaccination by November
500
400
300
200
Wave 1 = R538m
100
-
Aug-20
Oct-20
Jan-21
Feb-21
Aug-21
Oct-21
Jan-22
Feb-22
Apr-20
Jul-20
Apr-21
Jul-21
Apr-22
Mar-20
Jun-20
Sep-20
Mar-21
Jun-21
Sep-21
Mar-22
Jun-22
May-20
May-21
May-22
Nov-20
Dec-20
Nov-21
Dec-21
Actual Provision Scenario
50Robust embedded value growth driven by positive operating variances
with continued exceptional persistency experience
Maintained strong positive VNB impacted by lower Cashflow impacted by COVID-19 claims
operating variances volumes and COVID-19
provision strengthening
Non-economic EV Variances Embedded Value VNB VNB Margin Rm
(Rm) 15 694
+10% 519
586
7.1%
8.0% Gross COVID-19 claims R3bn
34.8bn
31.8bn 421 5.8%
411 5.7%
401
2 196
-633
2020 2021 2020 2021 2020 2021 Premiums Claims Reinsurance Existing Operational Cashflows NB strain Net Life and
and fees financing costs from Invest
cashflows existing cashflow
after FinRe
Excluding COVID-19
Overall COVID-19 impact on cashflow of cR1.5bn net of
all risk and financial reinsurance
2010
2011
2012
2013
2014
2015
2016
2017
2018
2019
2020
2021
51Looking ahead and optimising Life insurance post the 3rd wave
SCR coverage Liquidity coverage Back book cash generation
182% 183% 4,149 4,420 7x FY21
net cash Supported strong
Well capitalised
1 back book cash
outflow
125%
and highly liquid generation: >R15bn
SCR target premium income
2020 2021 2020 2021
High Vitality engagement Actively driving vaccinations
Highly engaged % Life book vaccinated to
Count basis Sum assured basis
38%
off date
and vaccinated
2
Bronze
% of total book 57% 62%
client base % of 60+ years 73% 77%
% of 50+ years 69% 71%
% of 35+ years 63% 66%
None Blue Bronze Silver Gold Diamond
Differentiate between Product features Understanding relative COVID-19
vaccinated/unvaccinated lives risk across age bands
Products adjusted
3 for COVID-19
VACCINATION MAX
Base mortality
rate at age 45
OFFER
20 25 30 35 40 45 50 55 60 65 70 75 80 85 90 95
52Discovery Health
Discovery Insure
Discovery Invest
Discovery Bank
Discovery Life
Strong earnings growth, retention and excellent investment returns
for customers. New business growth curtailed by lower guaranteed
plan sales
53Discovery Invest
Normalised operating New business Assets under Lapse rates
profit administration
Rm Rm Rbn
+31% +3%
to R2 737m
+18%
to R117bn
-13%
to R1 084m
+31%
+16%
2017 2018 2019 2020 2021 2017 2018 2019 2020 2021 2019 2020 2021
2017 2018 2019 2020 2021
Non-recurring profit contributions,
include release of COVID lapse
provisions and GILF matching profits
54Key highlights over the past financial year
12% increase in linked product Strong investment performance Shared value continues
sales to drive good outcomes
Multi-asset
More profitable business sold over the last
financial year, with offshore sales up 81% One year Three year Five years
Discovery Dynamic Asset Optimisers
Conservative Q1 Q1 Q1
Moderate Q2 Q1 Q1
+3 years
Average
Aggressive Q1 Q1 Q1
investment term
Discovery Balanced Funds
Balanced Q2 Q2 Q2
Moderate Balanced Q2 Q2 Q1
Cautious Balanced Q2 Q1 Q1
Linked products as proportion of +338%
new business In extra
Local single-asset* contributions
22% Equity
26% Flexible Property
57% 68%
Global equity*
16% Equity Feeder
2020 2021 -22%
34% Value Income withdrawal
level
*Growth over one year
55Discovery Health
Discovery Insure
Discovery Invest
Discovery Bank
Discovery Life
Strong top-line growth and robust underwriting performance with
earnings impacted by lower investment yields
56Discovery Insure
Normalised New business Gross written Market share Operating
operating profit premium in GWP margin*
+2% +18% +15% 7% 6%
to R250m to R1 287m* to R4 205*
(excl. Commercial)
2017 2018 2019 2020 2021 2017 2018 2019 2020 2021 2017 2018 2019 2020 2021 2017 2018 2019 2020 2021 2017 2018 2019 2020 2021
Personal Lines only. Assumes 6% in GWP 57
*Personal Lines only market growth since 2018Analysing the profit dynamics
COVID-19 had an impact on driving, Profit composition reveals a strong increase in core
claims and profit in FY21 operating profit (Rm)
R114m
additional
- R58m
additional
= R56m
additional FY21 FY20
profit rewards given actual profit
(R59m in FY20) 250 246
Infections -3
-13
100
Infections (k)
50
163
0
-84
J F M A M J J A S O N D J F M A M J J Covid 119
related
2020 2021
-114
Driving Activity v regular levels Covid
related
120%
Driving activity
100%
80%
60%
40%
19%
0%
Normalised CMT Investment Operating Normalised CMT Investment Operating
J F M A M J J A S O N D J F M A M J J Operating Income Profit Operating Income Profit
2020 2021 Profit Profit
58
CMT profits are net of SA costsThe Vitality Drive model improves each year
Status correlations well established Improved status distribution This manifests iteratively in
leverages these dynamics an improving claims ratio
Loss ratio by status Lapse ratio by status 28%
proportion of book shifted over Motor claims ratio Total claims ratio
-34% -65% 4 years to Silver and up
60%
56% 56%
55% 55%
52% 52%
51%
47%
44%
Gold
2017 2018 2019 2020 2021 2017 2018 2019 2020 2021 2017 2018 2019 2020 2021
Blue
Bronze
Silver
Gold
Blue
Bronze
Silver
Blue Bronze Silver Gold
59Vitality Health
Vitality Life
Vitality Invest
Vitality Car
60UK Composite
Normalised Earned Lives covered New business
operating profit premiums1
+844% +5% +8% +7%
to £68.5m to £827.4m to 1.4m lives to £156.7m
Vitality Health
Vitality Invest
Vitality Life
Vitality Car
GBP millions
GBP millions
GBP millions
Best-in-breed products across
businesses and operating as a fully
integrated composite business with a
seamless One Vitality client journey. A
successful entry into motor insurance
Vitality Health, Vitality Life, Vitality Invest and Other
61
1 Vitality Health and Vitality Life onlyVitality Health
Vitality Invest
Vitality Life
Vitality Car
Robust operating performance driven by continued good
retention. Careful management of delay of elective healthcare
in the COVID-19 environment
62Vitality Health
Normalised Earned premiums Lives covered New business
operating profit
+9% +4% +6%
to 723k lives
+5%
to £46.0m to £515.6m to £65.9m
GBP millions
GBP millions
GBP millions
2017 2018 2019 2020 2021 2017 2018 2019 2020 2021 2017 2018 2019 2020 2021 2017 2018 2019 2020 2021
63Operational performance continues to be outstanding and business
well prepared for the coming period
Stronger and Low loss ratios, but Good cash generation Provided for uncertain future
better retention returning to prior levels claims through UPR and
rescheduled FinRe
Lapse Rate Actual v Pre-COVID expected loss
£m
ratio has precipitated a surplus
Pre-COVID expectation = 100 Providing for longer-
£128m term increases:
100
106 105
98 99 1. Long Covid
93 2. Long term
88 87
84 83 8482 increase in
68 76
74 claims e.g.
72 39.7
59 67 cancer increases
58
54 3. Catch-up
£56m experience-
43 based premium
36.1 increases
3233
Short-term
increase in claims
FY21 14.2 within contract
boundary
Jan Mar May Jul Sep Nov Jan Mar May Cash Write new Invest in Net cash 2020 2021
2017 2018 2019 2020 2021
generated business project generated
2020 2021 from initiatives Rescheduled FinRe
inforce UPR
64Vitality Health
Vitality Invest
Vitality Life
Vitality Car
Strong recovery, strengthening of underlying actuarial basis and
successful execution of management plan. New business slowed with
lockdowns and the focus on quality business
65Vitality Life
Normalised Earned premiums Lives covered New business
operating profit
+325% +8% +10% -14%
to £31.0m to £311.8m to 680k lives to £55.0m
GBP millions
GBP millions
GBP millions
2017 2018 2019 2020 2021 2017 2018 2019 2020 2021 2017 2018 2019 2020 2021 2017 2018 2019 2020 2021
66Favourable lapse and COVID-19 experience drove strong profit, but
offset by new business shortfall and assumption changes
Addressed the 10 point plan Operating profit recon
£11.9m £2m
£25.8m
£16.9m
£30m £31m
Expected Experience COVID-19 COVID-19 Basis and Normalised
operating profit variances (excl. claims and provision model operating profit
COVID-19) lapse variances strengthening strengthening
variances
6768
Focus on profit quality and scale through both
distribution channels and product diversification.
  Capital injection to support long-term growth

                                                     69
Ping An Health
New business1 Written premium1 PAH’s operating Discovery’s operating
results pre-tax result after tax
to R15.8bn to R40.6bn to R2.9bn to R411m
(DSY’s share is R727m)
2017 2018 2019 2020 2021 2017 2018 2019 2020 2021 2017 2018 2019 2020 2021 2017 2018 2019 2020 2021
1 100% of PAH 70The quality of the book and profits have improved
Revenue growth surged in H2 20, Renewal rates continue to Focused on quality, as seen by
growth moderating in FY21 increase and COR is reducing highest margins in industry
Written premiums RMB Renewal rates Net margin post tax, Jan - Dec 20
12 Company Margin
Billions
+20% Target
PING AN HEALTH INSURANCE
10
COMPANY OF CHINA, LTD 5.40%
+58%
8 31-Dec-19 30-Jun-20 31-Dec-20 30-Jun-21
KUNLUN HEALTH INSURANCE CO LTD 2.70%
6 Combined operating ratio CPIC HEALTH 2.30%
4 7% PICC HEALTH INSURANCE COMPANY
0.10%
absolute LIMITED
2 reduction FOSUN UNITED HEALTH INSURANCE
COMPANY LTD -3.40%
- RUIHUA HEALTH ASSURANCE
H1 H2 H1 H2 H1 H2 H1 H2 H1 H2 CORPORATION -28.90%
Prior period YTD 2021
FY17 FY17 FY18 FY18 FY19 FY19 FY20 FY20 FY21 FY21
Source: publicly available financial statements 71Continue to pursue scale through diversified distribution channels
and products
New business split by channel Increasing digital presence to unlock the online market
Ping An Le Jian Kang WeChat
Good Doctor App mini-program
100%
24%
80%
37% Health check-up
Access to
60% *400m users
Quick TCM Expert Medication Cloud
Inquiry Specialist Doctor farm
40% Video Medical
Consult examinationInsurance
Integrated Earn gold
status
20%
products Medical
services
Cumulative
services
Urology Paediatrics Dermatology Internal TCM
medicine
0%
Jun-20 Jun-21 Diabetes Fertility Urinary Male
health
Ping An Life Broker and direct sales Integrated
Cross Sales with PAG SuiShenYi online agency services
Online and Ping An App Home Shop Health My
page Insurance Q&A profile
72
*As at June 2021China’s market and strong economic growth trajectory provide an
excellent long-term opportunity
Continued growth in Policies emphasise developing Recent regulatory developments in
healthcare expenditure, healthcare and private health insurance education, technology and online
increased participation from supported by mature regulations pharmacy sectors, to align with policy
private health insurance goals
14th five-year plan provides support in four
(RMB Trillion) main areas (2020-2025): Education & housing
regulation address low
2.7x 16 birth rate
~USD Social development: Promote development of
2.4trn private health insurance
6
Digitisation: Develop AI healthcare capability, Technology sector
online hospitals & digitise health regulation change
2019 2030 address anti-competitive
International Collaboration: Attract foreign practices, consumer
investment and technology in medicine, protection and prudent
telecom, internet and education capital requirements
Private sector
healthcare providers
Healthy China 2030 target: Increase the
Online pharmacy
Public sector subsidised number of people exercising
regulations
healthcare providers address online prescription
drug safety
2019 2030 CBIRC formed in 2018 to combine and strengthen
financial supervision of insurance and banking sectors
73
CBIRC - China Banking and Insurance Regulatory CommissionPAH requires additional capital to support business growth and
product diversification
Total capital injection for PAH to develop additional capabilities and
fund new business growth
Capital requirement driven by 2 factors
Cumulative new business portion of PAH’s projected solvency ratio reduces without a capital
20 year product injection, due to sales of more capital-intensive 20-year
70% 32%
product
• Strong market demand for renewal guarantee
PAH growth imperatives • Premium increase flexibility for PAH
along with 200% • More sustainable and profitable product
solvency requirement • Lower average commission over term
• More capital-intensive
Oct-20
Jan-21
Feb-21
Apr-21
Sep-20
Mar-21
May-21
Jun-21
Nov-20
Dec-20
• Higher upfront commission
30% Chinese C-ROSS Phase II regulations implemented in 2021 aim to strengthen the effectiveness of
insurance regulatory system
Change in solvency New requirements increase minimum capital requirements for insurance, market, credit and other
rules quantitative risk factors
74USA
Strong growth due to increasing integration and
traction with existing partners and accelerating roll-
out to new markets and adjacencies
75Vitality Group
Integrated API by Revenue1 Operating result Insurance and franchise
insurance partners partners membership
to $1.3bn to $82.4m to $27.1m to 2.4m
R19.9bn R1.3bn R417m
+27%
2017 2018 2019 2020 2021 2017 2018 2019 2020 2021 2017 2018 2019 2020 2021 2017 2018 2019 2020 2021
Insurance partners Vitality USA
All numbers exclude new VG initiatives, i.e. myOwn and Vitality 76
1 Excludes services related to system implementation and other cost recoveries and rewardsDeepened adoption of SVI model has been transformational for our
partners
Engagement Lapses Claims Up-sales Latent value
% of members earned a point Attachment rates
-60% -35% +73%
74% 40%
Market A
-79% -35%*
+40%
58% 45%
Market B
+98%
-18%* -18%
72% 75%
Market C
-40% -10%* +111%
54% 80%
Market D
Non-Vitality Bronze Silver Gold & Platinum 77
*Pricing assumption in lieu of credible experienceBroadening reach and scale through a repeatable framework
Accelerated roll-out despite COVID Enabled by unified repeatability strategy
lives
2017 2018 2019 2020 2021
Fully remote implementation period to launch
2-version launch with increased functionality
78The platform allows an expansion from 1 ecosystem to 3
INCENTIVE LAYER
BEHAVIOURAL LAYER
DATA LAYER
PRICING LAYER
TECHNOLOGY LAYER
Comprehensive Digital
Health Ecosystem
Shared value health
insurance approach
79Forward-looking focus areas
Implement employee vaccine mandate, structural
and pricing changes to products for our customers
1 Navigating COVID-19 and play a central role in state-led COVID-19
response
Capital strength and liquidity remain a focus
Capital strength and
2 liquidity
Injecting capital into Ping An Health to support
business growth and product diversification
Actively pursue the Grow businesses organically, scale businesses
3 three dimensions of offshore and expand the Vitality global insurtech
platform
growth
Execute on the four Create unique shared-value composites that offer
4 strategic strands superior value
80Discovery Limited Copyright 2021 Discovery Ltd is the licensed controlling company of the designated Discovery Insurance Group. Registration number: 1999/007789/06. Companies in the Group are licensed insurers and authorised financial services providers.
You can also read


