Use of Google Earth to strengthen public health capacity and facilitate management of vector-borne diseases in resource-poor environments
←
→
Page content transcription
If your browser does not render page correctly, please read the page content below
Use of Google Earth™ to strengthen public health capacity and
facilitate management of vector-borne diseases in resource-
poor environments
Saul Lozano-Fuentes,a Darwin Elizondo-Quiroga,a Jose Arturo Farfan-Ale,b Maria Alba Loroño-Pino,b
Julian Garcia-Rejon,b Salvador Gomez-Carro,c Victor Lira-Zumbardo,c Rosario Najera-Vazquez,c
Ildefonso Fernandez-Salas,d Joaquin Calderon-Martinez,e Marco Dominguez-Galera,e Pedro Mis-Avila,e
Natashia Morris,f Michael Coleman,g Chester G Moore,a Barry J Beaty a & Lars Eisen a
Objective Novel, inexpensive solutions are needed for improved management of vector-borne and other diseases in resource-poor
environments. Emerging free software providing access to satellite imagery and simple editing tools (e.g. Google Earth™)
complement existing geographic information system (GIS) software and provide new opportunities for: (i) strengthening overall public
health capacity through development of information for city infrastructures; and (ii) display of public health data directly on an image
of the physical environment.
Methods We used freely accessible satellite imagery and a set of feature-making tools included in the software (allowing for
production of polygons, lines and points) to generate information for city infrastructure and to display disease data in a dengue
decision support system (DDSS) framework.
Findings Two cities in Mexico (Chetumal and Merida) were used to demonstrate that a basic representation of city infrastructure useful
as a spatial backbone in a DDSS can be rapidly developed at minimal cost. Data layers generated included labelled polygons
representing city blocks, lines representing streets, and points showing the locations of schools and health clinics. City blocks were
colour-coded to show presence of dengue cases. The data layers were successfully imported in a format known as shapefile into a
GIS software.
Conclusion The combination of Google Earth™ and free GIS software (e.g. HealthMapper, developed by WHO, and SIGEpi, developed
by PAHO) has tremendous potential to strengthen overall public health capacity and facilitate decision support system approaches
to prevention and control of vector-borne diseases in resource-poor environments.
Bulletin of the World Health Organization 2008;86:718–725.
Une traduction en français de ce résumé figure à la fin de l’article. Al final del artículo se facilita una traducción al español. .الرتجمة العربية لهذه الخالصة يف نهاية النص الكامل لهذه املقالة
Introduction ment of these and other vector-borne United States of America), of four com-
diseases in resource-poor environments monly used GIS software with data
Vector-borne diseases inflict a terrible are desperately needed. processing, analysis and display capaci-
and unacceptable public health burden Use of a geographic information ties ranging from low (HealthMapper,
in developing countries. Indeed, seven system (GIS), which is a system for in- WHO, Geneva, Switzerland; Epi Info/
of the 10 diseases targeted by the WHO put, storage, manipulation, and output Epi Map, Centers for Disease Control
Special Programme for Research and of geographic information, provides a and Prevention, Atlanta, Georgia, USA)
Training in Tropical Diseases because of powerful tool to combat vector-borne to moderate (SIGEpi, Pan American
their overwhelming public health and so- diseases. There is a plethora of GIS soft- Health Organization, Washington,
cioeconomic importance are transmitted ware packages available, with capacities DC, USA), and high (ArcGIS, ESRI,
by arthropods (African trypanosomiasis, for data processing, analysis and display Redlands, CA, USA).
Chagas disease, dengue, filariasis, leish- ranging from low to high. Table 1 out- GIS-based approaches have, for ex-
maniasis, malaria and onchocerchiasis). lines characteristics, relative to Google ample, been used to visualize or model
New, inexpensive solutions for manage- Earth (Google, Mountain View, CA, spatial patterns of risk for exposure to
a
Department of Microbiology, Immunology and Pathology, Colorado State University, Fort Collins, CO, United States of America.
b
Laboratorio de Arbovirologia, Universidad Autónoma de Yucatan, Merida, Yucatan, Mexico.
c
Servicios de Salud de Yucatan, Merida, Yucatan, Mexico.
d
Laboratorio de Entomología Medica, Universidad Autonoma de Nuevo Leon, Monterrey, Nuevo Leon, Mexico.
e
Servicios Estatales de Salud de Quintana Roo, Chetumal, Quintana Roo, Mexico.
f
Malaria Research Programme, Medical Research Council, Durban, South Africa.
g
Liverpool School of Tropical Medicine, Liverpool, England.
Correspondence to Lars Eisen (e-mail: lars.eisen@colostate.edu).
doi:10.2471/BLT.07.045880
(Submitted: 9 July 2007 – Revised version received: 2 January 2008 – Accepted: 4 January 2008 – Published online: 6 June 2008 )
718 Bulletin of the World Health Organization | September 2008, 86 (9)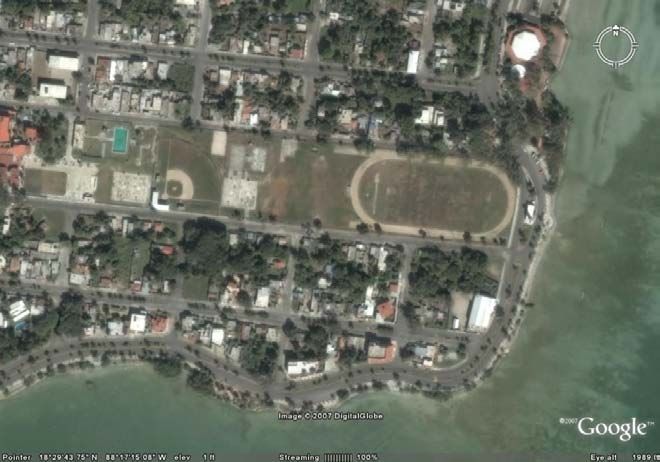
Research
Saul Lozano-Fuentes et al. Use of Google Earth™ to strengthen public health capacity
Table 1. Basic characteristics of Google Earth™ versus commonly used GIS software
Software Provider Free- Free access to Basic feature- Spatial data Spatial analysis and
ware satellite images making tools processing capability modelling capability a
Google Earth™ Google Yes Yes Yes Low b None
Epi Info/Epi Map CDC Yes No Yes Low Low
HealthMapper WHO Yes No Yes Low Low
SIGEpi PAHO Yes No Yes Moderate Moderate
ArcGIS ESRI No No Yes High High
CDC, [United States] Centers for Disease Control and Prevention; ESRI, Environmental Systems Research Institute, Inc.; GIS, geographical information system; PAHO,
Pan American Health Organization.
a
Spatial analysis and modelling capability going beyond visual interpretation of displayed data.
b
Restricted to basic feature-making tools.
malaria parasites in Africa1–3 and dengue Google Earth™ and Microsoft® Virtual Estadística, Geografía e Informática;
virus in different parts of the world.4–7 Earth, Microsoft Corp., Redmond, WA, Aguascalientes, Mexico) with a spatial
This provides crucial information fa- USA) to generate basic data layers for city resolution fine enough to display basic
cilitating allocation of resources to the infrastructure. Previous uses of Google geostatistical areas (BGSAs), streets,
areas most in need of vector and disease Earth™ in public health include: display and city blocks had already been devel-
control. GIS spatial backbones also have of public health information following oped for these two cities. GIS data for
been incorporated into information Hurricane Katrina in New Orleans, BGSAs available to us included various
systems or decision support systems for USA;21 visualization of public health re- socioeconomic factors. The City of
management of vector-borne diseases. cords in Sweden;22 interactive mapping of Merida also recently produced a GIS-
Examples include systems for malaria based city representation including data
strategic health authorities in England;23
surveillance and control in India, Mexico for individual premises.25 Nevertheless,
display of information related to a global
and southern Africa,8–13 management these cities serve as practical examples
malaria atlas project; tracking of dengue
of insecticide resistance in African ma- of the potential for satellite imagery
cases in Singapore; and tracking of the
laria vectors,14 and dengue surveillance and editing tools to generate informa-
global spread of avian influenza.24
and control in Brazil, Singapore and tion for city infrastructure useful as
The goal of this study was to
Thailand.15–18 A dengue decision sup- a spatial backbone in a local DDSS.
demonstrate that Google Earth™ can
port system (DDSS) with a GIS spatial Satellite images for Chetumal and
be used to strengthen overall public
backbone is currently being developed health capacity through development Merida were accessed during an online
at Colorado State University funded by of information for city infrastructure internet session with Google Earth™
the Innovative Vector Control Consor- and to display public health data in (examples of image quality in Fig. 1,
tium.19 In a sister project, the Medical map formats. Fig. 2, Fig. 3 and Fig. 4; Fig. 1 and
Research Council of South Africa is Fig. 2 are available at: http://www.who.
int/bulletin/volumes/86/9/07-045880/
developing a Malaria Decision Support Methods en/index.html). We then investigated
System.19
We used satellite imagery and feature- the generation and incorporation of
Use of GIS technology to support
making tools provided through Google data into features that could be used
management of vector-borne diseases
does, however, require access to basic Earth™ to develop city infrastructure in the decision support system and
data layers including labelled polygons imported into GIS packages.
geographic data layers. In the case of
representing city blocks, lines repre-
dengue, which is predominantly an urban
disease,20 a GIS data layer showing the
senting streets, and points showing the Findings
locations of schools, health clinics, etc.;
basic infrastructure of a city (streets, city Visualization of spatial patterns of
and to generate block-level city maps
blocks, location of health facilities, etc.) showing the distribution of blocks dengue
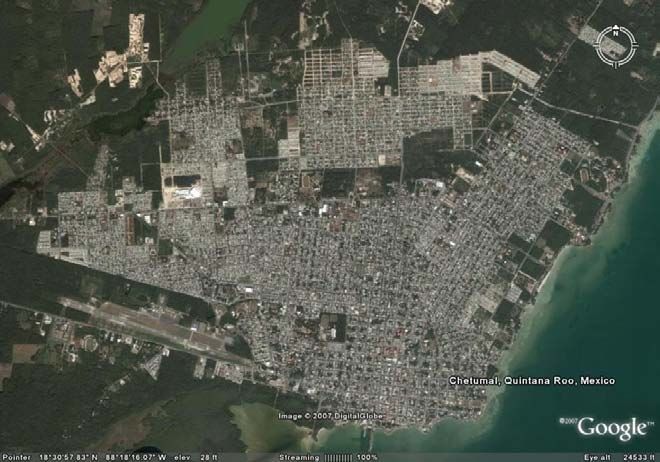
is crucial. Unfortunately, resource-poor with dengue cases. Data layers were Images captured during an online ses-
environments in need of GIS-based successfully imported as shapefiles (a sion can be stored on a desktop com-
solutions to more effectively manage format which stores the geometry for puter to allow for subsequent off-line
vector-borne diseases can be faced with a feature as a set of vector coordinates) work without internet access using the
the reality that even the most basic GIS into GIS software. In addition, we ex- stand-alone Google Earth™ desktop
data are lacking and that investment in plored the potential for incorporating application. Although there were small
the infrastructure (high end computers, Google Earth™ into a DDSS for two patches of cloud cover in the images,
sophisticated GIS software, technical cities in southern Mexico: Chetumal their overall quality was adequate to
personnel) needed to develop such data in Quintana Roo State (population: determine the outlines of city blocks,
is cost-prohibitive. We therefore explored approximately 135 000) and Merida streets, and even individual buildings.
the potential for using novel software in Yucatan State (population: ap- Using the polygon, line (path) and
providing free access to satellite imagery proximately 800 000). GIS-based data point (placemark) tools supplied with
and including simple editing tools (e.g. from INEGI (Instituto Nacional de Google Earth™, we generated polygons
Bulletin of the World Health Organization | September 2008, 86 (9) 719Research
Use of Google Earth™ to strengthen public health capacity Saul Lozano-Fuentes et al.
representing city blocks, lines repre-
Fig. 3. Basic representation of city infrastructure for Chetumal, Quintana Roo, Mexico,
senting streets, and points representing developed in Google Earth™a
home addresses for persons afflicted
with dengue (georeferenced with a
GPS receiver) or locations of schools,
hospitals, health clinics, and cemeteries
(Fig. 3, Fig. 4, Fig. 5, Fig. 6 and Fig. 7).
The development of a representation of
the city of Chetumal (Fig. 5) complete
with labelled blocks, streets, schools
and health facilities required approxi-
mately 80 person-hours and was ac-
complished by one person with no
previous experience of Google Earth™.
The feature-making tools in the
application are simple and intuitive to
use. Points are added to the image by
clicking on the placemark tool and then
can be located by “dragging” them to
their desired locations in the image or
by entering specific coordinates such
as those derived from a GPS receiver.
A line is added by simply clicking on a
Showing streets (lines) and city blocks (polygons).
the path tool and then clicking on the
desired start and end points for the line simultaneous display of different diseases of map provides information on where
in the image. A polygon is similarly (i.e. vector-borne, foodborne, water- people are most at risk of exposure to
generated by clicking on the polygon borne) of interest to the local public dengue virus and can be used to guide
tool and then clicking on the corners of health community. In addition, points limited mosquito vector and dengue
the area in the image the polygon will can be represented by different icons prevention, surveillance, and to control
represent; this tool allows for produc- (examples in Fig. 5). resources to the areas of a city at highest
tion of polygons with an infinite variety As an example of the potential for risk. Multi-year data for spatial distribu-
of shapes. Polygons, lines and points using Google Earth™ to visualize spa- tion of dengue cases within a city also
can be individually labelled (with both tial patterns of vector-borne diseases, can be used to create a spatial priority
name and an extended description of we developed city maps showing the area classification scheme for emer-
the feature) and displayed in various location of blocks with dengue cases gency vector control activities during
colours selected from an extensive reported in 2006 for Chetumal and dengue outbreaks when vector control
palette. This colour option allows for Merida (Fig. 6 and Fig. 7). This type resources are overwhelmed and deci-
sions must be made regarding the order
in which to treat different parts of a city.
Fig. 4. Basic representation of city infrastructure for south-eastern Chetumal, It also should be noted that disease case
Quintana Roo, Mexico, developed in Google Earth™ a locations can be displayed directly on a
Google Earth™ image of the physical
environment (not shown), which pro-
vides additional intuitive information
of the environment in which the cases
occur (for example in relation to the
presence of water sources potentially
serving as breeding grounds for anoph-
eline malaria vectors).
Incorporation into a dengue
decision support system
Google Earth™ was also incorporated
as one option for display of informa-
tion in a map format in a DDSS frame-
work (Fig. 8). As part of DDSS software
under development at Colorado State
University, Visual Basic 2005® (Microsoft
Corp.) was used to design a manage-
ment tool for extraction of informa-
tion from a DDSS data warehouse
a
Showing streets (lines) and city blocks (polygons).
720 Bulletin of the World Health Organization | September 2008, 86 (9)Research
Saul Lozano-Fuentes et al. Use of Google Earth™ to strengthen public health capacity
(PostgreSQL database with a PostGIS
Fig. 5. Representation of city infrastructure for Chetumal, Quintana Roo, Mexico,
extension) and subsequent generation developed in Google Earth™ a
of chart, graph, map and text outputs.
Google Earth ™ map outputs are
generated through a series of program
subroutines to extract the required in-
formation from the data warehouse and
produce a Keyhole Markup Language
(KML) file, a format used for expressing
geographic annotation and visualiza-
tion for display in Google Earth™. The
DDSS software will, when completed,
be made freely available to the public
health end-user community. Based
on the preference and resources of the
end-user, DDSS map outputs can be
displayed either in Google Earth™ or
in GIS software (Fig. 8).
In addition to serving as an option
for display of map outputs, Google
Earth™ may prove useful to build a
spatial backbone for a local DDSS
in situations where GIS data are in-
complete or lacking (Fig. 8). Physical
features that can be mapped directly
from a satellite image include roads,
streets, city blocks, rivers and lakes. In
addition, features not directly visible on
the image can be added; these include a
Showing streets, city blocks, schools (house symbol), health clinics (cross symbol) and cemeteries (balloon
schools, hospitals, health clinics and
symbol with C).
administrative units bounded by streets
(e.g. neighbourhoods of a city).
cessfully transferred into a commonly elements and attributes and is based
Transfer of information to GIS used GIS software (ArcGIS9.2, ESRI). on the XML standard (Fig. 9, avail-
software Google Earth™ uses the KML file for- able at: http://www.who.int/bulletin/
The data developed for Chetumal and mat for geographic visualization.26 KML volumes/86/9/07-045880/en/index.
Merida using Google Earth™ were suc- uses a tag-based structure with nested html). A MultiGeometry function allows
a KML file to include information on
multiple features (polygons, paths, place-
Fig. 6. Distribution of city blocks with dengue cases a in 2006 in Chetumal, marks). For example, the information
Quintana Roo, Mexico in the map shown in Fig. 5 is contained
within a single KML file. Transfer of a
KML file from Google Earth™ to GIS
software is achieved by extracting the
KML geographic elements and creating
a shapefile. Conversion from KML to
shapefile, or from shapefile to KML, can
be done through various already available
tools; in this instance Arc2Earth software
was used for the transformation from
KML to shapefile.27
Human subjects
Data for locations of dengue cases
were provided by Servicios de Salud
de Yucatan and Servicios Estatales de
Salud de Quintana Roo under protocols
approved by the Institutional Review
Board at Colorado State University.
Map-based presentation of these data
(Fig. 6 and Fig. 7) is restricted to city
a
Showing dengue cases (filled) versus without dengue cases (unfilled). blocks.
Bulletin of the World Health Organization | September 2008, 86 (9) 721Research
Use of Google Earth™ to strengthen public health capacity Saul Lozano-Fuentes et al.
Discussion Fig. 7. Distribution of city blocks with dengue cases a in 2006 in Merida, Yucatan,
Need for new tools and solutions Mexico b
Vector-borne and other infectious dis-
eases place tremendous public health
burdens on developing countries. Even
when management solutions are avail-
able, many are not economically feasible
to implement in the areas with the most
desperate need. One part of the new
frontier in infectious disease research
must therefore be to adapt technologi-
cally advanced and costly concepts for
disease management to operational use
in resource-poor environments through
development of low-cost tools and solu-
tions. Google Earth™ is an excellent ex-
ample of a freely accessible tool with great
potential for improving public health.
The software provides access to satellite
images of high quality in urban areas and
includes a set of simple editing tools that
can be used both for display of various
public health information and to gener-
ate information on city and public health
infrastructure. Benefits and limitations of
using Google Earth™ are outlined in the a
Showing dengue cases (filled) versus without dengue cases (unfilled).
following sections and its basic properties b
The large filled area to the south-west in Merida includes the airport.
versus commonly used GIS software are
summarized in Table 1.
currently being implemented in Mexico of the same index for any desired combi-
Benefits and aiming to enrol home-owners in nation of blocks or the entire city.
source-reduction efforts to remove With adequate funding and access
Google Earth™ has several attractive to high-quality satellite imagery, Google
breeding grounds for the dengue virus
features. First, this free software is very vector Aedes aegypti). Fifth, the quality Earth™ can be used to generate basic data
simple and intuitive to use. We expect of the satellite imagery is constantly im- for infrastructure (roads, villages, streets,
most public health professionals to easily proving. Sixth, Google Earth™-generated city blocks, schools, health clinics, etc.)
develop proficiency in its use through an KML files can readily be shared; they and major environmental features (riv-
unsupervised brief session of working also can be imported as shapefiles into a ers, lakes, etc.) for all parts of the world
with the software. Second, the varied GIS software for spatial analysis of the where such information currently is
colour options for placemarks (points) included data. Finally, there is a large lacking or unreliable in a GIS format. A
and polygons allow for development of user community with online support global assessment is needed to determine
maps simultaneously showing informa- groups for technical issues. in which geographical areas high-quality
tion related to multiple diseases or public We used Google Earth™-derived city images coincide with poorly developed
health initiatives. Third, it is a stand- infrastructure representations to generate GIS databases; these are the areas where
alone desktop software application. This maps showing the spatial distribution of this application has the greatest potential
is important because internet access city blocks with dengue cases in Chetumal to improve public health capacity.
can be inconsistent or very slow even and Merida, Mexico, in 2006 (Fig. 6 and
in urban areas in developing countries. Fig. 7). Similar maps can be developed for Limitations
Internet access is needed only briefly any number of vector-borne, zoonotic, Google Earth™ has several limitations.
to capture a satellite image which can waterborne, or foodborne diseases where Perhaps the most profound drawback
be stored on the user’s computer and case locations are available. This spatial is the need to access the internet to
processed off-line. Fourth, the quality information can, using dengue as an capture satellite images of areas of
of imagery is already sufficient in many example, be used to facilitate focused interest. Although internet access is in-
urban areas to allow the viewer to distin- operational vector surveillance and con- creasing, especially in urban areas, this
guish individual houses. Together with trol activities targeting high-risk areas. By requirement will impede its use in some
information collected on the ground, dividing the number of annual disease parts of the world. Image quality also
this can support development of com- cases within a city block with the number presents a potential stumbling block.
puter-based premise-level maps crucial of houses within the block, one also can Often, we have found image quality
for management of information related generate a simple block-specific index to be excellent in urban environments
to participation in public health cam- for disease incidence per house and year. in developing countries but very poor
paigns (e.g. the Patio Limpio programme Merging blocks will allow for calculation in rural areas, which limits its useful-
722 Bulletin of the World Health Organization | September 2008, 86 (9)Research
Saul Lozano-Fuentes et al. Use of Google Earth™ to strengthen public health capacity
specialized personnel, we expect high-
Fig. 8. Potential use of Google Earth™ and GIS software in a basic DDSS framework
end and expensive GIS software, such
as ArcGIS, rather than Google Earth™
Models
and free GIS software to be used in the
- Statistical models
DDSS framework.
(GPS, GIS, Google Earth)
Epidemiology data
Spatial reference data
- Analytical models
Data warehouse
Entomology – Surveillance data
- Simulation models
Conclusions
Management
tool
The combination of Google Earth™
Entomology – Intervention data and free GIS software (e.g. the Health-
(including dynamic
query tools) Mapper, SIGEpi) has tremendous
potential to strengthen overall public
Spatial backbone data
health capacity and facilitate decision
- Infrastructure (roads, - Socioeconomic data
support system approaches to preven-
Charts, Google Model
streets, city blocks, etc.) - Environmental data graphs, Earth outputs tion and control of vector-borne dis-
- Location of hospitals, (climate, elevation,
health clinics, schools, etc. tables eases in resource-poor environments.
land cover, etc.) GIS
- Major environmental Basic information for city infrastruc-
soft-
features (rivers, lakes, etc.)
ware ture can, if lacking in a GIS format, be
GIS- rapidly generated using freely available
based satellite imagery and feature-making
Google Map-
GIS- data
Earth-
based based tools. Key beneficial features of the
based
data
data outputs stand-alone desktop Google Earth ™
software include access to satellite im-
DDSS, dengue decision support system; GIS, geographic information systems; GPS, global positioning system. agery of often very high quality in urban
areas, a set of user-friendly feature-
making tools to produce individually
ness for diseases occurring commonly development therefore must be flex- labelled and colourized polygons, lines,
in rural settings (e.g. malaria). The age ible enough to address the needs of a and points, and potential for conver-
of images also varies, which presents diverse end-user community. Poten- sion of KML files into shapefiles to im-
a problem in rapidly growing urban tial for use of GIS software as well as port into GIS software. Key limitations
environments. Other drawbacks in- Google Earth™ as options for display of include the need to access the internet
clude a limited set of editing and data DDSS-generated data in map formats for initial capture of a satellite image,
management tools and a lack of spa- provides flexibility for the user com- poor image quality in many rural
tial analysis and modelling capability munity to select the display method areas, and lack of spatial analysis and
(Table 1). Finally, Google Earth™ uses best suiting their needs and resources. modelling capability. We have success-
the world geodetic system (WGS) 84, In a resource-poor environment, we fully incorporated Google Earth™ as
which is best suited for country-wide expect a DDSS end-user with limited
or continent-wide scales. one option alongside GIS software for
computer skills to be able to generate display of information in a map format
We expect some of these limitations map outputs in Google Earth show-
to be addressed in the future. The critical in a DDSS framework. ■
ing the spatial distribution of dengue
issue of image quality can be improved cases or mosquito vector information.
by Google purchasing additional satel- Acknowledgements
These maps can be used internally by We thank Jesus Valentin Miss-
lite imagery. The editing tool and data vector or dengue control programmes
management capacity will undoubtedly Dominguez from Universidad Au-
to guide prevention, surveillance, and tónoma de Yucatán and William May–
improve in the future as new versions of control efforts to high-risk areas and
the software are released and additional Medina of Servicios Estatales de Salud
also can be distributed externally to de Quintana Roo for georeferencing
editing or data management tools are inform the public and local decision-
generated and made available by the user of dengue case locations and Jacobo
makers of spatial risk patterns. Misael Canul-Chin, Juan Carlos Sosa-
community. For example, we have devel- In a resource-poor environment, Muy, and Francisco Javier Gamboa-
oped tools for: (i) conversion between use of Google Earth™ likely will be Garcia from Universidad Autónoma de
geographic coordinates in WGS 84 and combined with use of free GIS software Yucatán and Aaron Tadeo-Manzanares
Universal Transverse Mercator (UTM) such as the HealthMapper or SIGEpi. from Servicios Estatales de Salud de
projection which is better suited for lim- As noted previously, KML files gener- Quintana Roo for assistance with DDSS
ited areas such as the cities of Cheumal ated in Google Earth™ can be imported development.
and Merida; and (ii) creation of centroids as shapefiles into GIS software for spatial
for generated polygons. analysis. This is important because GIS Funding: The study was funded by the
software can provide access to various Innovative Vector Control Consortium
Flexibility in DDSS application socioeconomic and environmental data as part of the Dengue Decision Support
Dengue occurs in a wide range of and spatial statistical analysis capacity System project.
environments in Africa, the Americas lacking in Google Earth™. In more af-
and Asia. The DDSS framework under fluent environments with availability of Competing interests: None declared.
Bulletin of the World Health Organization | September 2008, 86 (9) 723Research
Use of Google Earth™ to strengthen public health capacity Saul Lozano-Fuentes et al.
Résumé
Utilisation de Google Earth™ pour renforcer les capacités de la santé publique et faciliter la prise en charge
des maladies à transmission vectorielle dans les environnements pauvres en ressources
Objectif Des solutions innovantes et peu onéreuses sont développer rapidement et à un coût minimal une représentation
nécessaires pour améliorer la prise en charge des maladies à rudimentaire des infrastructures urbaines, utilisable comme épine
transmission vectorielle et autres dans les environnements pauvres dorsale spatiale d’un DDSS. Les couches de données générées
en ressources. Les logiciels émergents gratuits qui fournissent comprenaient des polygones étiquetés représentant des pâtés
un accès à l’imagerie satellitaire et à des outils d’édition simples de maisons, des lignes figurant des rues et des points indiquant
(Google Earth™) complètent les logiciels de système d’information l’emplacement d’écoles et de centres de santé. Les pâtés de
géographique (GIS) et offrent de nouvelles possibilités : (i) de maisons ont été colorés selon un code de manière à signaler la
renforcer les capacités globales de la santé publique par la présence de cas de dengue. Ces couches de données ont été
génération d’informations concernant les infrastructures urbaines ; importées avec succès sous un format appelé fichier de formes
et (ii) d’afficher directement des données de santé publique sur dans un logiciel GIS.
une image de l’environnement physique. Conclusion La combinaison associant Google Earth™ et un
Méthodes Nous avons utilisé l’imagerie satellitaire en accès libre logiciel GIS libre et gratuit (par exemple HealthMapper, développé
et une série d’outils de traçage appartenant au logiciel (permettant par l’OMS, ou SIGEpi, développé par l’OPS) offre un énorme potentiel
de produire des polygones, des lignes et des points) pour générer pour renforcer les capacités générales de la santé publique et
des informations sur l’infrastructure urbaine et pour afficher des faciliter l’utilisation de systèmes d’aide à la décision pour prévenir
données de morbidité dans le cadre d’un système d’aide à la décision et combattre les maladies à transmission vectorielle dans les
concernant la dengue (DDSS). environnements pauvres en ressources.
Résultats Nous nous sommes servis de deux villes du Mexique
(Chetumal et Merida) pour démontrer qu’il était possible de
Resumen
Uso de Google Earth™ para fortalecer la capacidad de salud pública y facilitar la gestión de las
enfermedades de transmisión vectorial en entornos con recursos escasos
Objetivo Se necesitan soluciones novedosas y de bajo costo para Resultados Se utilizaron dos ciudades de México (Chetumal y
mejorar la gestión de las enfermedades de transmisión vectorial Mérida) para demostrar que es posible desarrollar rápidamente
y de otro tipo en los entornos con recursos escasos. Las nuevas y con un costo mínimo una representación básica de la
opciones de software gratuito que dan acceso a imágenes por infraestructura urbana que revista utilidad como urdimbre espacial en
satélite y a instrumentos de edición sencillos (por ejemplo Google un DDSS. Las capas de información generadas comprendían polígonos
Earth™) complementan el software del sistema de información etiquetados que representaban cuadras, líneas que reproducían las
geográfica (SIG) existente y brindan nuevas oportunidades para: calles, y puntos que indicaban la localización de las escuelas y los
(i) reforzar la capacidad global de salud pública mediante la dispensarios. Las cuadras se codificaron mediante colores en función
elaboración de información para infraestructuras urbanas; y (ii) de los casos de dengue. Las capas de información se pudieron importar
mostrar los datos de salud pública directamente en una imagen satisfactoriamente a un software SIG en el formato conocido como
del entorno físico. shapefiles.
Métodos Se utilizaron imágenes por satélite de libre acceso y Conclusión La combinación de Google Earth™ y software SIG
una serie de prestaciones de generación de detalles incluidas gratuito (por ejemplo, HealthMapper, desarrollado por la OMS, y SIGEpi,
en el software (que permiten crear polígonos, líneas y puntos) desarrollado por la OPS) brinda enormes posibilidades para reforzar la
para añadir información sobre las infraestructuras urbanas y capacidad general de salud pública y facilitar la aplicación de sistemas
representar datos sobre las enfermedades en el marco de un de apoyo decisional a la prevención y el control de enfermedades de
sistema de apoyo decisional para el dengue (DDSS). transmisión vectorial en los entornos con recursos escasos.
ملخص
وتيسري معالجة األمراض،االستفادة من موقع غوغل للخرائط والصور الخاصة برصد األرض يف تعزيز قدرات مرافق الصحة العمومية
املنقولة بالنواقل يف البيئات الشحيحة املوارد
.الصحية العمومية مبارشة عىل صور البيئة املادية إننا بحاجة إىل توفري حلول مبتكرة وغري مكلفة لتحسني معالجة:الهدف
، لقد قمنا باستخدام الصور الخاصة برصد األرض واملتاحة باملجان:الطريقة . وغريها من األمراض يف البيئات الشحيحة املوارد،األمراض املنقولة بالنواقل
ومجموعة من أدوات تحديد الخصائص املتضمنة يف الربنامج (مام يسمح فإن الربامج املجانية املستجدة (مثل غوغل للخرائط والصور الخاصة برصد
واألضالع) إلعداد املعلومات عن البنية األساسية، والنقاط،بإعداد الخطوط وغريها من،األرض) التي تتيح ُس ُبل الوصول إىل الصور الخاصة برصد األرض
للمدينة ولعرض املعطيات الخاصة باألمراض من خالل إطار عمل نظام دعم تساعد عىل تكميل الربنامج الحايل لنظام املعلومات،أدوات التحرير البسيطة
.اتخاذ القرار بشأن حمى الدنج ) لتعزيز القدرات الكلية للصحة العمومية1( وتوفر فرصاً طيبة،الجغرافية
ومريدا) لتوضيح أن، اعتمد عىل مدينتني يف املكسيك (شتومال:املوجودات ) عرض املعطيات2(من خالل إعداد املعلومات عن البيئة األساسية للمدن و
724 Bulletin of the World Health Organization | September 2008, 86 (9)Research
Saul Lozano-Fuentes et al. Use of Google Earth™ to strengthen public health capacity
إن الجمع بني استخدام موقع غوغل للخرائط والصور الخاصة:االستنتاج التمثيل األسايس للبن ّية األساسية للمدينة املستخدم كعمود فقري مكاين يف
وبرنامج نظام املعلومات الجغرافية املجاين (مثل الخرائط،برصد األرض ميكن تطويره رسيعاً بتكلفة التكاد،نظام دعم اتخاذ القرار بشأن حمى الدنج
ونظام،املتعلقة بالصحة العمومية املعدة من ِق َبل منظمة الصحة العاملية وتضمنت طبقات املعطيات املستجلبة أضالعاً موسمة متثل بنايات َّ .تذكر
املعلومات الجغرافية املتعلق بالوبائيات والصحة العمومية) املعد من ِق َبل ً ً
ونقاطا لتظهر أماكن املدارس والعيادات، وخطوطا متثل الشوارع،املدن
منظمة الصحة للبلدان األمريكية ميكنه تعزيز قدرات الصحة العمومية وتم. وتم تكويد ألوان بنايات املدن لتوضيح وجود حاالت الدنج.الصحية
وتيسري أساليب برنامج دعم اتخاذ القرار للوقاية من األمراض،بشكل هائل إدخال طبقات املعطيات بنجاح يف شكل يعرف بحلقات الشكل يف برنامج
. ومكافحتها يف البيئات الشحيحة املوارد،املنقولة بالنواقل .نظام املعلومات الجغرافية
References
1. Mapping Malaria Risk in Africa [homepage on the internet]. MARA/ARMA: 14. Coleman M, Sharp B, Seocharan I, Hemingway J. Developing an evidence-
2004. Available from: http://www.mara.org.za/ [accessed on 4 June 2008]. based decision support system for rational insecticide choice in the control
2. Kleinschmidt I, Omumbo J, Briet O, van de Giesen N, Sogoba N, Mensah NK, of African malaria vectors. J Med Entomol 2006;43:663-8. PMID:16892622
et al. An empirical malaria distribution map for West Africa. Trop Med doi:10.1603/0022-2585(2006)43[663:DAEDSS]2.0.CO;2
Int Health 2001;6:779-86. PMID:11679126 doi:10.1046/j.1365- 15. Rosa-Freitas MG, Tsouris P, Sibajev A, de Souza Weimann ET, Marques AU,
3156.2001.00790.x Ferreira RL, et al. Exploratory temporal and spatial distribution analysis of
3. Hay SI, Snow RW. The Malaria Atlas Project: developing global maps of dengue notifications in Boa Vista, Roraima, Brazilian Amazon, 1999-2001.
malaria risk. PLoS Med 2006;3:e473. PMID:1762059 doi:10.1371/journal. Dengue Bull 2003;27:63-80.
pmed.0030473 16. Teng TB. New initiatives in dengue control in Singapore. Dengue Bull
4. Communicable Disease Global Atlas – DengueNet initiative. Geneva: WHO; 2001;25:1-6.
2008. Available from: http://www.who.int/globalatlas/default.asp [accessed 17. Ai-leen GT, Song RJ. The use of GIS in ovitrap monitoring for dengue control
on 4 June 2008]. in Singapore. Dengue Bull 2000;24:110-6.
5. Carbajo AE, Schweigmann N, Curto SI, de Garin A, Bejaran R. Dengue 18. Sithiprasasna R, Patpoparn S, Attatippaholkun W, Suvannadabba S,
transmission risk maps of Argentina. Trop Med Int Health 2001;6:170-83. Srisuphanunt M. The geographic information system as an epidemiological
PMID:11299033 doi:10.1046/j.1365-3156.2001.00693.x tool in the surveillance of dengue virus-infected Aedes mosquitos. Southeast
6. Indaratna K, Hutubessy R, Chupraphawan S, Sukapurana C, Tao J, Asian J Trop Med Public Health 2004;35:918-26. PMID:15916091
Chunsutthiwat S, et al. Application of geographical information systems 19. Hemingway J, Beaty BJ, Rowland M, Scott TW, Sharp BL. The Innovative
to co-analysis of disease and economic resources: dengue and malaria Vector Control Consortium: improved control of mosquito-borne diseases.
in Thailand. Southeast Asian J Trop Med Public Health 1998;29:669-84. Trends Parasitol 2006;22:308-12.
PMID:10772545 20. Gubler DJ. The changing epidemiology of yellow fever and dengue, 1900
7. Rotela C, Fouque F, Lamfri M, Sabatier P, Introini V, Zaidenberg M, et al. to 2003: Full circle? Comp Immunol Microbiol Infect Dis 2004;27:319-30.
Space–time analysis of the dengue spreading dynamics in the 2004 Tartagal PMID:15225982 doi:10.1016/j.cimid.2004.03.013
outbreak, Northern Argentina. Acta Trop 2007;103:1-13. PMID:17603989 21. Curtis AJ, Mills JW, Leitner M. Spatial confidentiality and GIS: Re-engineering
doi:10.1016/j.actatropica.2007.05.003 mortality locations from published maps about Hurricane Katrina. Int J Health
8. Booman M, Durrheim DN, La Grange K, Martin C, Mabuza AM, Zitha A, et al. Geogr 2006;5:44. PMID:17032448 doi:10.1186/1476-072X-5-44
Using a geographical information system to plan a malaria control programme 22. Sundvall E, Nyström M, Forss M, Chen R, Petersson H, Åhlfeldt H. Graphical
in South Africa. Bull World Health Organ 2000;78:1438-44. PMID:11196490 overview and navigation of electronic health records in a prototyping
9. Booman M, Sharp BL, Martin CL, Manjate B, La Grange JJ, Durrheim DN. environment using Google Earth and openEHR archetypes. Medinfo 2007;
Enhancing malaria control using a computerised management system in 129:1043-7.
southern Africa. Malar J 2003;2:13. PMID:12816547 doi:10.1186/1475- 23. Boulos MNK. Web GIS in practice III: Creating a simple interactive map of
2875-2-13 England’s Strategic Health Authorities using Google Maps API, Google Earth
10. Martin C, Curtis B, Fraser C, Sharp B. The use of a GIS-based malaria KML, and MSN Virtual Earth Map Control. Int J Health Geogr 2005;4:22.
information system for malaria research and control in South Africa. PMID:16176577 doi:10.1186/1476-072X-4-22
Health Place 2002;8:227-36. PMID:12399212 doi:10.1016/S1353- 24. Google Earth Outreach. Public Health. Available from: http://www.google.com/
8292(02)00008-4 earth/outreach/p_health.html [accessed on 4 June 2008].
11. Sharp BL, Kleinschmidt I, Streat E, Maharaj R, Barnes KI, Durrheim DN, et al. 25. Merida Yucatán SIG. City of Merida. Available from: http://www.merida.gob.
Seven years of regional malaria control collaboration - Mozambique, South mx/sig/ [accessed on 4 June 2008].
Africa, and Swaziland. Am J Trop Med Hyg 2007;76:42-7. PMID:17255227 26. Google Earth KML. What is KML? Available from: http://code.google.com/
12. Srivastava A, Nagpal BN, Saxena R, Eapen A, Ravindran KJ, Subbarao SK, apis/kml/ [accessed on 4 June 2008].
et al. GIS based malaria information management system for urban malaria 27. Arc2Earth. Available from: http://www.arc2earth.com/default.htm [accessed
scheme in India. Comput Methods Programs Biomed 2003;71:63-75. on 4 June 2008].
PMID:12725965 doi:10.1016/S0169-2607(02)00056-1
13. Hernandez-Avila JE, Rodriguez MH, Betanzos-Reyes AF, Danis-Lozano R,
Mendez-Galvan JF, Velazquez-Monroy OJ, et al. Determinant factors for
malaria transmission on the coast of Oaxaca State, the main residual
transmission focus in Mexico. Salud Publica Mex 2006;48:405-17.
PMID:17063824
Bulletin of the World Health Organization | September 2008, 86 (9) 725Research
Saul Lozano-Fuentes et al. Use of Google Earth™ to strengthen public health capacity
Fig. 1. Satellite image of Chetumal, Quintana Roo, Mexico, accessed through
Google Earth™
Fig. 2. Close-up satellite image of south-eastern Chetumal, Quintana Roo, Mexico,
accessed through Google Earth™
Bulletin of the World Health Organization | September 2008, 86 (9) AResearch
Use of Google Earth™ to strengthen public health capacity Saul Lozano-Fuentes et al.
Fig. 9. Basic database and KML structures for geographic areas
Geographic entities
ID Name Description Geometry (OpenGIS)
1 Mexico Country of Mexico 0106000020E6100...
2 Yucatan State of Yucatan 0106000020E6100...
3 Merida Municipality of Merida 0106000020E6100...
4 Merida City of Merida 0106000020E6100...
...
Geographic relations
Child–ID Parent–ID Relation
2 (Yucatan) 1 (Mexico) Included–in
3 (Merida M.) 2 (Yucatan) Included–in
4 (Merida C.) 1 (Merida M.) Included–in
...
Entity Name
Entity Description
Entity Geometry
Entity Geometry
KML, keyhole markup language.
B Bulletin of the World Health Organization | September 2008, 86 (9)You can also read