Teacher Guide Using Google Earth to Investigate the Estuary and Watershed of Waquoit Bay
←
→
Page content transcription
If your browser does not render page correctly, please read the page content below
Teachers on the Estuary (TOTE)
                                                A National Estuarine Research Reserve System program

                                                   Supported by NOAA’s Bay-Watershed Education
                                                           and Training (B-WET) Program

                              Teacher Guide
                      Using Google Earth to Investigate
                 the Estuary and Watershed of Waquoit Bay

Activity Summary
In this activity, students will investigate the watershed of Waquoit Bay, a large estuary located in the towns of
Falmouth (Waquoit) and Mashpee on the southern side of Cape Cod facing Vineyard Sound (see Student Data
Sheet #1, the aerial view of the Waquoit Bay watershed, as also seen below). Students will explore the estuary in
relationship to the dynamic changes that occur in its watershed due to drainage and runoff. Students begin by
examining the watershed using Google Earth. They will find the rivers that contribute fresh water to Waquoit
Bay and the inlets that allow ocean water to enter it. They will locate and discuss possible sources of pollution
and contamination along the rivers that feed the Bay. Using a data graphing tool, they will predict and then
graph two parameters (salinity and turbidity) of water quality change in the Bay after a major rain event. An
optional fourth activity uses a tool from the Environmental Protection Agency (EPA) to locate the watershed in
which the students’ school is located.

Background, Waquoit Bay
Waquoit Bay, as described above, is located in Falmouth and Mashpee on Cape Cod. Much of the Bay and
surrounding land is protected under the auspices of the Waquoit Bay
National Estuarine Research Reserve (www.waquoitbayreserve.org),
known as WBNERR. It is one of a network of 28 National Estuarine
Research Reserves (NERRs) in the US coastal and Great Lake states. The
Reserve system is administered by the National Oceanic and Atmospheric
Administration, NOAA (http://nerrs.noaa.gov). Each reserve is operated
as a partnership between NOAA and the coastal state in which it resides.
The lead state agency for the Waquoit Bay NERR is the Massachusetts
Department of Conservation and Recreation; therefore, WBNERR is part of
the MA state parks system.

The national reserves are protected areas established for long-term
research, monitoring, education, and coastal stewardship. Each focuses on
research and education relevant to its local and regional community. All the
NERR sites participate in estuarine monitoring, coastal training, and graduate
research fellowship programs.

The Waquoit Bay Reserve was established in 1988 and contains over 3000
acres of critical habitat including pine barrens, sand plain grasslands, salt
marshes, estuarine channels, tidal creeks, beach, sand dunes, fresh water
wetlands, and coastal plain streams. It has several historic buildings, formerly
part of an estate, including a visitor center, an education center, and a
dormitory. Waquoit Bay is a representative example of shallow bays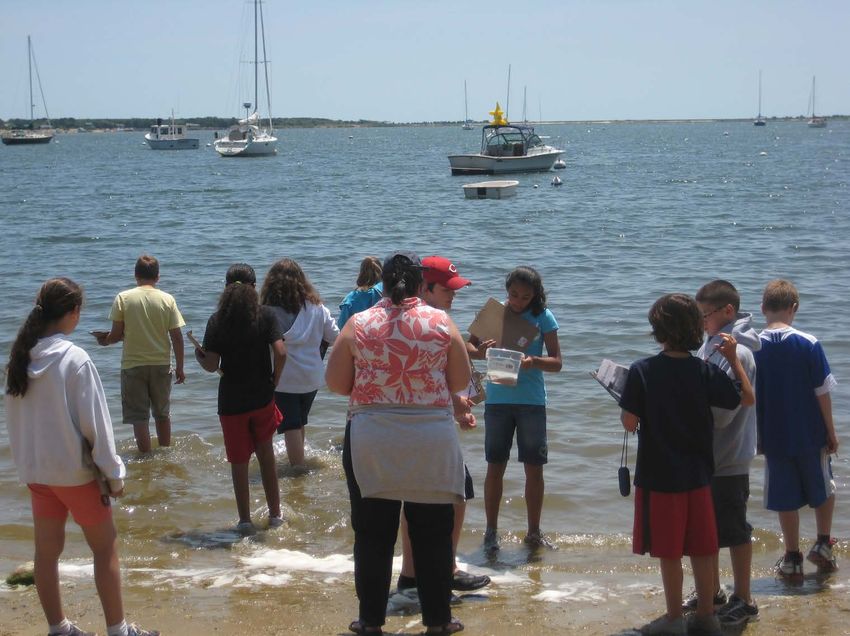
Using Google Earth to Investigate the Estuary and Watershed of Waquoit Bay

throughout the northeastern US, so research here improves the understanding of these areas in general and
promotes stewardship of the coast throughout the region.

WBNERR offers educational programs (K12 through post-college) and workshops about coastal ecosystem
processes, estuarine ecology, coastal geology, and coastal impacts of climate change – including natural history,
human influences, and good stewardship. In addition, teacher training courses are offered in summers and
throughout the year.

Source
This activity (with its four parts) is adapted from the National Oceanic and Atmospheric Administration’s
(NOAA) Estuaries 101 Curriculum, High School version, Earth Science Module, Activity #3, Estuary and Watershed
(http://estuaries.noaa.gov). It has been modified by the staff at WBNERR to focus on the watershed of
Waquoit Bay and is one of the activities taught in their week-long summer course called Teachers on the Estuary
(TOTE).

Learning Objectives
Students will be able to:

1. Define a watershed in general, and describe the watershed of Waquoit Bay in particular.

2. Identify the processes in the watershed that affect conditions in the estuary and explain some specific
   examples.

3. Understand how water quality factors are affected by natural and man-made sources of pollution and
   contamination.

4. Apply their understanding of changes in the watershed and the resulting effects on the estuary to explain
   real-life situations regarding land use and weather in watersheds.

Grade Levels
9-12

Teaching Time
Three to four (45 minute) class sessions and possible homework
Organization of the Activity
This activity consists of four parts which help deepen understanding of estuarine systems:
       Part 1- Exploring the Waquoit Bay Watershed
       Part 2 - What’s Upstream Comes Downstream
       Part 3 - Using Real Data to Investigate Water Quality in the Waquoit Bay Estuary
       Part 4 - Enrichment: Mapping Your Local Watershed

Background, Estuaries and Watersheds
The four parts of this activity are designed to accompany a study of watersheds and/or estuaries. The web site
http://estuaries.noaa.gov provides excellent background information and classroom activities on these topics, as
www.waquoitbayreserve.org											2
Using Google Earth to Investigate the Estuary and Watershed of Waquoit Bay

do many other sites. A brief background is provided on the student reading pages,
but teachers may want to take their students deeper and augment this activity with others.
Background, Google Earth
This lesson plan requires the use of Google Earth (http://earth.google.com). The software must be downloaded
and installed on each computer that will be used. Ideally, the class will work individually on computers in a
school computer lab or in small teams on classroom computers; another option is a single computer running
an LCD projector, operated by the teacher, for the whole class to view.

NOAA’s Estuaries 101 Curriculum has a useful tutorial about Google Earth for teachers who have not had much
experience with it. To find it, go to http://estuaries.noaa.gov, look in the tabs across the top, and click on the
one called Curriculum. A new bar should appear – click on the sub tab entitled Tutorials. Using Google Earth to
Explore Estuaries is the sixth entry down the tutorials page.

As described in the tutorial, “Google Earth is a virtual globe web site that lets people “fly” around Earth,
zooming in for details or zooming out for a broad perspective. Google Earth uses satellite imagery, aerial
photography and a 3D globe, putting the world’s geographic information at your fingertips. Google Earth is a
powerful tool for exploring your world. In your study of estuaries, it can be used to reveal the relationships
among landforms, water features, towns, cities, and the habitats of the animals and plants that live in estuaries.”

A video clip available with this activity provides a Google Earth flyover of the Waquoit Bay watershed. Called
Waquoit Watershed Widescreen, it can be used as an introduction or follow up to Part 1.

Using SWMP Data, Background
Each of the National Estuarine Research Reserves, including Waquoit Bay Reserve, is continuously monitored
by the NERRS System-wide Monitoring Program, or SWMP (pronounced “swamp”). The data collected by
SWMP measures changes in estuarine waters to record how human activities and natural events affect coastal
habitats. Three major components of SWMP are: (1) abiotic indicators of water quality and weather; (2)
biological monitoring; and (3) watershed, habitat, and land use mapping. To collect the data, automated data
loggers are positioned at monitoring stations within the estuaries and record water quality information at 15
minute intervals. Weather stations are located high in the air within the estuary to collect atmospheric data
every five seconds.

In Part 3, students will examine how the water quality in Waquoit Bay changes after a major rain event. They
will focus on abiotic indicators (SWMP major focus #1 in previous paragraph). Abiotic indicators include
nutrients, temperature, salinity, pH, dissolved oxygen, and in some cases, contaminants. For this exercise, the
focus is on two specific parameters (indicators), salinity and oxygen concentration. First, students will predict
how heavy rains might affect the salinity and oxygen concentration of water in the estuary. The students will
then create a graph using data collected at several monitoring sites around Waquoit Bay during an actual large
rain event from April 28 to April 29, 2011. The graph will allow them to compare their predictions with real
data collected and recorded in the SWPM database.

Teachers may want to learn more and practice making the graphs before trying it with students. To find the
tutorial for creating your own graph, go to http://estuaries.noaa.gov and click on the section called Science and
Data in the bar across the top. Click on the subsection called Graphing Tool Tutorial. A page of tutorials will
open, and the one you want, called How to download SWMP Data using the Estuaries.Gov Data Graphing Tool, is the
first one.

www.waquoitbayreserve.org											3

Using Google Earth to Investigate the Estuary and Watershed of Waquoit Bay

To access the Data Graphing Tool itself, go to http://estuaries.noaa.gov, click on the tab on top called Science and
Data, and find the subsection Graphing Tool. When you click on it, a map of the US appears. Wait briefly for
the green buttons and state labels to load. Each green button is the location of a National Estuarine Research
Reserve. If you hover the cursor over Massachusetts you will see some of the monitoring sites at WBNERR,
but, there is an easier method to obtain the data. Detailed information about how to build the graphs is found
in Part 3, Student Instruction Sheet, Graphing Tool.

Within the Science and Data section of http://estuaries.noaa.gov is a Water Quality Parameters Information Sheet.
It is useful for conducting a discussion about abiotic indicators. Information follows about the two parameters
the students will use.
      Water Test:		     Salinity
      What it Measures: Amount of salt in the water
      Natural Reading:  0 ppt (parts per thousand) for fresh water, about 5-30 ppt for estuaries,
      				                       and about 35 ppt for oceans
      Danger Reading:   Salinity can be 40 parts per thousand (ppt) or higher in a salt marsh tide
      				                       pool on a hot day, but this is lethal for most estuary creatures
      Influenced by:		  Tide level, rain events, evaporation, local geology and soils
      Comments:		       Most marine and aquatic organisms are adapted to either fresh water
      				                       (0 ppt) or sea water (35 ppt). Some estuarine organisms and
      				                       anadromous fish can tolerate a wide salinity range.

      Water Test:		           Turbidity
      What it Measures:       Clarity of the water (i.e. how cloudy or clear the water is)
      Natural Reading:        0-10 NPU (Nephelometric Turbidity Units)
      Danger Reading:         Above 20 NPU
      Influenced by		         Sediment, excessive algae growth, storms
      Comments:		             Turbidity determines how much light can penetrate to reach sea grasses. It

Teachers and students will discuss the results of the graph; they will see clearly the drop in salinity (given in
ppt) during the heavy rains from April 28 to April 29, 2011. An increase in turbidity (given in NTUs) is also
observed in association with the storm.

The tutorial provides teachers with information for taking this graphing exercise further by clicking on
individual data points to view their statistics. It explains how to export the data set, how to save and print
the graphs, and how to add data from a second station. The last page of the tutorial contains notes from the
NOAA developers on trouble-shooting potential problems with SWMP data. If a graph is not created, the data
may not be available. Check the box called Data Availability in the dialogue box to see if the data is active.

In case students have trouble with the graphing activity or time is very short, a PDF of the graph is available
and a printout is provided (see Student Data Sheet Part 3)

www.waquoitbayreserve.org											4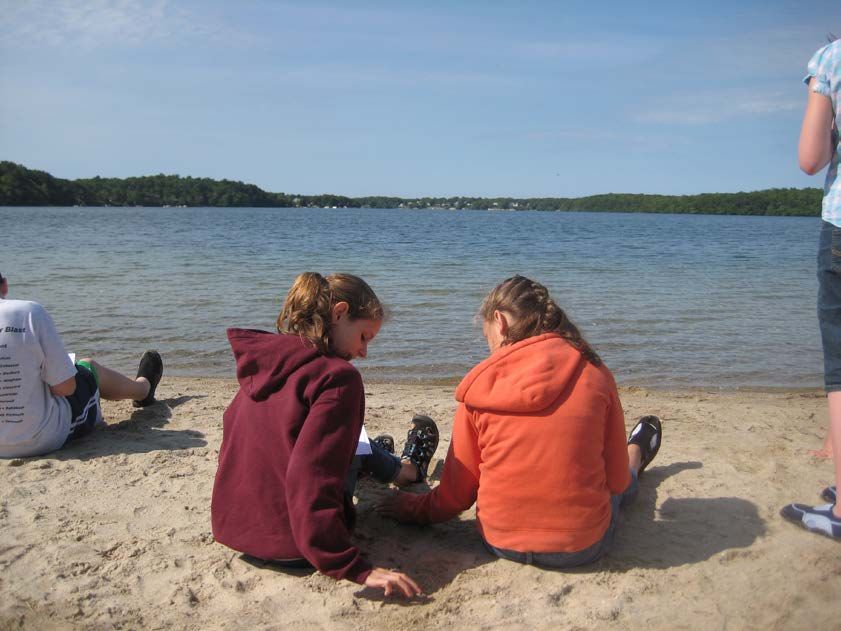
Using Google Earth to Investigate the Estuary and Watershed of Waquoit Bay

Preparation
     •    Students will need to work in a computer lab or in a classroom with an LCD projector with Google
          Earth (http://earth.google.com/) already downloaded, Parts 1-4
     •    Photocopy student reading and worksheets to be used
     •    Optional, set up the WBNERR Video clip called “Waquoit Watershed Widescreen.”

Materials
Students
   • Student Reading: Watersheds and Estuaries
   • Student Worksheet, Part 1, Exploring the Waquoit Bay Watershed
   • Student Data Sheet, Part 1, Aerial View of Waquoit Bay Watershed
   • Student Data Sheet, Part 1, line diagram of Waquoit Bay watershed
   • Student Worksheet, Part 2, What’s Upstream Comes Downstream
   • Student Worksheet, Part 3, Using Real Data to Investigate Water Quality in the Waquoit Bay
       Estuary
   • Student Instruction Sheet, Part 3, Graphing Tool
   • Optional Student Data Sheet, Part 3, two color graph of salinity and oxygen concentration

Teachers
   • Download Google Earth and install it on the classroom computer(s) or computer lab machines, if
       this has not been done already.
   • Color copies, if needed in Part 3, of graph showing salinity and oxygen concentration
   • Optional: Create a Student Worksheet, Part 4, Mapping Your Local Watershed, if desired; find
       topographic maps of the watershed in which your school is located, obtain sheets of Mylar,
       acetate, or tracing paper, and colored markers

Procedure
Part 1 — Exploring the Waquoit Bay Watershed
1.       Hand out the student sheets and materials for Part 1, including Student Reading - Watersheds and
         Estuaries, Student Worksheet, Part 1, and two Student Data Sheets for Part 1 – aerial view and line
         diagram – hold these two until after students have completed most of the activity.

2.       Have students read the Student Reading, or assign it as homework. The Estuaries 101 Curriculum contains a
         glossary that will help define terms used in the reading. To access it, go to http://estuaries.noaa.gov, locate
         the Students tab in the bar across the top, and Glossary is the sub tab on the far right.

3.       Show students where to enter their starting point (Waquoit Bay, Massachusetts) in Google Earth using “Fly
         To.” If students are using Google Earth for the first time, show them how to use the search tool, how to
         zoom in and out to change the viewing altitude, and how to use the motion buttons to navigate around
         the image.

4.       Ask students to complete the Student Worksheet, Part 1, Exploring the Waquoit Bay Watershed, and
         (optional) to label locations on the Student Data Sheets, aerial view or line diagram.

5.       Follow-up with, or use as an introduction, the WBNERR video clip, “Waquoit Watershed Widescreen.”
         Review and discuss the Part 1 tasks and questions.
www.waquoitbayreserve.org											5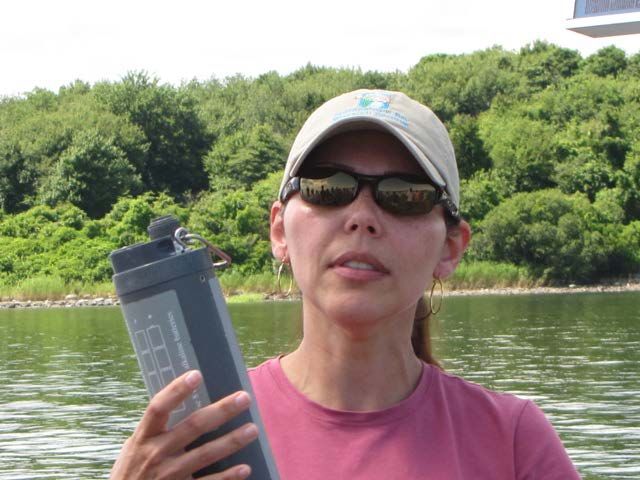
Using Google Earth to Investigate the Estuary and Watershed of Waquoit Bay
Part 2 — What’s Upstream Comes Downstream
1.   Hand out the Student Worksheet, Part 2, What’s Upstream Comes Downstream

2.   Have students “take a Google Earth trip,” looking at the whole Waquoit Bay watershed, to identify areas
     and man-made features that may be potential sources of pollutants and contaminants.

3.   Ask students to complete Student Worksheet, Part 2, and (optional) to label aerial view datasheets.

4.   Review and discuss the Part 2 tasks and questions.

Part 3 — Using Real Data to Investigate Water Quality in the Waquoit Bay Estuary
1.   Hand out the Student Worksheet Part 3, Using Real Data to Investigate Water Quality in the Waquoit Bay
     Estuary, and the Part 3 Student Instruction Sheet, Graphing Tool.

2.   Ask students what might happen to abiotic water quality parameters in the Waquoit Bay estuary after a
     rainstorm. Review various water quality parameters, especially salinity and turbidity, since these are the
     ones for which the students will create graphs.

3.   Have students complete the Student Worksheet, Part 3. They will need access again to Google Earth to
     answer the questions.

4.   Introduce the fact that an actual rain event took place in Waquoit Bay on April 28 and 29, 2011. Show
     the students how to locate and use the SWMP graphing tool and have them create a graph showing both
     salinity and turbidity data for April 25 to May 1, 2011 in Waquoit Bay. If there’s no access to the web, an
     optional graph is available (Student Data Sheet, Part 3); review and discuss the Part 3 tasks and questions.

Part 4 — Optional: Mapping Your Local Watershed
1.   Ask students what they know about the watershed in which their school is located. If possible, walk
     outside the school, scan the neighborhood, and discuss the local watershed with students. Where does
     the water go after it passes through ditches, gutters, creeks, or steams near your school? Back indoors,
     hand out Student Worksheet, Part 4, Mapping Your Local Watershed.

2.   For assistance in locating the boundaries of your watershed, check the Environmental Protection Agency’s
     Surf Your Watershed website at http://cfpub.epa.gov/surf/locate/index.cfm. Information about 20 different
     watersheds in Massachusetts is available on the site; however, it shows Cape Cod as a single watershed.
     Using this site is a good way to view Boston’s Charles River watershed (see Check Your Understanding).
     If your local watershed is not shown, you might search the internet to find your watershed’s managing
     organization and ask for assistance. The Surf Your Watershed contains contact info for many watershed
     associations.

3.   Using Google Earth, have students examine their school’s watershed and ask them to complete the
     Student Worksheet, Part 4

4.   Review and discuss the Part 4 tasks and questions.

www.waquoitbayreserve.org											6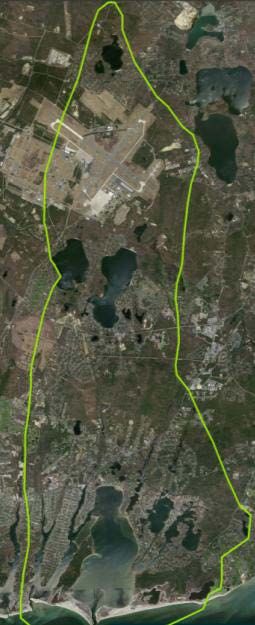
Using Google Earth to Investigate the Estuary and Watershed of Waquoit Bay
Check for Understanding, Optional
   1. Discuss the following:
      • How do agricultural areas, residential areas, industrial sites, landfills, septic systems, and sewage
         treatment plants affect water quality in a watershed?
      • Explain how salt marshes in an estuary can act as a filtration system for runoff in a watershed.
   2. Additional extension activity:
      • Again using Google Earth, find Boston Harbor. Ask students to identify major urban areas around the
         Harbor and the major rivers that drain the surrounding watershed.
      • Ask students to predict the areas in the most danger of contamination and pollution if a major
         storm event, such as a hurricane, were to strike the region.

Note: Because the Check Your Understanding section it is optional, this lesson plan does not include teacher
notes, worksheets, answers to questions, or a list of materials needed. Further details and information can be
found in the Estuaries 101 Curriculum, http://estuaries.noaa.gov.

National Science Education Standards
The following standards cover all four parts of this activity and have been borrowed directly from NOAA’s
Estuaries 101 Curriculum, http://estuaries.noaa.gov.

Content Standard A: Science as Inquiry
 A3. Use technology and mathematics to improve investigations and communications
 A4. Formulate and revise scientific explanations using logic and evidence
 A6. Communicate and defend a scientific argument
Content Standard D: Earth and Space Science
 D2. Geochemical Cycles
Content Standard E: Science and Technology
 E6. Understandings about science and technology
Content Standard F: Science in Personal and Social Perspectives
 F4. Environmental quality
 F5. Natural and human-induced hazards

                                                      Students collect data at John’s Pond,
                                                     located at the top of the Waquoit Bay
                                                                  Watershed.

Massachusetts Science Education Standards
The following standards cover all four parts of this activity and have been compiled based on the 2006
Massachusetts Science and Technology/Engineering Curriculum Framework.

www.waquoitbayreserve.org											7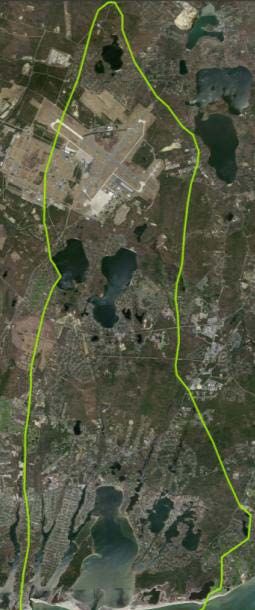
Using Google Earth to Investigate the Estuary and Watershed of Waquoit Bay

Strand 1: Earth and Space Science
Grades 6-8, Mapping the Earth
#1. Recognize, interpret, and be able to create models of the Earth’s common physical features in
    various mapping representations, including contour maps.
Grades 6-8, Earth’s History
#6. Describe and give examples of ways in which the Earth’s surface is built up and torn down by
    natural processes, including deposition of sediments, rock formation, erosion, and weathering.
High School, Matter and Energy in the Earth System
#1.8		 Read, interpret, and analyze a combination of ground-based observations, satellite data, and
		 computer models to demonstrate Earth systems and their interconnections.
Earth and Space Science, High School, Earth’s Processes and Cycles
#3.4		Explain how water flows into and through a watershed. Explain the roles of aquifers, wells,
		porosity, permeability, water table, and runoff.
#3.5		Describe the processes of the hydrologic cycle, including evaporation, condensation,
		precipitation, surface runoff and ground water percolation, infiltration, and transpiration.
Strand 2: Life Science (Biology)
Grades 6-8, Living Things and Their Environment
#10. Give examples of ways in which organisms interact and have different functions within an ecosystem
       that enable the ecosystem to survive.
Grades 6-8, Changes in Ecosystems Over Time
#17. Identify ways in which ecosystems have changed throughout geologic time in response to physical
       conditions, interactions among organisms, and the actions of humans. Describe how changes may be
       catastrophes such as volcanic eruptions or ice storms.
High School, Ecology
#6.2 Analyze changes in population size and biodiversity (speciation and extinction) that result from
       the following natural causes: changes in climate, human activity, or the introduction of invasive,
       non-native species.
#6.4 Explain how water, carbon, and nitrogen cycle between abiotic resources and organic matter in
       an ecosystem, and how oxygen cycles through photosynthesis and respiration.

                                                   Ecosystem changes are observed as you move down
                                                              the Waquoit Bay Watershed.

www.waquoitbayreserve.org											8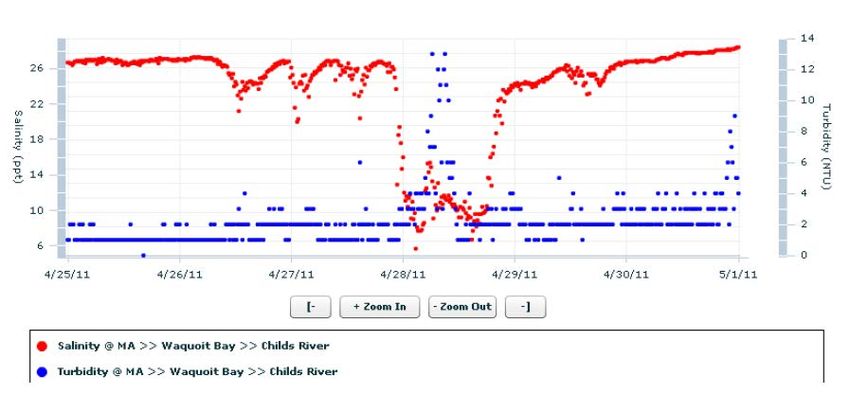
Using Google Earth to Investigate the Estuary and Watershed of Waquoit Bay
Student Reading: Watersheds and Estuaries

A watershed, also called a drainage basin, is the land area in which all water, sediments, and dissolved materials
drain from the land into a common body of water such as a river, lake, estuary, or ocean. A watershed
encompasses not only the water but also the surrounding land from which the water drains. Watersheds
range in size from huge areas like the Mississippi River drainage basin to small areas like your backyard.

An estuary is a partly enclosed, tidally-influenced body of water where fresh water from land mixes with
salt water from the ocean. A typical estuary on Cape Cod starts where the fresh water draining from the
watershed meets the somewhat salty water (brackish) in a bay. The bay connects to the ocean; its water is
brackish because the tides carry salt water into it. So, estuaries can be thought of as places where freshwater
meets seawater. The estuary and the land around it represent a transitional zone where plants and animals
well adapted to brackish water conditions can thrive. What happens upstream in the watershed can affect the
quality of water and the living conditions for organisms that live in the tidal estuary. While the activities you
will be doing focus on brackish water estuaries, another important type – freshwater estuaries – are found, for
example, where freshwater streams meet with very large lakes.

Whether large or small, a watershed’s characteristics can greatly affect how water flows through it. In
many watersheds, as described above, water runs off the land (called runoff) into streams that empty into
estuaries and eventually into the ocean. The watershed you will examine, Waquoit Bay, is slightly different
from this model. Cape Cod, where Waquoit Bay is located, is a remnant of the last glacial retreat (melting),
so it is composed almost entirely of sand and gravel carried and deposited by the ice sheets. The coarse
sands under the Cape’s vegetation are able to hold huge amounts of fresh water (in other words, they
have high permeability). This groundwater system accounts for much of the water that drains from Cape
Cod watersheds into the sea, and it even provides the water we drink. Most of Cape Cod’s ponds and
drinking water reservoirs are simply depressions in the land where groundwater has become exposed. The
groundwater system on which the Cape depends is recharged (replenished) solely by precipitation.

In this activity, you will investigate the Waquoit Bay watershed and estuary using the online mapping tool Google
Earth. Waquoit Bay is located in the towns of Falmouth and Mashpee along the southern side of Cape Cod
on Vineyard Sound (see Student Data Sheet, Part 1, line diagram of Waquoit Bay watershed). Much of the Bay
and surrounding land is protected under the auspices of the Waquoit Bay National Estuarine Research Reserve
(www.waquoitbayreserve.org), known as WBNERR. The area encompasses more than 3000 acres of aquatic
(water)
and terrestrial (land) habitat including estuarine channels,
tidal creeks, freshwater ponds and wetlands, tributary streams,
pine barrens, sand plain grasslands, salt marshes, beaches,
sand dunes, vernal pools, and substantial groundwater resources beneath its lands. The estuary itself has a
maximum depth of 8.9 feet and average depth of 2.6 feet. It is warmer in the summer and colder in the winter
than neighboring Vineyard Sound. Salinity ranges from 0 parts per thousand (ppt) in the upper reaches of the
watershed to about 32 ppt in the open Bay. Approximately 90% of the fresh water enters the Bay through
groundwater. Because Waquoit Bay is a representative example of shallow bays throughout the northeast,
research here improves the understanding of these areas in general and promotes stewardship of the coast
throughout the region.

Water quality in Waquoit Bay is critically impacted by everything that goes on within its watershed.
Agriculture, construction practices, runoff from streets, parking lots, chemically-treated lawns and gardens, and
residential septic systems, as well as accidental discharge of treated municipal sewage all affect water

www.waquoitbayreserve.org											9
Using Google Earth to Investigate the Estuary and Watershed of Waquoit Bay
Student Reading: Watersheds and Estuaries, continued

quality. The watershed’s fresh water resources, as well as Waquoit Bay itself, are impacted by eutrophication
- the excessive growth of algae - resulting from nutrient loading. While algae need nutrients to live, too much
“nutrition” allows them to grow out of control. As large blooms of algae die naturally, bacteria come to the
rescue (decomposers). But, as they feed on the dead algae, they use up more and more of the dissolved
oxygen in thewater leaving less and less for the fish. Coastal eutrophication has many causes: current
wastewater disposal practices (including leaching of residential septic tanks), atmospheric deposition from
the burning of fossil fuels (oil and gas used to generate our electricity, heat our homes, power our vehicles),
and excess use of fertilizers. This problem seriously threatens water quality in all the region’s estuaries, and
it is expected to continue or worsen until large-scale wastewater treatment and other solutions can be
implemented.

Additionally, freshwater resources in Waquoit Bay’s watershed are threatened by toxic (poisonous)
contamination moving through groundwater from the nearby Superfund site at the Massachusetts Military
Reservation (MMR). For years and years, military personnel dumped dangerous chemicals on the ground
or into streams and ponds without realizing the harmful effects on the groundwater below. The federal
government has now set aside huge sums of money for the cleanup of the MMR (a superfund for a super-sized
pollution problem) and at other military and research facilities around the country.

Population growth on Cape Cod threatens the quality of coastal water resources and the quantity of
freshwater resources. Groundwater withdrawal for human consumption could lead to a lowering of the whole
groundwater system, which might have serious impacts on streams, ponds and vernal pools and the organisms
that live in them. Reducing pollution and protecting water quality requires identifying, regulating, monitoring,
and controlling all potential sources of pollution, especially those that could affect groundwater.

                                         The Moonakis River is located in the
                                          lower portion of the Waquoit Bay
                                                    Watershed.

www.waquoitbayreserve.org											10
Using Google Earth to Investigate the Estuary and Watershed of Waquoit Bay
Student Worksheet, Part 1 — Exploring the Waquoit Bay Watershed
In Part 1, you will examine Waquoit Bay’s watershed using Google Earth.
1a. Launch Google Earth. Find the “Fly To” tab on the top of the Search menu on the left. Type
“Waquoit Bay” into the “Fly To” box and press the hand lens icon to begin the search. The globe on the
right will gradually turn and increase in size; wait until it comes back into focus. Experiment using the tools
on the far right; zoom out enough to see the entire bay, and zoom in to get close ups of certain areas. This
can also be done using the scroll bar in the cursor. Move the map in all directions by clicking anywhere on
it, holding down the cursor, and moving the cursor around (the map will move with it).
How many inlets do you see that allow salt water from the ocean to enter Waquoit Bay?
1b. Fly around Waquoit Bay in a clockwise direction starting near the top on the eastern (right) side. How
many rivers can you see that empty into the Bay? (Some will be hard to see, even when you zoom in
close.)
The source of a stream or river is where the watershed begins. From its source, the water travels
downstream toward the estuary. Can you trace back the rivers you identified in the previous question to
their sources? What are some examples of the sources of river water in the Waquoit Bay watershed?
Can you think of other ways, besides stream and rivers, that fresh water enters the Bay?
1c. Trace the path of the Quashnet River, which flows from the northeast corner of John’s Pond into
Waquoit Bay. How does the Quashnet River change from its start (source) to its end (Waquoit Bay)?
What are some of the natural features you can identify along the path of the Quashnet River?
1d. Describe below what kinds of human activity you see along the Quashnet River as it runs from its
source near John’s Pond to its outlet into Waquoit Bay.
www.waquoitbayreserve.org 11Using Google Earth to Investigate the Estuary and Watershed of Waquoit Bay
Student Worksheet, Part 2 — What’s Upstream Comes Downstream
In Part 2, you will use Google Earth to find and discuss possible sources of pollution and contamination along
the rivers that feed into Waquoit Bay.
2a. List six possible sources of pollutants or contaminants within the Waquoit Bay watershed. Be
sure to examine all the rivers, not just the Quashnet River, as well as areas where pollution
could enter the watershed through the groundwater and then flow out into the Bay.
1. ______________________
2. ______________________
3. ______________________
4. ______________________
5. ______________________
6. ______________________
2b. Which of these sources of pollution concerns you the most and why?
2c. What can be done to decrease the impacts of these pollutants or contaminants?
www.waquoitbayreserve.org 12Using Google Earth to Investigate the Estuary and Watershed of Waquoit Bay
Student Worksheet, Part 3 — Using Real Data to Investigate Water Quality in the Waquoit
Bay Estuary
In Part 3, you will study water quality changes in Waquoit Bay after a major rain event.
3a. Based on what you have seen with Google Earth, predict how a major rain event would affect
the water quality in the Waquoit Bay estuary. Focus on two parameters of water quality:
salinity and turbidity.
3b. Define the terms salinity and turbidity below.
Salinity: _________________________________________________________________
Turbidity: _________________________________________________________________
What do you think would happen to the salinity and turbidity concentrations in Waquoit Bay
during, and immediately following, a major rain event?
3c. What features, geologic landforms, or other factors could affect the quality of water in the
Waquoit Bay watershed following a major rain event? (Refer to Google Earth again.)
3d. There really was a large rain event in Waquoit Bay from April 28 to April 29, 2011. Several
monitoring stations are positioned around the estuary to collect and store water quality data.
A special graphing tool will enable you to create a graph showing salinity and turbidity
before, during, and after that rain storm. The directions for making the
computer graph are found on Student Instruction Sheet Part 3 – Graphing Tool.
After you have had time to analyze the graph, write in the space below if your predictions
about salinity and turbidity were correct. If they were not, why were they
different?
www.waquoitbayreserve.org 13Using Google Earth to Investigate the Estuary and Watershed of Waquoit Bay
Career focus: Research Technician
One potential career option in the Reserve
system is a research technician. Research
technicians are responsible for calibrating
research equipment (such as the sonde or data
logger shown in this photo), collecting scientific
data from the System Wide Monitoring
Program or other Reserve research projects,
and entering and analyzing the collected
scientific data. A research technician position
in the Reserve system typically requires a
minimum of a bachelor’s degree in a natural
science field.
Student Instruction Sheet, Part 3 — Graphing Tool
Each of the National Estuarine Research Reserves, including Waquoit Bay Reserve, is continuously monitored
by the NERRS System-wide Monitoring Program, or SWMP (pronounced “swamp”). Data loggers or sondes
(see photo above) automatically collect measurements every 15 minutes. The data collected by SWMP can be
made into graphs for easy observations of water quality changes.
To find the Graphing Tool, go to http://estuaries.noaa.gov, click on the tab along the top bar called Science and
Data, and find the subsection Graphing Tool. When you click on it, a map of the US appears. Wait briefly for the
green buttons and state labels to load. Each green button is the location of a NERR. Check the boxes on the
top right to make sure the Terrain box is depressed so the map is in terrain mode. On the lower left, be sure
that Water, instead of Weather or Nutrients, is indicated.
There are several ways to pull up SWMP data for the monitoring stations in Waquoit Bay. The easiest is
to look in the drop down menu under the map (Click Here to Select Station) and scroll down to the entries
beginning with the letters “MA.” You should find eight monitoring stations listed for Waquoit Bay. Click on the
entry MA – Waquoit Bay – Childs River. If the Bay is not clearly visible on the map, use the Google Earth zoom
tool to get a close up showing the locations of the monitoring sites.
The green dots now represent existing monitoring stations in Waquoit Bay, and you can identify them by
moving the mouse over each dot. When you click on the dot at the Childs River, a graphing dialogue box
appears. It asks for the parameter you wish to view; these are listed in the drop-down menu underneath. Click
on either Salinity or Turbidity. The next step is to give the date range of the data you wish to see (From: and To:).
To obtain the best graph of salinity and turbidity during the large rain event from April 28 to April 29, 2011,
it is important to include the “normal” data from the days before and after the rain. Use the calendar icon
next to From: to find and enter April 25, 2011; then find May 1, 2011 in the To: calendar. The next two entries
in the dialogue box can be ignored for now (Real Time Status and Active Status). Click on Graph, and wait a few
seconds until the dialogue box closes and a graph appears. It will show a curve for either salinity or turbidity
– whichever parameter you asked for - made with data points actually collected during that week. The x-axis
www.waquoitbayreserve.org 14Using Google Earth to Investigate the Estuary and Watershed of Waquoit Bay
shows the dates, and the y-axis gives the values (data). The y-axis for the first parameter is located to the left
of the graph, and the data points are shown in color.
The Graphing Tool allows you to compare the data points and curves for two water quality indicators or two
different stations at once (but no more than two per graph). The date range must be the same for the second
set. To add a second parameter, find the Add Data box and click on it. A dialogue box similar to the first one
will appear. The first entry, Pick Station Type, should already be marked as Water. The second, Pick Station, should
already contain MA – Waquoit Bay – Childs River. In the third box, use the drop down menu and click on the
parameter (either turbidity or salinity – the one you have not yet graphed). Check to see that the correct date
range, April 25, 2011 to May 1, 2011, is already chosen; if not, select these dates. Click on the Add button, and a
small dialogue box called Axis Change will ask if you want to add data with values on a second y-axis. Click the
Yes button. A new graph showing both salinity and turbidity will appear. The y-axis for this second parameter
is to the right of the graph, and the data points are in a different color. Use the tools below the graph to zoom
in on individual data points, or zoom in and out using the scroll wheel on the mouse. The Reset button takes
you back to the map to begin again.
Students explore Waquoit Bay
www.waquoitbayreserve.org 15Using Google Earth to Investigate the Estuary and Watershed of Waquoit Bay
Student Worksheet, Optional, Part 4 — Mapping Your Local Watershed
In Part 4, you will use Google Earth to locate your school’s watershed.
4a. What do you already know about the watershed in which your school is located?
Where does water go after it passes through ditches, gutters, creeks, or streams near your
school?
4b. Search for and locate your school in Google Earth.
For assistance in locating the boundaries of your watershed, check the Environmental
Protection Agency’s Surf Your Watershed website at http://cfpub.epa.gov/surf/locate/index.cfm.
Information about 20 different watersheds in Massachusetts is available on the site; however, it
shows Cape Cod as a single watershed. Using this site is a good way to view Boston Harbor
and the Charles River watershed (see Check For Understanding). If you are looking for a watershed on
Cape Cod, you may want to follow the directions closely to use the Cape Cod Commission’s web app
at http://www.capecodcommission.org/index.php?id=160
If your local watershed is not shown, you might search the internet to find your watershed’s
managing organization and ask for assistance. Many of these organizations can be found on the Surf
Your Watershed website cited above.
Can you identify the approximate boundaries of the watershed surrounding your school?
Can you trace streams and rivers in your community to where they flow into an estuary?
Into what water body does the watershed ultimately drain?
4b. Can you identify some geologic landforms, features, or human impacts that could affect the
water quality in the body of water that receives the drainage of your local watershed?
www.waquoitbayreserve.org 16Using Google Earth to Investigate the Estuary and Watershed of Waquoit Bay
Teacher Answer Sheet, Part 1 — Exploring the Waquoit Bay Watershed
In Part 1, you will examine Waquoit Bay’s watershed using Google Earth.
1a. Launch Google Earth. Find the “Fly To” tab on the top of the Search menu on the left. Type
“Waquoit Bay” into the “Fly To” box and press the hand lens icon to begin the search. The globe on the
right will gradually turn and increase in size; wait until it comes back into focus. Experiment using the tools
on the far right; zoom out enough to see the entire bay, and zoom in to get close ups of certain areas. This
can also be done using the scroll bar in the cursor. Move the map in all directions by clicking anywhere on
it, holding down the cursor, and moving the cursor around (the map will move with it).
How many inlets do you see that allow salt water from the ocean to enter Waquoit Bay?
Answer: Two, the main inlet between Washburn’s Island and South Cape Beach, and the inlet into
Eel Pond
1b. Fly around Waquoit Bay in a clockwise direction starting near the top on the eastern (right) side. How
many rivers can you see that empty into the Bay? (Some will be hard to see, even when you zoom in
close.)
Answer: Student answers will vary; approximately six rivers empty into Waquoit Bay
The source of a stream or river is where it begins. From its source, the water travels downstream
toward the estuary. Can you trace back the rivers you identified in the previous question to their sources?
What are some examples of the sources of river water in the Waquoit Bay watershed?
Answer: Student answers will vary; ponds, bogs, small streams
Can you think of other ways, besides stream and rivers, that fresh water enters the Bay?
Answer: Student answers will vary; most of the water enters as groundwater through the sandy soils
1c. Trace the path of the Quashnet River, which flows from the northeast corner of John’s Pond into
Waquoit Bay. How does the Quashnet River change from its start (source) to its end (Waquoit Bay)?
Answer: Student answers will vary; the Quashnet River’s source is the cranberry bogs near John’s
Pond; beginning as a narrow stream; it begins to widen as it heads south; then it becomes very narrow
as it enters the Quashnet Valley Golf Course; it passes under the golfer’s footbridge and under Rt. 151
on the east side of Mashpee High School; meandering through still more bogs and remaining quite
narrow, the river reaches Rt. 28 near Martin Road in Waquoit; it passes under Rt. 28 and begins to
widen and straighten out as it goes through residential areas and beneath another small bridge; finally it
enters Waquoit Bay to the east of the WBNERR property.
www.waquoitbayreserve.org 17Using Google Earth to Investigate the Estuary and Watershed of Waquoit Bay
Teacher Answer Sheet, Part 1, Exploring the Waquoit Bay Watershed, continued
What are some of the natural features you can identify along the path of the Quashnet River?
Answer: Student answers will vary; natural features include ponds, bogs, hills and valleys, streams, etc.
1d. Describe below what kinds of human activity you see along the Quashnet River as it runs from its
source near John’s Pond to its outlet into Waquoit Bay.
Answer: Student answers will vary; there are roads with cars and trucks that intersect or pass close to
the river; the golf course, housing developments, recreational locations including walking trails and
swimming areas; boats are restricted to the widest rivers and the Bay; there is a section of the river
within walking distance of Mashpee HS and Mashpee Commons
www.waquoitbayreserve.org 18Using Google Earth to Investigate the Estuary and Watershed of Waquoit Bay
Teacher Answer Sheet, Part 2 — What’s Upstream Comes Downstream
In Part 2 you will use Google Earth to find and discuss possible sources of pollution and contamination along
the rivers that feed into Waquoit Bay.
2a. List six possible sources of pollutants or contaminants within the Waquoit Bay watershed. Be
sure to examine all the rivers, not just the Quashnet River, as well as areas where pollution
could enter the watershed through the groundwater and then flow out into the Bay.
Answers: Student answers will vary
1. ______________________ Sewage treatment plants
Residential septic tanks with leaching fields
2. ______________________ Fertilizers (nitrates and phosphates) from golf courses,
cranberry bogs, residential lawns, farm fields
3. ______________________ Run-off from roads and parking lots
Run-off of salts and sand after winter storms
4. ______________________ Housing developments
Flushing left over medications down the drain
5. ______________________ Putting anything other than water down storm drains in the
street
6. ______________________ Effects of thoughtless behavior at recreational areas
Plumes of contamination from past misuse of land
2b. Which of these sources of pollution concerns you the most and why?
Answer: Student answers will vary
2c. What can be done to decrease the impacts of these pollutants or contaminants?
Answer: Student answers will vary; municipal sewage treatment plants and other alternative systems to
eliminate or reduce the use of fertilizers; use only organic fertilizers; reduce residential lawn sizes; preserve open
space; support conservation organizations; take old electronic equipment to collection events (they often contain
small amounts of mercury); save up hazardous wastes and take them to Household Hazardous Products
Collection events including old thermometers, used oil and gas, leftover oil-based paints, paint thinners, oven and
drain cleaners, solvents, old batteries, and many other items (obtain a copy of your town’s hazardous waste
brochure that lists items and collection dates); dispose of outdated or unused pills and other medical products
according to your town Health Department’s suggested methods- don’t flush down drain, save energy by riding your bike,
carpooling, turning off electrical gadgets when not in use,… many more….
www.waquoitbayreserve.org 19Using Google Earth to Investigate the Estuary and Watershed of Waquoit Bay
Teacher Answer Sheet, Part 3 — Using Real Data to Investigate Water Quality in the
Waquoit Bay Estuary
In Part 3, you will study water quality changes in Waquoit Bay after a major rain event.
3a. Based on what you have seen with Google Earth, predict how a major rain event would affect
the water quality in the Waquoit Bay estuary. Focus on two parameters of water quality: salinity
and turbidity.
Answer: Student answers will vary;
3b. Define the terms salinity and turbidity below.
Answer: Student answers will vary
Salinity: The concentration of salts dissolved in a volume of liquid (for example, salt water).
_____________________________________________________________________
Answer: Student answers will vary
Turbidity:The reduction in the clarity of water due to the presence of particles suspended in the water.
______________________________________________________
What do you think would happen to the salinity and turbidity in Waquoit Bay
during, and immediately following, a major rain event? (Write your answers below if there is
not enough space above.)
Answer: Student answers will vary.
3c. What features, geologic landforms, or other factors could affect the quality of water in the
Waquoit Bay watershed following a major rain event? (Refer to Google Earth again.)
Answer: Student answers will vary; flooded cranberry bogs, golf courses, and residential lawns might release
fertilizers and pesticides; surface water would percolate down into the ground until the ground water would
become saturated; run-off from roads and other surfaces would increase; residential septic tanks and their
adjacent leaching fields could fill and their accidental drainage would likely contribute more partially-treated
sewage to the waters; most of it would eventually find its way into the estuary where it may have a
harmful impact on the organisms living there
3d. There really was a large rain event in Waquoit Bay from April 28 to April 29, 2011. Several
monitoring stations are positioned around the estuary to collect and store water quality data.
A special graphing tool will enable you to create a graph showing salinity and turbidity before, during,
and after that rain storm. The directions for making the computer graph are found on Student
Instruction Sheet Part 3 – Graphing Tool.
After you have had time to analyze the graph, write in the space below if your predictions
about salinity and turbidity were correct. If they were not, why are they different than you expected?
Answer: Student answers will vary depending on what predictions they made.
www.waquoitbayreserve.org 20Using Google Earth to Investigate the Estuary and Watershed of Waquoit Bay
Teacher Answer Sheet, Optional, Part 4 — Mapping Your Local Watershed
In Part 4, you will use Google Earth to locate your school’s watershed.
4a. What do you already know about the watershed in which your school is located?
Answer: Student answers will vary
Where does water go after it passes through ditches, gutters, creeks, or streams near your
school?
Answer: Student answers will vary
4b. Search for and locate your school in Google Earth.
For assistance in locating the boundaries of your watershed, check the Environmental
Protection Agency’s Surf Your Watershed website at http://cfpub.epa.gov/surf/locate/index.cfm.
Information about 20 different watersheds in Massachusetts is available on the site; however, it
shows Cape Cod as a single watershed. Using this site is a good way to view Boston Harbor
and the Charles River watershed (see Check For Understanding).
If your local watershed is not shown, you might search the internet to find your watershed’s
managing organization and ask for assistance. You could also ask your local GIS office in town hall for
help. The Surf Your Watershed website also has contacts for many watershed organizations.You can also
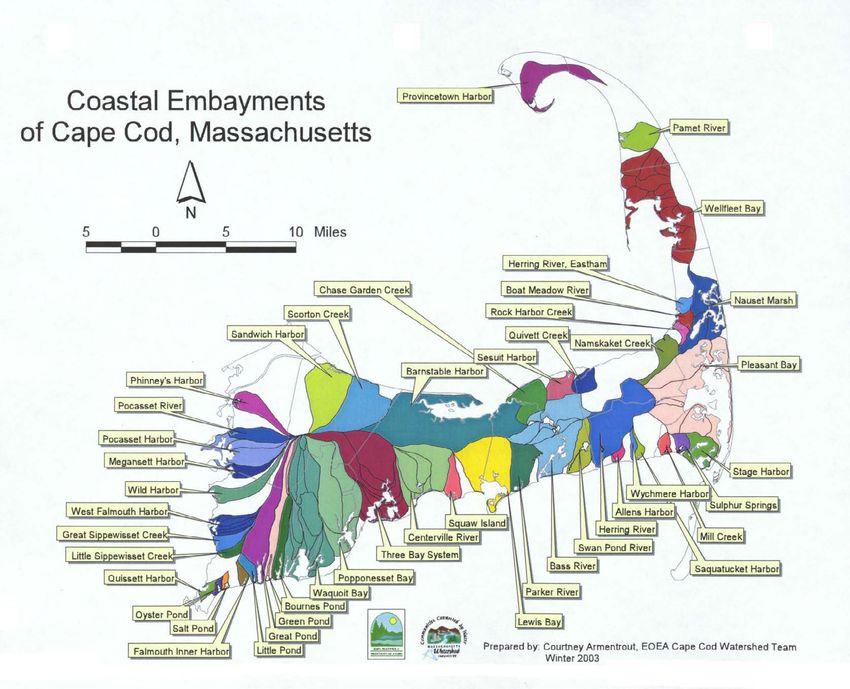
reference the diagram below to determine Cape Cod watershed boundaries.
Cape Cod Watersheds
www.waquoitbayreserve.org 21Using Google Earth to Investigate the Estuary and Watershed of Waquoit Bay
Teacher Answer Sheet, Optional, Part 4 Continued — Mapping Your Local Watershed
Can you identify the approximate boundaries of the watershed surrounding your school?
Answer: Student answers will vary
Can you trace streams and rivers in your community to where they flow into an estuary?
Answer: Student answers will vary
Into what water body does the watershed ultimately drain?
Answer: Student answers will vary
4b. Can you identify some geologic landforms, features, or human impacts that could affect the
water quality in the body of water that receives the drainage of your local watershed?
Answer: Student answers will vary
www.waquoitbayreserve.org 22Using Google Earth to Investigate the Estuary and Watershed of Waquoit Bay Student Data Sheet, Part 1 — Exploring the Waquoit Bay Watershed Aerial View of Waquoit Bay Watershed Label parts of the watershed that you can identify using Google Earth. www.waquoitbayreserve.org 23
Using Google Earth to Investigate the Estuary and Watershed of Waquoit Bay

Optional Student Data Sheet, Part 3 — Using Real Data to Investigate Water Quality in the
						Waquoit Bay Estuary

Two Color Graph of Salinity and Turbidity

www.waquoitbayreserve.org											24
Using Google Earth to Investigate the Estuary and Watershed of Waquoit Bay

Extension Activity: Meaningful Watershed Education Experience
A great way to make what they’re learning on-line real is for your students to do a watershed field trip. This
extension activity allows students to explore the watershed that they studied in Google Earth. Students will visit
various stops along the watershed, starting at the top, and observe the differences at each location. Pick several
different sites along the watershed so students are able to see not only the change in the landscape but also
the change in the parameters among the sites. Students will have a journal to record their observations and
parameters as well as draw a picture of each location (see journal template on page 27). This activity can be
adapted for your local watershed if necessary.

At each location, the following parameters should be taken:
   • Air temperature
   • Dissolved Oxygen
   • Water temperature
   • Wind speed and direction
   • Water salinity
   • Water pH

Materials required:
  • Refractometer or Hydrometer
  • Thermometer
  • Litmus/pH paper or ph colorimeter kits
  • Wind meter
  • Compass (for wind direction)
  • Dissolved oxygen meter

www.waquoitbayreserve.org											25
Using Google Earth to Investigate the Estuary and Watershed of Waquoit Bay

Extension Activity: Meaningful Watershed Education Experience

Student Journal Template

Site:
Time: 					pH:
Weather: 					Salinity(ppt):
Water Temperature: 		     Wind Speed:
Air Temperature:			Direction:
Dissolved Oxygen(DO ppm):
Evidence of Humans:

Animals:					Plants:

Sketch of Land and Water:

www.waquoitbayreserve.org											26
You can also read