Food for thought IN THIS EDITION - Farmland: an untapped asset class? Quantifying the opportunity to invest in agriculture
←
→
Page content transcription
If your browser does not render page correctly, please read the page content below
MACQUARIE AGRICULTURAL FUNDS MANAGEMENT
December 2012

Food for thought
IN THIS EDITION

Farmland:                                     Analysis:                                     Water scarcity:
an untapped asset                             Global farmland in                            an investment
class? Quantifying the                        a portfolio context                           opportunity?
opportunity to invest                         How can agriculture contribute toward         According to the UN, over the next
in agriculture                                lowering risks within a portfolio of          two decades global demand for fresh
                                              investments? Traditional portfolio analysis   water will vastly outstrip reliable supply
While interest is building in farmland        is difficult to apply to farmland due to      in many parts of the world. Several
investing, institutional investment is        the paucity of agricultural performance       major population centres of both rich
estimated at a modest $30-40 billion, a       data sets and benchmarks. In this             and poor nations have reached a point
small fraction of the total global value of   article our research concludes that           of physical scarcity which is forcing
farmland of $8.4 trillion. We explore the     an internationally diversified portfolio      them into pursuing costly water transfer
amount and distribution of agricultural       of agricultural land could contribute         alternatives. A further consequence
land and the relative yields and total land   significantly to delivering positive,         for the food supply in these parts of
values of the top investment countries.       uncorrelated capital returns compared         the world is that goods that were once
This has enabled us to provide insight        to other asset classes.                       produced domestically with local water
into the investable universe of farmland,     Continued page 8
                                                                                            supplies may now be imported.
estimated at $1 trillion.                                                                   In this article we look at where the
Continued page 3                                                                            world’s water supply is being used, and
                                                                                            how increased demand this may lead to
                                                                                            investment opportunities.
                                                                                            Continued page 12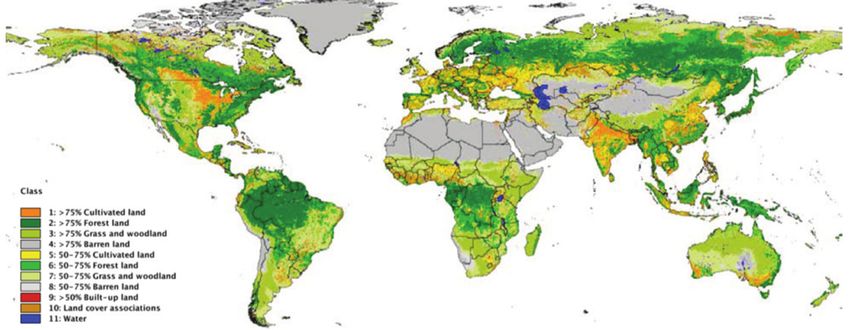
Macquarie Agricultural Funds Management                                                                                                           Newsletter: Food for thought

We invest in an inescapable fact.
People need to eat and changing demographics are driving higher food prices.
We take a unique approach to investing in food production, by bringing both investment management and
farming expertise in-house and under one roof.

                                                                              Agricultural
                                                                              experience,
                                                                              institutional
                                                                               investment
                                                                                discipline.

Editor:
Bradley Wheaton, Macquarie Agricultural Funds Management
Tim Hornibrook, Macquarie Agricultural Funds Management
Authors:
Bradley Wheaton, Macquarie Agricultural Funds Management
William J. Kiernan, Global AgInvesting Research & Insight
Samuel Morris, Macquarie Agricultural Funds Management
Andrew Sliper, Macquarie Agricultural Funds Management
Contributors:
Rhiannon Johnson, Macquarie Agricultural Funds Management

DISCLAIMER
The information in this document is of a general nature for discussion purposes only and does not constitute financial product advice. None of the information in this document takes into
account any person’s personal objectives, financial situation or needs and you must determine whether the information is appropriate in terms of your particular circumstances. Legal, tax and
financial advice should be sought before making any investment decision.
No liability is accepted for any unauthorised use of the information in this document.
This document has been prepared based on information believed to be accurate at the time of the preparation of this document. Subsequent changes in circumstances may occur at any time
and may impact the accuracy of the information in this document. Past performance is no indication of future performance.
Any subsidiaries of Macquarie Group Limited referred to in this document are not authorised deposit-taking institutions for the purposes of the Banking Act 1959 (Commonwealth of Australia),
and their obligations do not represent deposits or other liabilities of Macquarie Bank Limited ABN 46 008 583 542 (MBL). MBL does not guarantee or otherwise provide assurance in respect
of the obligations of Macquarie Group Limited subsidiaries referred to in this document.
                                                                                                                                                                                                 2
Macquarie Agricultural Funds Management                                                                                                                                 Newsletter: Food for thought

Farmland: an untapped asset class?
Quantifying the opportunity to invest in agriculture
By Bradley Wheaton                                                                                                   One of the major challenges in effectively analysing the sector
Agricultural Product Specialist, Macquarie Agricultural                                                              is to obtain accurate and timely market data1. The analysis
Funds Management                                                                                                     undertaken here draws on current and informed sources to
and William J. Kiernan                                                                                               provide insight into the size, scope and ownership structures
Director of Global AgInvesting Research & Insight                                                                    that shape the opportunity to invest in agricultural land globally.

There has been increasing attention paid to farmland                                                                 In analysing the major agricultural regions and the countries
investment opportunities in recent years. However, what may                                                          being targeted by agricultural investors, the data demonstrates
be surprising to some is that this interest is only just starting                                                    that while areas such as the U.S. have higher levels of
to flow into the sector in the form of investment by institutions.                                                   institutional investor ownership, farmland ownership globally
Investors and advisers alike are looking to better understand                                                        is heavily dominated by family farmers who both own and
the size and structure of the investable asset base before                                                           operate their farms. Given the small scale of the average farm
committing resources to understanding the intricacies of                                                             globally and the challenges for such businesses accessing
the sector or investing in the establishment of an agriculture                                                       capital, the scope and need for institutional capital to be
investment platform.                                                                                                 deployed in agriculture in order to improve efficiencies and
                                                                                                                     generate higher returns is significant.

                                              Canada
                                              378 Million ha                                                                                               Russia
                                                                                                                                                     1,024 Million ha

                                                                                                     Ukraine
                                                                                                     51 Million ha

              U.S.A.
              707 Million ha

                                                                                                                                          Kazakhstan
                                                                                                                                          213 Million ha

                                                                                         Brazil
                                                                                    786 Million ha

                                     Chile                                                                                                                  Australia
                                     32 Million ha                                                                                                          559 Million ha

                                         Argentina
                                         170 Million ha

                                                                                                                                                                                       New Zealand
                                                                                                                                                                                         20 Million ha

                                                                    Uruguay
                                                                    17 Million ha

       Arable land             Forest area                 Permanent Crop land                       Pasture land
Source: FAO 2011, Macquarie Agricultural Funds Management 2012.

1   In established markets such as the US, Australia and Canada government data is collected systematically and is publically available. While there are limitations
    around the timeliness and some biases inherent in some of the collection methods used, it is generally useful in understanding the sector. In markets where
    governments have not or only recently commenced collecting data it is often independent industry consultants or non-Government organisations that have more
    accurate data.
                                                                                                                                                                                                         3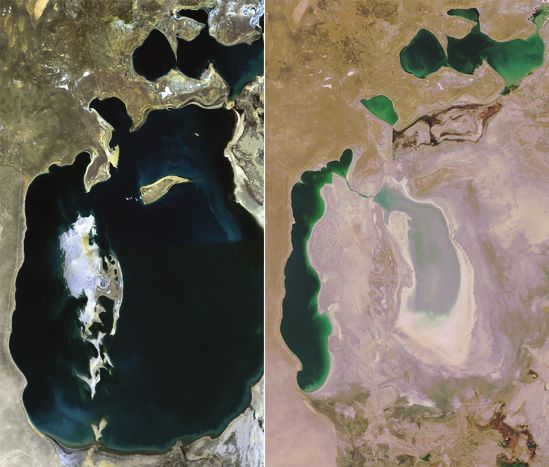
Macquarie Agricultural Funds Management                                                                                             Newsletter: Food for thought

The investable universe of farmland                                                     Arable land per capita (hectares per person)
The United Nations Food and Agriculture Organisation (UN                                2012 population estimate
FAO) maintains a database of the total agricultural land area
throughout the world. The two major classifications of farmland                                  Australia
are arable land2 – the land used for row crops or broad acre,                                     Canada
and permanent crops3 – the land planted with trees or vines.
                                                                                               Kazakhstan
The availability of arable land is of interest to investors for the
                                                                                        Russian Federation
following key reasons:
                                                                                                 Argentina
>> it faces the greatest demand of all agricultural land and is
                                                                                                  Ukraine
   decreasing in availability on a per capita basis. Since 1960,
   the amount of arable land per capita available for agriculture                                 Uruguay

   globally more than halved4                                                                United States

>> for the land that is agronomically suitable, crops are                                           Brazil

   predominantly the highest value and best use of the land                                  New Zealand

>> the land is mostly used for producing grains (e.g. wheat,                                         Chile

   corn, barley), oilseeds (e.g. soybean, canola/rapeseed,                                               0.0         0.5          1.0          1.5         2.0          2.5
   sunflower) and fiber (e.g. cotton).These commodities are
                                                                                        Source: CIA Fact book 2012 and FAO 2011.
   experiencing increasing demand for use as food, animal
   feed and increasingly biofuel and industrial production.
                                                                                        Spatial agricultural land use by type
                                                                                        The graphic below shows the spatial distribution of the land
                                                                                        use types globally. The key observation is the prevalence of
                                                                                        cultivated land shown in orange (>75 per cent) and yellow
                                                                                        (50-75 per cent).The areas shown as grass and woodland
                                                                                        also contain the land producing row crops.

       Class
       1: > 75% Cultivated land
       2: > 75% Forest land
       3: > 75% Grass and woodland
       4: > 75% Barren land
       5: 50-75% Cultivated land
       6: 50-75% Forest land
       7: 50-75% Grass and woodland
       8: 50-75% Barren land
       9: > 50% Built-up land
       10: Land cover associations
       11: Water

Source: IIASA and FAO, 2009.

2   Arable land is the land under temporary agricultural crops (multiple-cropped areas are counted only once), temporary meadows for mowing or pasture, land under
    market and kitchen gardens and land temporarily fallow (less than five years). The abandoned land resulting from shifting cultivation is not included in this category.
3   Permanent crops is the land cultivated with long-term crops which do not have to be replanted for several years (such as cocoa and coffee); land under trees and
    shrubs producing flowers, such as roses and jasmine; and nurseries (except those for forest trees, which should be classified under “forest”).
4   FAO 2012
5   World Bank, Agroconsult 2011
                                                                                                                                                                              4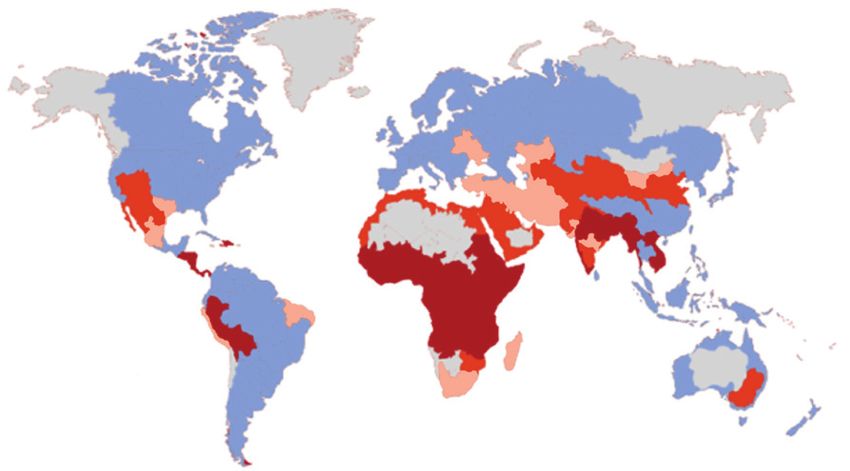
Macquarie Agricultural Funds Management Newsletter: Food for thought
Global agricultural land ownership Cereal crop yield
Yield
ton/ha
8 United States
Chile
7 China
Argentina
Owner operators Institutional Uruguay
$8.4 trillion investors 6
$30-40 billion Brazil
Canada
Other 5
Ukraine
India
Owned by 4 Russian Federation
non-institutional investors Australia
$70-100 billion
3 Kazakhstan
2
1
Source: FAO 2011, Global AgInvesting Research & Insight Estimates 2012, 0
1961
1963
1965
1967
1969
1971
1973
1975
1977
1979
1981
1983
1985
1987
1989
1991
1993
1995
1997
1999
2001
2003
2005
2007
2009
Macquarie Agricultural Funds Management 2012.
* Institutional investors are predominantly public, industry and corporate pension * Cereal yield, measured as tons per hectare of harvested land, includes wheat,
plans, foundations and endowments. rice, maize, barley, oats, rye, millet, sorghum, buckwheat, and mixed grains.
# Non-institutional investors are those private individual investors that seek to Production data on cereals relate to crops harvested for dry grain only.
own but not to operate agricultural enterprises. Source: FAOSTAT, 2012.
There are some important observations from this data: >> of all the countries that have surplus arable land,
>> the U.S., Russia, Brazil, Canada, Australia, Ukraine and Brazil has the largest area of arable land available for
Argentina are the only countries to have over 30 million expansion, approximately 22 million hectares. The land is
hectares of arable land. predominantly located in the Cerrado region in central Brazil
and not in the Amazon biome where land clearing for crop
>> only Brazil, Argentina and Australia have over five million production is strictly regulated by law7.
hectares of suitable land yet to be brought into crop
production5.
>> Australia has the most arable land per capita, with over
two hectares per person. This is more than four times that
of the US. The higher the proportion of arable land per
capita a country has, the greater its opportunity to export its
agricultural produce.
>> while there are significant areas of arable land in Russia,
Kazakhstan and the Ukraine, utilisation rates are much lower
and crop yields lower mainly due to poor farming practices
limiting productivity. Low productivity is symptomatic of
challenges to agriculture such as the lack of infrastructure,
government regulation stifling activity or a lack of human
resources6.
>> average crop yields are low in Australia due to the large
proportion of low density cropping that constitutes the
overall arable land area.
6 World Bank Group Agriculture Action Plan 2010-2012
7 United Nations Department of Economic and Social Affairs, 2012
5
Macquarie Agricultural Funds Management Newsletter: Food for thought
Value of the investment opportunity
Estimated farm land value ($US billions)
1,083.0 1,557.9
United States
359.3 333.2
Brazil
208.3 217.0
Argentina
81.2 216.9
Australia
190.9 18.5
Canada
140.8 36.8
Russian Federation
74.0
Kazakhstan
28.2
3.2
Ukraine
38.4
21.9
New Zealand
13.3
19.6
Chile
8.8 Pasture and range land
10.3 Arable land (annual and permanent crops)
Uruguay
5.4
0
100
200
300
400
500
600
700
800
900
1,000
1,100
1,200
1,300
1,400
1,500
1,600
1,700
1,800
1,900
2.000
2,100
2,200
2,300
2,400
2,500
2,600
2,700
2,800
Farm land value ($bn)
Source: FAO 2011, Global AgInvesting Research & Insight Estimates 2012, Macquarie Agricultural Funds Management 2012.
What is striking is the proportion of land owned and operated This contrasts with estimates that institutional ownership in
by family farmers, resulting in a very fragmented industry. One countries such as Australia, Argentina, Brazil and Canada is
of the attractive factors from an investment perspective is the below 10 per cent and in many cases below 2 per cent10.
opportunity for consolidation given the importance of scale in Former Soviet Union Countries have differing land ownership
driving returns from agriculture. structures. In some cases it is only the government that is able
Agricultural land ownership is predominately fragmented, with to own land, and access to farmland is only available through
ownership resting largely with family owner operators who own leasehold tenure.
a single property. However, there is a significant difference
between the structure of the US market compared to that
of other countries. Non owner-operators or, in other words,
investors who do not themselves farm (including institutions)
owned 29 per cent of farmland in 2007 and the Corn Belt had
a higher proportion at 38 per cent8. While investor ownership
is significant in the U.S., foreign ownership of cropping land is
still low at 0.4 per cent as of 2010, with 0.6 per cent of pasture
land owned by foreigners and one per cent of all forest land9.
8 USDA, 2012, Trends in US Farm values and ownership
9 USDA, 2012, Trends in US Farm values and ownership
10 Global AgInvesting Research & Insight, 2012
6
Macquarie Agricultural Funds Management                                                                                          Newsletter: Food for thought

Comparison to the timber industry
                                                Agriculture

                                              Total land value
                                                 $8,300bn
                                                                                                            Timber
                            Investable universe
                                                                                                                                    Total land value
                            estimate#
                                                                                                                                             $425bn
                            $1,000bn

                                                                                                                                Investable universe
                                                                                                                                          estimate#
                                                                                                                                           $300bn

                 Institutionally owned                                                                                        Institutionally owned
                 $35bn                                                                                                                        $60bn
Source: FAO 2011, GMO 2011, HNRG 2012, Global AgInvesting Research & Insight Estimates 2012, Timberland Investment Resources 2012, Macquarie Agricultural
Funds Management 2012.
# Investable universe estimate

The total land value is reduced to the investable universe due to a range of factors that significantly restrict or prevent institutional investment including a lack of
basic infrastructure, adverse governmental policies or unacceptable social and environmental risks.

Institutions with alternative investment allocations are attracted to                large scale assets, which in some cases were run by existing
farmland for similar reasons that drove them to invest in timber                     management teams, became available for investment. Another
land over the last few decades. Institutional capital started                        factor is the liquidity in the sector, albeit there are varying degrees
to move into timber land in the 1970s, with forest product                           to which this is evident from country to country.
companies and state land authorities looking to take large land
holdings off their balance sheet. This was aided in the US by                        Conclusion
the passage of the Employee Retirement Income Security Act
                                                                                     Agricultural land assets sit at an estimated $8.3 trillion in total
(ERISA) in 1974 that required greater diversification in institutional
                                                                                     value with an estimated $1 trillion11 of that being investable.
investment portfolios. The timber industry today has attracted
                                                                                     This represents a compelling opportunity for institutional
approximately100 institutional investors from public and private
                                                                                     investors. While growth in investor interest has been strong,
pensions, foundation, and endowment funds.
                                                                                     there has been a moderated translation into investment
It is the low correlations, relative stability of returns and inflation              flows. Gradually, the industry is developing a track record
protection shared by both agriculture and timber land that are                       and investors and their advisors are developing a deeper
driving institutional interest.                                                      understanding of the opportunity. With that, a new asset class
Why then is agriculture so far behind timber in terms of                             is establishing.
institutional investment relative to industry capitalisation? One                    Until recently, agriculture and farmland did not have a
factor explaining this is the fragmented nature of farming and the                   natural home in the investment portfolios of the mainstream
absence of large operations with appropriate diversification and                     institutions. This is now changing and has the potential to
institutional-grade management in place. Compare this to origins                     make significant changes to capital ownership structures in
of timber as an asset class, where forests owned by timber mills                     the industry and the quantum of investment in the sector
and state land authorities were divested, as those organisations                     over time.
sought to run more ‘efficient’ balance sheets. This meant that
11   Source: FAO 2011, GMO 2011, HNRG 2012, Global AgInvesting Research & Insight Estimates 2012, Macquarie Agricultural Funds Management 2012
                                                                                                                                                                           7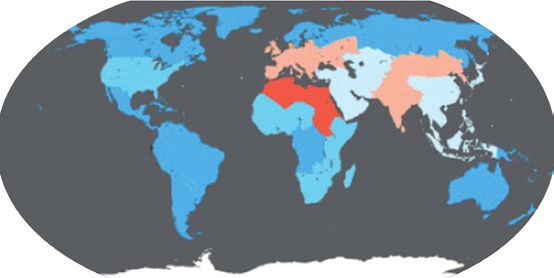
Macquarie Agricultural Funds Management Newsletter: Food for thought
Analysis: Global farmland in a
portfolio context
By Samuel Morris, CFA methods, ownership structures (owner-operator versus
Analyst, Macquarie Agricultural Funds Management lease arrangements) and the private nature of agricultural
land transactions.
Synopsis The analysis was conducted over two periods:
Traditional portfolio analysis is difficult to apply to farmland >> monthly returns over 10 years from 30 June 2001 to
due to the paucity of agricultural performance data sets 30 June 2011
and benchmarks.
>> monthly returns over five years from 30 June 2006 to
In this article, we look at how agriculture can help lower 30 June 2011.
portfolio risk, using multi-country agricultural land price data
The farmland price data points varied from quarterly to annual,
sourced from a combination of public and private sources.
with linear interpolation2 being used to estimate land values
Our analysis concludes that owning farmland has the potential
between actual data points3.
to deliver uncorrelated, positive returns over the long term.
It demonstrates that an internationally diversified portfolio of
agricultural land could contribute significantly to delivering Results – risk vs. return
positive, uncorrelated capital returns compared to other Over the two periods we looked at, global farmland performed
asset classes, while lowering portfolio risk. The analysis is very well, having the highest Sharpe ratio4 of the asset class
limited to returns derived from owning, but not operating, comparison over both time periods.
farmland. Exposure to these two sources of return, being land
appreciation and operating returns, has the potential to deliver
2001-2011 Real Returns and Risk
higher and more diversified returns for an investment portfolio High
Return
and should be considered when evaluating the opportunity to 14.00%
Emerging Equities
invest in agriculture. 12.00%
10.00% Agricultural Land
Real Returns
Methodology 8.00%
6.00%
In undertaking this work, we selected six global listed and/ Bonds Cash
4.00%
or liquid financial asset indices representing some of the Developed Equities
2.00%
major traditional asset classes for institutional investors.
0.00%
Alternative asset classes, such as hedge funds, private equity Low
%
%
%
%
0%
0%
0%
0%
0%
0%
0%
0%
0%
00
50
00
50
Return
.0
.5
.0
.5
.0
.5
.0
.5
.0
and infrastructure were omitted to avoid controversy around
0.
2.
5.
7.
10
12
15
17
20
22
25
27
Risk 30
benchmark selection and to better contrast agriculture to Low Risk High Risk
traditional bond, equity and property allocations.
2006-2011 Real Returns and Risk
High
Agricultural land price data sets from the US, Australia and Return
14.00%
Brazil were averaged to form a proxy for a globally diversified 12.00%
agricultural land return index. These agricultural land prices Agricultural Land
10.00%
were translated into $US at each historical data point to match Emerging Equities
Real Returns
8.00%
the financial asset indices. Returns were adjusted to real terms
6.00%
using US all-items CPI inflation1. Bonds
4.00% Cash
We carried out our analysis on an agricultural land return- 2.00%
only basis, which means the returns did not include the yield 0.00%
Developed Equities
component, only capital value changes. As agricultural land Low
%
%
%
%
0%
0%
0%
0%
0%
0%
0%
0%
0%
Return
00
50
00
50
.0
.5
.0
.5
.0
.5
.0
.5
.0
0.
2.
5.
7.
markets are inherently private, it is difficult to obtain directly
10
12
15
17
20
22
25
27
30
Risk
comparable data on operating returns from farmland across Low Risk High Risk
countries due to different accounting and data collection
1 For a detailed description of the asset indices chosen, please see appendix 1.
2 If the two known points are given by the coordinates the linear interpolant is the straight line between these points
3 For the financial asset indices, the data points are end of month.
4 The Sharpe ratio is the ratio of excess return (return over the risk free rate) per unit of risk (standard deviation)
8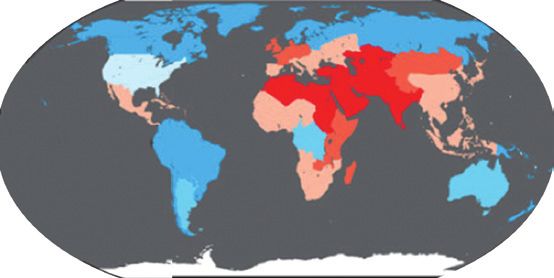
Macquarie Agricultural Funds Management Newsletter: Food for thought
Results – time series comparison
On a time series basis, diversified agricultural land ownership has performed well, generally outperforming the other major asset
classes in $US terms and in the relevant local currencies.
Agricultural land vs bonds vs equities v property (nominal index) Agricultural land vs bonds vs equities v property (nominal index)
– 10 year – 5 year
380.00 200.00
180.00
330.00
160.00
280.00
140.00
230.00 120.00
100.00
180.00
80.00
130.00 60.00
40.00
80.00
20.00
30.00 0.00
01
02
03
04
05
06
07
08
09
10
11
06
07
08
09
10
11
n-
n-
n-
n-
n-
n-
n-
n-
n-
n-
n-
n-
n-
n-
n-
n-
n-
Ju
Ju
Ju
Ju
Ju
Ju
Ju
Ju
Ju
Ju
Ju
Ju
Ju
Ju
Ju
Ju
Ju
Agricultural Land (USD) Agricultural Land (local) Bonds Developed Equities Property Agricultural Land (USD) Agricultural Land (local) Bonds Developed Equities Property
Results – Correlation and diversification
Agricultural land ownership represents an asset class that offers distinct diversification benefits when compared to traditional
asset classes. Low real return correlations have shown a diversification benefit over both a 10 year period and over the past
five years, up to mid-2011.
Correlation Matrix – 10 years
Ag Land Developed Equities Emerging Equities Property Cash Bonds
Ag Land 1.00 0.55 0.55 0.41 0.19 0.02
Developed Equities 1.00 0.89 0.72 0.45 0.16
Emerging Equities 1.00 0.67 0.44 0.13
Property 1.00 0.12 -0.02
Cash 1.00 0.77
Bonds 1.00
Correlation Matrix – five years
Ag Land Developed Equities Emerging Equities Property Cash Bonds
Ag Land 1.00 0.51 0.54 0.36 0.24 -0.03
Developed Equities 1.00 0.91 0.77 0.63 0.29
Emerging Equities 1.00 0.65 0.63 0.25
Property 1.00 0.23 0.06
Cash 1.00 0.69
Bonds 1.00
9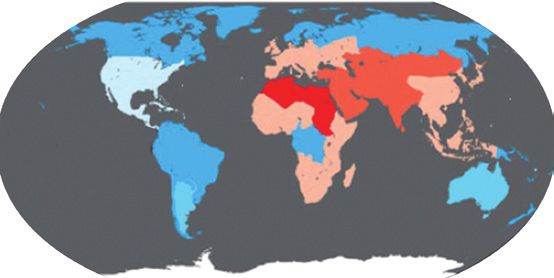
Macquarie Agricultural Funds Management Newsletter: Food for thought
Two optimal minimum variance, or “efficient” portfolio frontiers5, Limitations
were created using the portfolio returns, standard deviations
The proxy for agricultural land indices used in this analysis
and asset class covariances from the 2001 to 2011 data,
are not directly investable like an equity index. This makes it
with one frontier including agriculture while the other did not.
important to select managers that are able to provide effective
Zero leverage and zero short-sale constraints were added to
management of the controllable factors inherent in agriculture
the asset weightings in the efficient portfolio construction.
systems and that execute strategies of large scale farming
Given the correlation benefits and the relatively strong return operations across geographies, commodities and markets,
performance, the chart shows that adding an exposure to to capture the benefits of diversification.
internationally diversified agricultural land between 2001 and
As a retrospective analysis, the results here are reflective of
2011 could have significantly decreased risk without having
historical performance and therefore may not represent the
a detrimental effect on returns. At all points along the efficient
asset class in the future. Recognising that investors are likely
frontier the portfolio including agricultural land provided a
to limit their asset class allocation to agriculture (regardless
superior risk-return outcome. The exception was the point of
of its historical performance), we have calculated the same
maximum risk and maximum return on the efficiency frontier,
efficient frontiers with a 10 per cent limit for the agricultural land
which was 100 per cent exposed to emerging market equities
allocation. The result is shown in the chart below.
and the same for both portfolios. For all other timeframes, this
difference was greater due to the value of agricultural land from Even with the allocation to agricultural land capped at 10 per
a diversification and risk reduction perspective. cent it makes a meaningful contribution to the portfolio –
lowering portfolio risk by an average of 4.14 per cent at the
return levels above, compared with no portfolio allocation to
agricultural land.
Efficient Frontiers – 10 years with and without ag Efficient Frontiers – 10 years with and without ag (w/ ag limited to 10 per cent of portfolio)
14.00% 14.00%
Emerging Equities Emerging Equities
12.00% 12.00%
10.00% 10.00% Agricultural Land
Agricultural Land
Real Returns
Real Returns
8.00% 8.00%
6.00% 6.00%
Bonds Cash Bonds Cash
4.00% 4.00%
Developed Equities Developed Equities
2.00% 2.00%
0.00% 0.00%
%
%
0%
0%
0%
0%
0%
%
%
0%
0%
0%
0%
0%
00
00
00
00
.0
.0
.0
.0
.0
.0
.0
.0
.0
.0
0.
5.
0.
5.
10
15
20
25
30
10
15
20
25
30
Risk Risk
Efficient frontier with ag Efficient frontier w/o ag Efficient frontier with ag Efficient frontier w/o ag
Ag inclusive efficient frontier portfolio allocations
100%
Ag land
90%
Property
80% Emerging Markets
Cash
70%
Portfolio allocation
Bonds
60% Equity
50%
40%
30%
20%
10%
0%
5.00% 6.00% 7.00% 8.00% 9.00% 10.00% 11.00% 12.00% 13.00%
Annual portfolio returns (10 years)
5 Theminimum variance, or ‘efficient’, frontier is a graph of the portfolio risk/return outcomes for the optimal combination of asset class portfolio weightings that
produce the lowest portfolio standard deviation (risk) for a given level of return. This can be calculated using the ‘solver’ optimisation tool in Microsoft Excel once
the average historical returns, variances and covariances are known for each asset class.
10Macquarie Agricultural Funds Management Newsletter: Food for thought
Conclusion Appendix 1 – Asset data set
The analysis suggests that the low correlation of agricultural
land prices to traditional asset classes makes farmland
descriptions
an attractive proposition in a portfolio context. Historically, Financial Indices data (Bloomberg)
agricultural land returns have been driven by factors with low Global Developed Market Equities = FTSE All-World
or no correlation, such as decreasing arable land per capita, Developed Index (USD)
changing diets and growing populations in emerging markets6.
Emerging Market Equities = FTSE All-World Emerging
Farmland assets could have the ability to provide exposure to
Index (USD)
soft commodity price inflation, without the volatility that comes
from pure exposure to the commodities. The cash yield from Global Developed Market Property = FTSE EPRA/NAREIT
operating farmland has not been analysed here because of the Developed Real Estate Index
limitations of the data available. However, including the cash Bonds = CGBI WGI World All Maturities Index (USD)
yield component from owning and operating farm land could
provide further diversification benefits to an overall investment Cash = JPM Global Cash (USD)
portfolio and should be taken into account when considering CPI = All Urban, All Items (USD)
agricultural investments options. FX conversion rates
Agricultural Land data
United States
USDA Agricultural land statistics
Source: http://www.ers.usda.gov/data-products/
farm-income-and-wealth-statistics.aspx#27514
Australia
ABARES (Australian Bureau of Agricultural and Resource
Economics and Sciences) broad acre farm values –
all Australia
Source: Land value data sourced directly from ABARES with
thanks to the generous support of ABARES staff. General
information can be found at http://www.daff.gov.au/abares/
surveys and http://abares.win.hostaway.net.au/ame/agsurf/
agsurf.asp
Brazil
Informa Economics-FNP consultants – average of all
Brazilian farmland
Source: view http://www.informaecon-fnp.com/ for
further information
6 Macquarie Agricultural Funds Management research (2010).
11Macquarie Agricultural Funds Management Newsletter: Food for thought
Water scarcity:
an investment opportunity?
By Andrew Sliper Heavy and costly to transport, water is inherently a local resource.
Agricultural Product Specialist, Macquarie Agricultural When thinking about water security there are varying degrees
Funds Management of scarcity. The limited ’economic water supply‘ (water that
can be extracted through existing available capital resources)
“Many of the wars of the 20th century were about oil, has inhibited human health and economic growth in much of
but wars of the 21st century will be over water unless the developing world for some time. Several major population
we change the way we manage water.” centres of both rich and poor nations have reached a point of
physical scarcity which is forcing them into pursuing costly water
Ismail Serageldin, Former World Bank Director and
transfer alternatives. A further consequence for the food supply in
Chairman of the World Commission for Water in the
these parts of the world is that goods that were once produced
21st Century
domestically with local water supplies may now be imported.
According to the UN, over the next two decades global
demand for fresh water will vastly outstrip reliable supply in Who is consuming all the water?
many parts of the world. Forty per cent of the world is already
Food production is a very water intensive business. It is
suffering from some form of water scarcity, and urbanisation
estimated that approximately 70 per cent of the Earth’s
and economic growth will continue to increase the demand1.
freshwater is taken up by agriculture, 20 per cent by industry
The rivers Nile, Ganges and Yangtze all fade to a trickle for much and 10 per cent by households4.
of the year, the Aral Sea in the former Soviet Union has shrunk to
As the global population continues to increase and urbanise,
ten per cent of its size in the last half-century2, and entire natural
demand for food will increase with it. The Food and Agriculture
lakes, such as Lake Layla in Saudi Arabia, once the largest on
Organisation (FAO) estimates that the global requirements for
the Arabian Peninsula, have disappeared completely3.
food will increase by 70-100 per cent by 2050. While there
is more awareness of the changing balance between food
Aral Sea 1989 - 2008 supply and demand – growing population, urbanisation, dietary
changes, biofuel production, droughts and climate change –
there is much less recognition of the declining availability of water
that is needed to produce our food and fibre requirements.
While the direct requirement of water for drinking and sanitation
is easy to see and understand, humans also deplete water
reserves through the production of food and fibre. The
water embodied in such goods is known as ’virtual water’.
While we drink about two to three litres of water per day,
the average human in developed countries consumes more
that 3,000 litres of virtual water per day5. As urbanisation
continues, people’s dietary consumption also increases and
consequently, so does their demand for virtual water.
In the last four decades, the amount of fresh water
available for each human being worldwide shrank
by almost two-thirds. It is expected to be halved
again by 20256.
The table on the next page shows how an increase in
Source: NASA, 2012 demand for protein and nutrient-dense foods in diets
amplifies the pressure on water resources. It is clear that
even small increases in the demand for higher value foods
will put additional strain on water supplies. As the global
1 Charting our water future, McKinsey report (2009) trade of food and virtual water increases, water shortages, no
2 NASA, Landsat Top Ten - A Shrinking Sea, Aral Sea (2012) matter where they occur, will impact every person who buys
3
4
Municipality of Riyadh (2012) agricultural products.
Food and Agriculture Organisation (2012)
5 World Water Development Report, United Nations (2012)
6 David Pimentel et al, College of Agriculture and Life Sciences, Cornel University
12Macquarie Agricultural Funds Management Newsletter: Food for thought
Water required to produce common foods and products7 The lucky countries
Food or Product Water (in litres) Water (in gallons) The FAO estimates that 62 countries are viewed as having
Slice of bread 40 11 an abundance of water, with in excess of 10,000 cubic
Potato 25 7 metres per person, per annum. Water surplus regions have
geographical characteristics such as high rainfall resulting in
Tomato 13 3
good run off, aquifers, large bodies of freshwater sources
Cup of Coffee 140 37 (lakes, rivers, etc.), low evaporation rates (due to humidity or
Glass of milk 200 53 low flow rate of fresh air) and a low population relative to the
Egg 135 36 water available.
Glass of wine 120 32 As the demand for water increases, certain countries will be
Kilogram of grain 1500 396
required to ’export‘ water in the form of virtual water imbedded
in agricultural goods or even potentially as physical water in
Litre of palm oil 200 528
extreme cases. Given the FAO estimate that by 2050 the
Kilogram of chicken 6000 1585 number of countries with an ‘abundance of water’ will be
Kilogram of beef 15000 3962 reduced from 62 to 31, these surplus countries will be well
Hamburger 2400 634 placed to address the issues caused by water shortages and
the subsequent price inflation of goods that are linked to the
Cotton T-shirt 4000 1057
price of water.
Pair of leather shoes 8000 2113
Physical water scarcity Approaching physical Economic water scarcity Little or no water scarcity
(water resources development water scarcity (human, institutional, and financial Abundant water resources relative
is approaching or has exceeded More than 60% of river flows capital limit access to water even to use, with less than 25% of
sustainable limits). More than are withdrawn. These basins though water in nature is available water from rivers withdrawn for
75% of the river flows are will experience physical water locally to meet human demands). human purposes.
withdrawn for agriculture, scarcity in the near future. Water resources are abundant
industry and domestic purposes relative to water use, with less
(accounting for recycling of return than 25% of water from rivers
flows). This definition – relating withdrawn for human purposes,
water availability to water demand but malnutrition exists.
– implies that dry areas are not
necessarily water scarce.
Physical water scarcity
Approaching physical
water scarcity
Economic water scarcity
Little or no water scarcity
Not estimated
Source: Comprehensive Assessment of Water Management in Agriculture, 2007
7 The Coming Famine, Julian Cribb
13Macquarie Agricultural Funds Management Newsletter: Food for thought
The forecast – dry in Asia and Africa
1950 2000
Available water resources
Catastrophically low
2025
Very low
Low
Average
High
Very high
Source: The Big Picture, 2009
The opportunity to invest in water One of the fundamental limitations is the need to establish the
legal property rights for water. As a consequence, it has been
Investing in water infrastructure for domestic or industrial use or
mainly in developed countries with relatively strong regulatory
water utilities provides investors with exposure to water delivery
frameworks combined with a strong competition for water that
assets or services. Water saving technologies have been a
such investment opportunities have been developed. As water
darling of investors, however these have risks and returns
is principally regulated by state or provincial administrations, it
reflective of the technology more than the resource.
has been certain states in the US and Australia where these
For investors seeking to gain pure exposure to water as a conditions exist, that have been at the forefront of developing
commodity, or to take a position on potential water scarcity, water rights markets.
water asset markets are emerging in some countries, however
For example, the Australian water trading market (of which
they have been challenging to navigate.
60 per cent8 of total volume is in the Murray Darling basin
in the Southeast of the country) has reached a market
capitalisation of over $A25 billion with an annual turnover of
$A3 billion9.
8 National Water Commission, December 2010
9 National Water Commission, Australian Water Markets Report, 2009-10
14Macquarie Agricultural Funds Management Newsletter: Food for thought
Investing in water ’virtually’ the total renewable water available.10 Converting underutilised
water resource to arable farmland brings with it the risk of
A less direct but more traditional option for investors is to gain
environmental degradation and potential negative impacts
exposure to ’virtual water‘ through agricultural land. As the
on climate.
value of agricultural commodities is reflective of several factors
of production, including water, the value of land used to An increasing acceptance of the trade of virtual water is one
produce those products incorporates the value of the volume, part of what has to ultimately be a multilayered solution to
frequency and reliability of precipitation. solving the global water crisis. However, this involves removing
uneconomical farming and water systems and importing
A rise in the number of countries that are unable to service
food from the most efficient, competitive and sustainable
their internal food and fibre requirements via their domestic
producers. While the political sensitivity of sovereign food
production as a result of dwindling local water supplies, will
security means that this does not seem like an achievable
incentivise those surplus countries to export products – and
solution in the immediate term, it does create investment
virtual water – to deficit countries. As water resources become
opportunities for the public and private sector alike to attempt
further depleted, an abundance of natural rainfall will contribute
to bridge the gap.
to the faster appreciation in value of areas, compared to those
with less rain.
The future
While some regions such as Latin America only use a small
part of their available freshwater resource for food production,
in others such as the Middle East, North Africa and South
Asia, water withdrawals already account for a large share of
10 The Coming Famine, Julian Cribb
15Macquarie Agricultural Funds Management Newsletter: Food for thought
For more information, please visit macquarie.com/mafm, or contact:
Tim Hornibrook (Australia) Bradley Wheaton (US)
Co-Head Agricultural Product Specialist
Macquarie Agricultural Funds Management Macquarie Agricultural Funds Management
P: +61 2 8232 0579 P:+1 212 231 0305
F: +61 2 8232 9999 E: bradley.wheaton@macquarie.com
E: tim.hornibrook@macquarie.com Macquarie Group Limited
Macquarie Group Limited Level 10, 125 West 55th Street
No.1 Martin Place New York, NY 10019
Sydney NSW 2000 USA
Australia
Jonathan Webster (Australia)
Andrew Sliper (Asia) Agricultural Product Specialist
Agricultural Product Specialist Macquarie Agricultural Funds Management
Macquarie Agricultural Funds Management P: +61 3 9635 8218
P: +852 3922 1258 E: jonathan.webster@macquarie.com
E: andrew.sliper@macquarie.com Macquarie Group Limited
Macquarie Group Limited Level 26, 101 Collins Street
One IFC Business Centre Melbourne VIC 3000
Level 19, 1 Harbour View Street Australia
Central
Hong Kong
Daniel Hough (Europe)
Agricultural Product Specialist
Macquarie Agricultural Funds Managament
P: +44 20 3037 2853
E: daniel.hough@macquarie.com
Macquarie Group Limited
28 Ropemaker Street
London EC2Y 9HD
United Kingdom
16You can also read