Windermere Flood Investigation Report - Cumbria County Council
←
→
Page content transcription
If your browser does not render page correctly, please read the page content below
Windermere
             Flood Investigation Report

                                The Swan Hotel, Newby Bridge

                                             th
     Flood Event 5-6 December 2015
This Flood Investigation Report has been produced by the Environment Agency as a key Risk
Management Authority under Section 19 of the Flood and Water Management Act 2010 in partnership
with Cumbria County Council as Lead Local Flood Authority.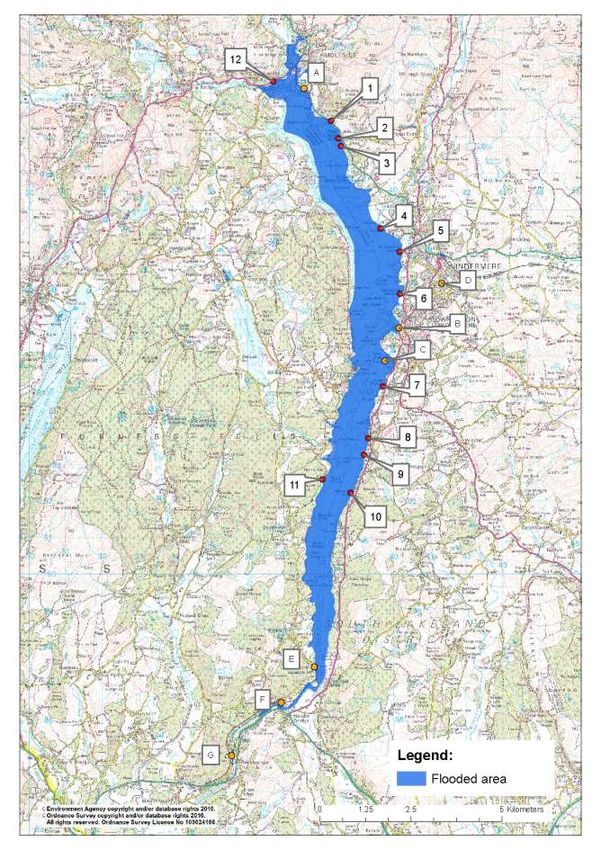
Version       Prepared by        Reviewed by         Approved by            Date

Version 2.0      Wojciech         David R Webb        Graham Fardell     15th June 2016
                 Bolisega
                                 C. Cowperthwaite,   C. Cowperthwaite,
Version 3.0   Chris Evans, EA                                            25th July 2016
                                       EA                  EA
              Jonathan Coates,   C. Cowperthwaite,
Version 4.0                                          Doug Coyle, CCC     January 2017
                    EA                 EA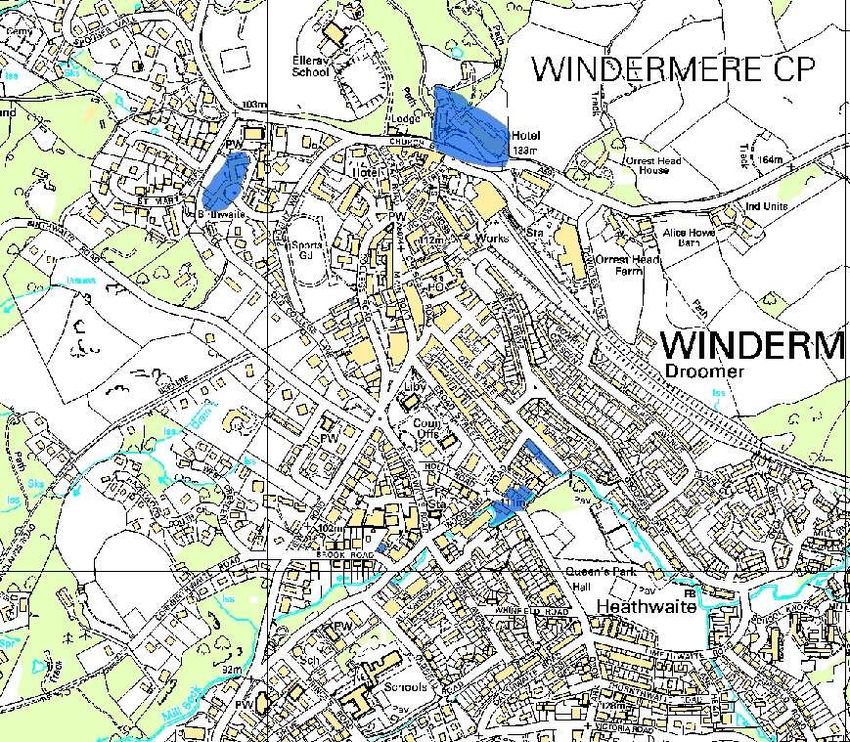
Contents
Executive Summary ............................................................................................................................................. 4
The Flood Investigation Report ........................................................................................................................... 6
Scope of this report .............................................................................................................................................. 6
Introduction.......................................................................................................................................................... 7
Geographical setting ............................................................................................................................................ 7
Flooding History ................................................................................................................................................... 8
Flood Event 5-6th December 2015 ....................................................................................................................... 9
Background ......................................................................................................................................................... 9
Rainfall Event ...................................................................................................................................................... 9
River and Lake Levels ....................................................................................................................................... 10
Investigation ...................................................................................................................................................... 13
Timeline............................................................................................................................................................. 15
Sub-area A: Ambleside’s waterfront ................................................................................................................... 15
Sub-area B: Bowness-on-Windermere – The Promenade and Glebe Road ........................................................ 17
Sub-area C: Bowness-on-Windermere – The Marina and Storrs......................................................................... 21
Sub-area D: Windermere Town .......................................................................................................................... 23
Sub-area E: Lakeside ........................................................................................................................................ 26
Sub-area F: Newby Bridge ................................................................................................................................. 28
Sub-area G: Backbarrow.................................................................................................................................... 32
Environment Agency Flood Incident Response ............................................................................................... 37
Recommended Actions ..................................................................................................................................... 38
Next Steps – Community & Catchment Action Plan ........................................................................................ 40
Appendices ........................................................................................................................................................ 42
Appendix 1: Acronyms and Glossary .................................................................................................................. 42
Appendix 2: Summary of Relevant Legislation and Flood Risk Management Authorities ..................................... 45
Appendix 3: Links to Other Information on Flooding ........................................................................................... 47
Appendix 4: Flood Warnings and Alerts.............................................................................................................. 48
Appendix 5: CH2M Hill UK Projects and Flood Risk Management brochure........................................................ 49
Executive Summary
As a result of Storm Desmond, there was a period of prolonged, intense, rainfall across Northern
England during the 5th and 6th of December 2015. The rainfall fell on already saturated catchments,
which led to high river and lake levels causing flooding throughout Cumbria.
On 6th of December 2015, water levels in the River Leven at Newby Bridge nearly reached the record
levels set during the November 2009 flood event, with flood levels in the area adjacent to Windermere
Lake being reported as only 100mm lower than in November 2009. The flooding in the area adjacent to
the River Leven was mostly fluvial.
An estimated 131 properties around the periphery of Windermere Lake were affected by flooding. In
addition, 45 properties in Windermere town were affected by flooding from Mill Beck and surface
water. Downstream of Windermere Lake on the River Leven, 4 properties in Newby Bridge and 29
properties in Backbarrow were affected by flooding.
In response to the flood event, this Flood Investigation Report has been completed by the Environment
Agency as a key Risk Management Authority (RMA) working in partnership with Cumbria County Council as
the Lead Local Flood Authority, under the duties as set out in Section 19 of the Flood and Water
Management Act 2010. This report provides details on the flooding that occurred in the Windermere area
on the 5th and 6th of December 2015, and has used a range of data collected from affected residents,
site visits, surveys of the area, and data collected by observers, along with river and rainfall telemetry
during the flood event.
This report examines the flooding that occurred, and details the flow routes and causes of flooding. The
key features of the flooding event are summarised below.
Bowness-on-Windermere: water overtopped the lakeshore, causing damage to properties
close to the Lake itself. Properties around Glebe Road, along The Promenade, Ferry Nab and at
the Windermere Marina Village were affected by flooding.
Newby Bridge: flooding initially occurred from water discharged from the storm drains. This was
then followed by flood water directly from the River Leven, flowing through gaps in the wall next
to the bridge, around the sides of the bridge parapet and over Newby Bridge, flooding adjacent
properties.
Backbarrow: local eyewitnesses reported that Backbarrow Bridge restricted the water flow and
raised the water level in the River Leven, causing more damage than experienced in previous
events. The water came over the parapet wall of the bridge and stone walls on the left and right
banks of the River Leven.
Windermere Town: the water level in Mill Beck rose quickly, exceeding the channel capacity of
the watercourse and flooding several properties and gardens. A number of properties around
the town were flooded as a result of surface water.
Lakeside: water overtopped the lakeshore causing damage to a number of residential and
commercial properties.
Transport links, including the A591, were affected by surface water and high Lake levels.
A large number of boats moored on the Lake and within marinas were affected.
A large number of boat houses were affected in various locations in and around Windermere
Lake.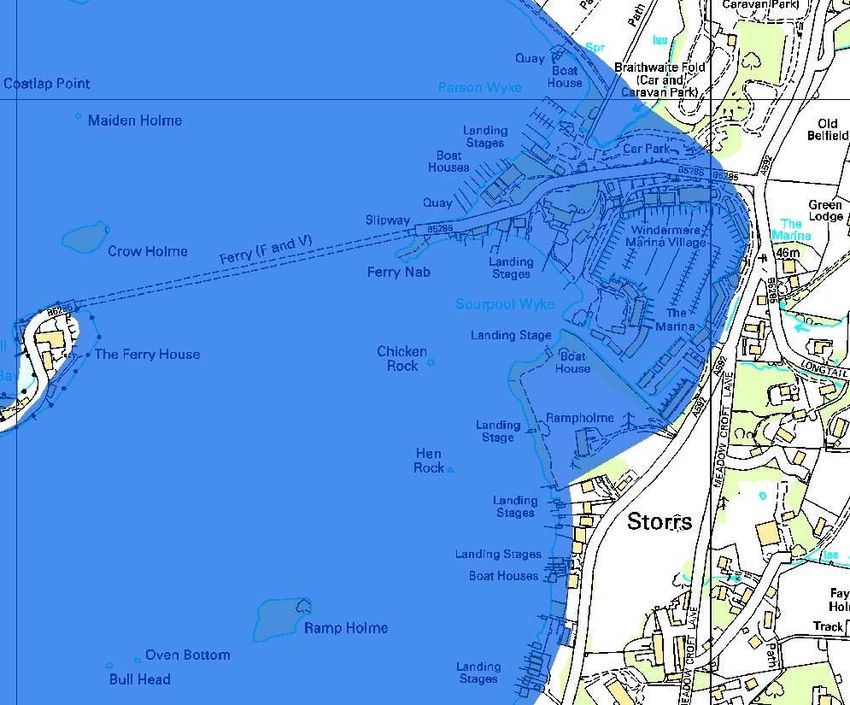
A total of 13 actions have been recommended in this report to manage future flood risk. These will
require the involvement of a number of organisations, and local communities, and will include an
examination of the potential for improvements to processes.

A draft version of the Windermere Flood Investigation Report was published online in July 2016 for
public consultation. Following the draft publication, a public meeting chaired by Cumbria County
Council was held in Windermere on the 26 th July, where the Environment Agency formally presented
the report to the local community. Other Risk Management Authorities were also present at the
meeting to answer any questions raised during a question and answer session following presentation of
the report. Through the public meeting and local consultation with the community, including with the
Windermere Lake Levels Group, a range of feedback has been provided on the report. The
Environment Agency and Cumbria County Council have reviewed this feedback and, where
appropriate, updated the final version of the report to reflect the required amendments. The authors of
the report are grateful for the information provided by the Windermere Lake Levels Group, and the
photos provided by Zan Fell, which have been used to inform the report.

In response to the flooding, a number of community meetings have taken place, and these will continue
in order to ensure that all those affected are given the opportunity to be involved in reducing the flood
risk in their area of the town.

Any additional information that residents and others can provide to the Environment Agency and
Cumbria County Council to help develop our understanding of the flooding is welcomed. A lot of
information has already been provided, much of which has been used to inform this report. The scale of
this report means that not every piece of information can be incorporated into the document. Any
additional information should be provided to:

http://www.cumbria.gov.uk/planning-environment/flooding/floodriskassessment.asp
The Flood Investigation Report
Under Section 19 of the Flood and Water Management Act (2010) Cumbria County Council, as Lead
Local Flood Authority (LLFA), has a statutory duty to produce Flood Investigation Reports for areas
affected by flooding. Section 19 of the Flood and Water Management Act states:
(1) On becoming aware of a flood in its area, a lead local flood authority must, to the extent that it
considers it necessary or appropriate, investigate:
(a) which risk management authorities have relevant flood risk management functions, and
(b) whether each of those risk management authorities has exercised, or is proposing to
exercise, those functions in response to the flood.
(2) Where an authority carries out an investigation under subsection (1) it must —
(a) publish the results of its investigation, and
(b) notify any relevant risk management authorities.
This section of the Act leaves the determination of the extent of flood investigation to the LLFA. It is not
practical or realistic for Cumbria County Council to carry out a detailed investigation into every flood
incident that occurs in the County, but every incident, together with basic details will be recorded by the
LLFA.
Only those with 5 or more properties/businesses involved will have investigations published.
An investigation will be carried out, and a report prepared and published by the LLFA when the flooding
impacts meet the following criteria:
where there is ambiguity surrounding the source or responsibility of flood incident,
internal flooding of one property that has been experienced on more than one occasion,
internal flooding of five properties has been experienced during one single flood incident and
there is a risk to life as a result of flooding.
As a flood Risk Management Authority (RMA), the Environment Agency have partnered with Cumbria
County Council (CCC) to produce the 53 flood investigation reports across Cumbria.
Scope of this report
This Flood Investigation Report is:
an investigation on the what, when, why, and how the flooding took place resulting from the 5 th-
6th December 2015 flooding event and
a means of identifying potential recommendations for actions to minimise the risk or impact of
future flooding.
This Flood Investigation Report does not:
interpret observations and measurements resulting from this flooding event. Interpretation will
be undertaken as part of the subsequent reports,
provide a complete description of what happens next.
The Flood Investigation Reports outline recommendations and actions that various organisations and
authorities can do to minimise flood risk in affected areas. Once agreed, the reports can be used by
communities and agencies as the basis for developing future plans to help make areas more resilient to
flooding in the future.
For further information on the S19 process, including a timetable of Flood Forum events and associated
documentation, please visit the County Council website at:
http://www.cumbria.gov.uk/floods2015/floodforums.asp
To provide feedback on the report please email LFRM@cumbria.gov.uk.
Introduction
Geographical setting
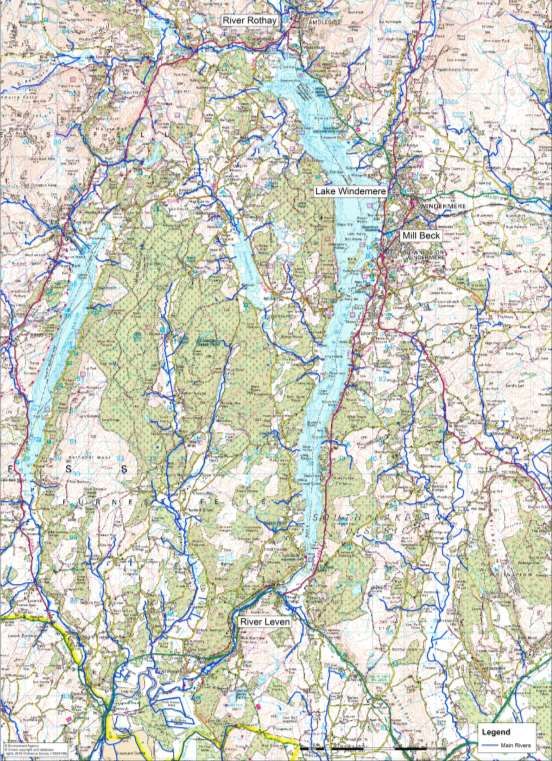
Windermere Lake is the largest natural lake in England, stretching 16.9 kilometres in length and
reaching a maximum depth of 66.7 metres at its deepest point. It is located within the Lake District
National Park, in the county of Cumbria, North West England. The Lake is drained by the River Leven
at its southern tip, which discharges into Morecambe Bay. Figure 1 provides an overview of the
Windermere area.
Windermere
Windermere Town
Windermere
Lake
Bowness-on-Windermere
Newby Bridge
Backbarrow
Figure 1: Overview of the Windermere area detailed in the report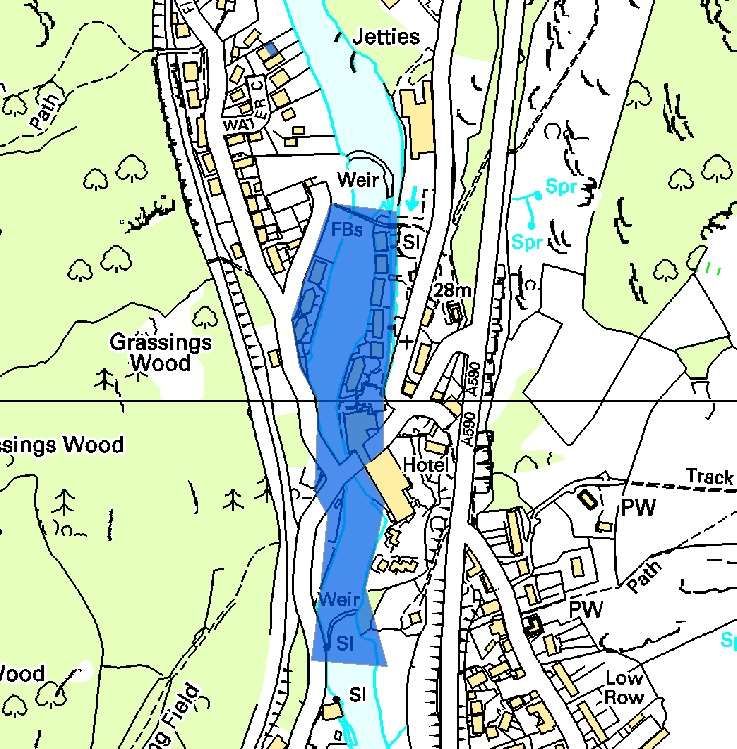
Flooding History
The area around Windermere Lake is at risk of flooding. Since the late 1990’s this area has been
subject to flooding on several occasions, notably in 1999, 2005, 2008 and 2009. The villages of Newby
Bridge and Backbarrow, situated on the River Leven downstream of Windermere Lake, were also
affected by flooding in November 2009, whilst Newby Bridge was also impacted in October 2008.

The November 2009 event was estimated to be an event with a rarity between 0.5-0.2% Annual
Exceedence Probability (AEP)1. The annual exceedence probability (AEP) describes the likelihood of a
specified flow rate (or volume of water with specified duration) being exceeded in a given year. There
are several ways to express AEP, two of which are shown in Table 1. Throughout this report AEP is
expressed as a percentage. As such, an event that has a 1 in 100 chance of occurring in any single
year will be described as a 1% AEP event.

                                                            AEP (as
                                     AEP (as percent)
                                                          probability)
                                     50%                 0.5
                                     20%                 0.2
                                     10%                 0.1
                                     4%                  0.04
                                     2%                  0.02
                                     1%                  0.01
                                     0.1%                0.001
                                   Table 1: Probabilities of Exceedance

1
    Estimate taken from CEH briefing note http://nora.nerc.ac.uk/s510223/1/Nov09Floods-CEH-briefing-note.pdf
th
Flood Event 5-6 December 2015
Background
On the 5th and 6th of December 2015, an estimated 131 properties around the periphery of Windermere
Lake were affected by flooding. The majority of this flooding was in Bowness-on-Windermere, and the
numerous residential and commercial properties located on the shoreline around Windermere Lake.
The very high levels experienced in and around Windermere Lake were caused by extensive and
prolonged rainfall over a 36 hour period. In addition, 45 properties in Windermere town were affected
by flooding from Mill Beck and surface water. Downstream of Windermere Lake on the River Leven, 4
properties in Newby Bridge and 29 properties in Backbarrow were affected by flooding. The flooding
in Newby Bridge and Backbarrow was primarily associated with the River Leven.

Rainfall Event
December 2015 was the wettest calendar month on record, with much of the northern UK receiving
double the average rainfall for December. This also followed a particularly wet November with much of
the soil within the Cumbria catchments already saturated. The record rainfall that fell in early December
could therefore not be absorbed, leading to higher levels of runoff and exceptionally high river flows
across the county.

From the 4th to 7th of December there was a period of prolonged and intense rainfall caused by Storm
Desmond. Over this period, new 24 hour and 48 hour rainfall records were set for the UK. Both of these
were within Cumbria and broke the previous records, also within Cumbria, set during the November
2009 floods, as illustrated in Table 2.

                            Storm Desmond                                  Previous Record
  Rainfall
  Period                                      Total rainfall                                 Total rainfall
                   Date         Location                         Date          Location
                                                 (mm)                                           (mm)

  24 hour       December                                       November
                              Honister Pass        341.4                      Seathwaite         316.4
  rainfall        2015                                           2009

  48 hour       December                                       November
                                Thirlmere          405.0                      Seathwaite         395.6
  rainfall        2015                                           2009
                                    Table 2: UK Rainfall Records

Table 3 shows the depth of rainfall falling in 24 hours at gauges within the Windermere catchment. The
location of the rain gauges can be seen in Figure 2. The rainfall recorded in the immediate catchment,
at Blackmoss, during the 2015 event is greater than the 24 hour period recorded in 2009. It is also
worth noting that 62.7mm of rainfall was recorded at Blackmoss on 4th December 2015.

The Grasmere Tannercroft rain gauge, which is situated within Grasmere village in the upstream River
Rothay catchment, recorded a total of 261.1mm of rainfall from 9am on the 4 th December to 9am on the
6th December. This exceeded the previous highest recorded 48 hour total of 240.7mm from the 18th
and 19th November 2009. As Grasmere Tannercroft is a ‘daily read’ rain gauge, 24 hour recordings are
taken for the 24 hour period from 9am to 9am. Table 3 illustrates that the 24 hour rainfall total recorded
at the Grasmere Tannercroft rain gauge was greater in November 2009, however given the above 48
hour event totals it is clear that the 48 hour total over the event duration was greater in December 2015.
24 hour Rainfall during 24 hour Rainfall during
                      Location             November 2009 Event      December 2015 Event
                                                     mm                       mm
                Grasmere Tannercroft*               155.5                    133.7
                    Blackmoss*                       72.8                     111
                    Tower Wood                       76.2              Data not available
                      Table 3: 24 hour rainfall within the Windermere catchment**
*Daily read rain gauge, with 24 hour recordings taken for the 24 hour period from 9am to 9am.
**Please note that rainfall data from the Brathay Hall and Mickleden rain gauges has been omitted from this report
due to uncertainties over the recorded data in the December 2015 event. Alternative gauges within the catchment
have therefore been used.

River and Lake Levels
Record river levels were recorded at the Miller Bridge House gauging station on the River Rothay and
Calgarth gauging station on Trout Beck, illustrated in Table 4. The peak river level recorded at Miller
Bridge House reached 3.714m, exceeding the previous record of 3.517m recorded during the
November 2009 flood event. The peak level recorded at Calgarth gauging station reached 2.234m,
exceeding the 2.085m record level previously set during the same 2009 event. However, river levels
recorded at Jeffy Knotts on the River Brathay and at Newby Bridge on the River Leven did not exceed
the previous records set in November 2009.

    Gauging Station                        Highest Recorded Gauging Dates & Levels
                                  January 2005         November 2009          December 2015
Miller Bridge House,
                                     3.432m                       3.517m                      3.714m*
River Rothay
Jeffy Knotts,
                                     3.656m                       4.500m*                      3.871m
River Brathay
Calgarth,
                                     1.986m                       2.085m                      2.234m*
Trout Beck
Newby Bridge,
                                     1.884m                       2.541m*                      2.480m
River Leven
*Record level
                      Table 4: Windermere catchment, record gauged river levels

    Gauging Station                        Highest Recorded Gauging Dates & Levels
                                  January 2005         November 2009          December 2015
Far Sawrey,
                                     1.853m                       2.904m*                      2.820m
Windermere Lake
*Record level
                  Table 5: Windermere Lake levels taken from the gauge at Far Sawrey

Table 5 shows lake levels for Windermere Lake recorded at the Far Sawrey gauging station. The
maximum level recorded during the December 2015 flood event was 84mm lower than the record lake
level, reached during the flooding of November 2009. This can be correlated with the flows draining the
lake recorded at Newby Bridge gauging station on the River Leven, recording a peak level 61mm lower
in 2015 than in 2009.

The location of river level and lake level gauges can be seen along with the catchment rain gauges in
Figure 2.
Grasmere
Tannercroft
Miller Bridge
House
Jeffy
Knotts
Calgarth
Blackmoss
Far
Sawrey
Tower
Wood
Newby
Bridge
Figure 2: Location of Rainfall, River Level and Lake Level Gauging StationsFigure 3 shows changes in the river levels at the gauging stations around Windermere Lake during the
December flood event.
Figure 3: River levels recorded at the gauging stationsInvestigation
This investigation was carried out by the Environment Agency through surveys of the area and data
collected from the local communities. The Windermere Lake Levels Group (consisting of local residents
and businesses) also provided a great deal of information on the flooding. This report has been
complied by CH2M Hill, specialist flood risk consultants, from the data collected by the Environment
Agency.
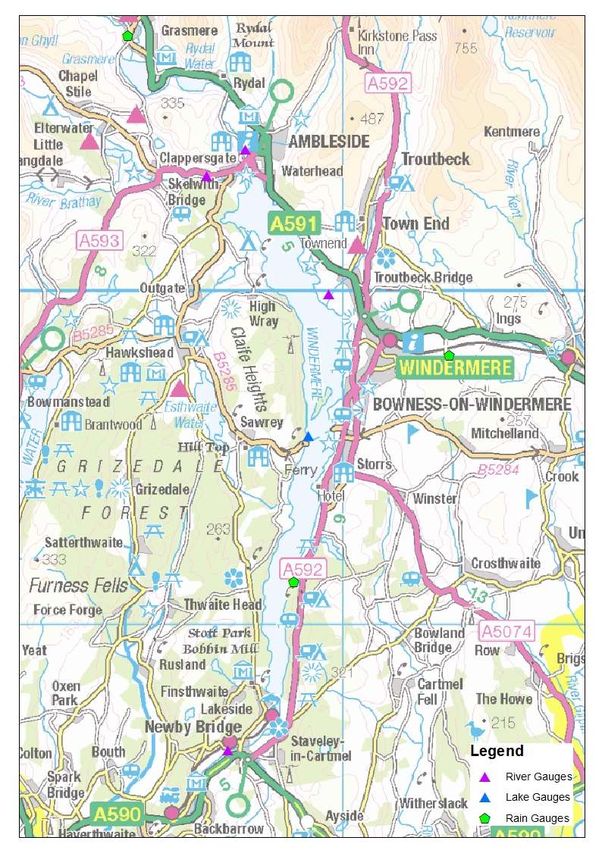
Figure 4 shows the 2015 flood extent for the Windermere area. The flood outline identifies the
maximum extent of flooding. Not all properties within the flood outline were flooded.
Flooding was reported at 19 locations within the Windermere catchment, as summarised below and in
Figure 4. For the purposes of this report, locations where multiple properties were flooded have been
divided into sub-areas. Seven sub-areas have been identified and referenced A-G, detailed in Table 6.
These sub-areas are examined in detail in the following sections of this report.
Sub-area Sub-area name Map reference
A Ambleside’s waterfront Figure 5
B Bowness-on-Windermere: The Promenade and Glebe Figure 6
Road
C The Marina and Storrs Figure 7
D Windermere Town Figure 8
E Lakeside Figure 11
F Newby Bridge Figure 12
G Backbarrow Figure 14
Table 6: Identified sub-areas for investigation
The additional 12 locations refer to reports of smaller scale flooding. These are referenced 1-12,
detailed in Table 7, and are located as shown in Figure 4.
Location Description
1 Flooding on to the A591 road. Occasional debris on the road and wrack marks were visible
2 Boathouses affected by flooding
3 Boathouses affected by flooding
4 Some properties and boathouses affected by flooding. Debris marking the maximum
flooding extent evident on the A591.
5 Properties and boathouses affected by flooding
6 Windermere Steamboat Museum affected by flooding
7 Boathouses affected by flooding
8 Boathouses affected by flooding
9 Boathouses affected by flooding
10 Boathouses affected by flooding
11 Flooding on to the road
12 Properties in Clappersgate affected by flooding
Table 7: Additional areas of floodingAmbleside’s waterfront
Windermere Town
Bowness-on-Windermere
The Marina and Storrs
Lakeside
Newby Bridge
Backbarrow
Figure 4: Flood Outline for the Windermere area and River LevenTimeline
Table 8 below shows the times of key events during the flood incident.
5th December Event
16:45 River Rothay peak at Miller Bridge House – 3.714m
18:15 Trout Beck peak at Calgarth – 2.234m
18:45 River Brathay peak at Jeffy Knotts – 3.871m
th
6 December Event
08:30 River Leven peak at Newby Bridge - 2.480m
Table 8: Windermere 5th – 6th December flood incident timeline
Sub-area A: Ambleside’s waterfront
Location shown as Point A on Figure 4.
Ambleside’s Waterfront was flooded directly from Windermere Lake as a result of high water levels in
the Lake. In addition to flooding from the Lake, employees from the Youth Hostel reported that their
basement was flooded, which they felt was due to high groundwater levels. Overland surface water
flows from the hillside east of Waterhead Cottages and the A591 was also reported, with resulting
surface water flow observed along the A591. As well as surface runoff from the hillside, overland flow
from an ordinary watercourse which is culverted (piped) through fields to the east of the A591 may well
have been a contributory factor in this area. Waterhead Cottages were reportedly affected by flooding
to their basements. Figure 5 shows the flood extent and flow routes.
Several commercial properties and boat houses were affected in this area, as illustrated in Photograph
1. The locally recorded water level was about 10mm lower than in November 2009, shown in
Photograph 2.Legend
Flow route
Flooded area
Figure 5: Flood flow routes - Ambleside’s waterfront
Photograph 1: Debris near the Wateredge Inn shortly after floodingNovember 2009 level
December 2015 level
Photograph 2: Water level in 2015 in comparison with the flooding in November 2009
Sub-area B: Bowness-on-Windermere – The Promenade
and Glebe Road
Location shown as Point B on Figure 4.
Bowness-on-Windermere is a small town of approximately 2500 inhabitants, located on the eastern
shore of Windermere Lake. The area flooded is comprised of mostly commercial properties, but there
were also a few residential properties affected. The area was flooded directly from the Lake as a result
of the rising water level due to the prolonged, intense rainfall. When the water level in the Lake rose,
the area close to the lakeshore was inundated. Observed water levels in the flooded properties were
lower than in the November 2009 event.Legend
Flow route
Flooded area
Figure 6: Flood flow routes – The Promenade and Glebe Road
Photograph 3, Photograph 4, and Photograph 5 show flooding in the Glebe Road area on Sunday 6th
December 2015.
Photograph 3: Glebe Road – picture by Allan Winrow (The Westmorland Gazette)Photograph 4: Windermere Lake Cruises – picture by Gordon Shoosmith (Alamy Live News)
Photograph 5: The Promenade and Glebe Road on 6th December 2015 – picture by Gordon
Shoosmith (Alamy Live News)Photograph 6: Debris line on Photograph 7: Debris line on
the area adjacent to Glebe the grass area at junction of
Road Glebe Road and The
PromenadeSub-area C: Bowness-on-Windermere – The Marina and
Storrs
Location shown as Point C on Figure 4.
The flooding mechanism for this area was very similar to The Promenade and Glebe Road area, with
flooding directly from the Lake as a result of increased water levels. The water level in the Lake rose
and flooded the surrounding area, which is lower than the majority of the town by necessity for the
boathouses and marina situated on the lakeshore.
Legend
Flow route
Flooded area
Figure 7: Flood flow routes - The Marina and Storrs
It was recorded that 22 commercial properties and 75 residential properties located in this area were
affected by flooding, including:
21 residential properties around Storrs Park
38 residential properties on Windward Way
14 properties in the Windermere Marina Village
2 residential properties around Ferry Nab
A further 10 residential properties, located a short distance to the south of this investigation area, were
also flooded. Reportedly, water levels in these properties were 100 mm lower than recorded in
November 2009.Photograph 8: Flood level on one of the buildings in The Marina
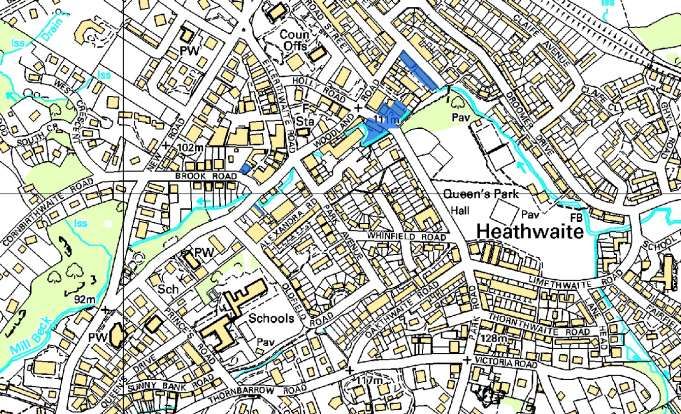
Sub-area D: Windermere Town
Location shown as Point D on Figure 4.

Windermere is a small town of about 5000 inhabitants, located approximately 1.5 kilometres east of
Windermere Lake to the north-east of Bowness-on-Windermere. The town was not affected by flooding
associated with rising lake levels as it is significantly higher in elevation. Properties in Windermere
town were affected by flooding from Mill Beck and from surface water. The intensity of the rainfall on
the 5th and the 6th of December 2015 resulted in the capacity of Mill Beck and the local drainage
systems being exceeded, resulting in flooding to a number of locations, as illustrated in Figures 8, 9
and 10. Approximately 45 properties in Windermere town were reported to have been affected by
flooding.

                          Area D1

                          Area D2

                   Figure 8: Locations affected by flooding in Windermere town
Legend
Flow route
Flooded area
Figure 9: Locations affected by flooding in Windermere town, Area D1
Legend
Flow route
Flooded area
Figure 10: Locations affected by flooding in Windermere town, Area D2In the north of Windermere town on Patterdale Road, residents of Fernrigg reported that their garden
was flooded as a result of water flowing from Wynlass Beck. Wynlass Beck is an ordinary watercourse
that flows to the east of Patterdale Road in this locality. During the flood event, a fence which crosses
Wynlass Beck upstream of Patterdale Road at the Stepping Stones caused a blockage, resulting in
water flowing out of bank in a westerly direction across Patterdale Road towards Fernrigg. The
residents reported that following the flood event, the landowner was going to replace the fencing across
the watercourse with swing gates to reduce the risk of future blockages and resulting flooding.
To the north of the A591 on Church Street, the Windermere Hotel and a group of adjacent properties
were affected by flooding from overland surface water flows from the fellsides to the north.
Photograph 9 shows a hallway on the ground floor in Birthwaite Flats sheltered housing on 5 th
December, where eight flats were reportedly flooded by surface water. Local residents reported that
the surface water flow route from the fellsides to the north of the Windermere Hotel continued in a
westerly direction along the A591 Church Street before flowing south along Phoenix Way towards
Birthwaite Flats.
Properties situated along Mill Beck were affected by flooding as water levels in the beck rose, and in
places exceeded the channel capacity of the watercourse. On Upper Oak Street, the cellars of a
terrace of properties were flooded as water entered the cellars through the floors. Just downstream
from Upper Oak Street, properties situated upstream and downstream of Park Road were affected by
flooding from Mill Beck. Properties on the upstream side of Park Road adjacent to Mill Beck flooded
initially from the rear as the watercourse flowed out of bank. Residents of the properties downstream of
Park Road reportedly erected a makeshift barrier on the gated entrance to Queen’s Park, located on
the upstream side of Park Road, to protect their properties from flooding. The barrier reportedly had the
effect of increasing water levels upstream of Park Road, where properties were being impacted by
flooding from Mill Beck. Residents from the properties upstream of Park Road therefore removed the
barrier to reduce water levels in their area. Three properties on the downstream side of Park Road
were also affected by flooding from Mill Beck as water levels continued to rise in the area. Further
downstream on Mill Beck, Rock Lea Guest House was impacted as a result of water entering the
property through the cellar.
Photograph 9: Hallway on the ground floor of Birthwaite FlatsSub-area E: Lakeside
Location shown as Point E on Figure 4.
Lakeside is a small village located on the south-west shore of Windermere Lake, approximately 1.5
kilometres north of Newby Bridge.
Legend
Flow route
Flooded area
Figure 11: Flood flow routes - Lakeside
Figure 11 shows flood flow routes in Lakeside, with flow from water ingress sourced from the Lake
itself. Flooded properties were mostly commercial and included the Lakeside Hotel, Windermere Lake
Cruises, the Lakeside and Haverthwaite Railway and Lakes Aquarium. There are no flood defences
along the lakeshore.
Flooding also impacted properties and boathouses, including South Windermere Sailing Club and Fell
Foot Park, located on the south-eastern shore of the Lake.
Photograph 10 shows the Lakeside Hotel and Photograph 11 shows the Lakes Aquarium and its car
park. Both of these properties were flooded due to the high water level in Windermere Lake.Photograph 10: Lakeside Hotel (Photo courtesy of Zan Fell) Photograph 11: Lakes Aquarium (Photo courtesy of Zan Fell)
Sub-area F: Newby Bridge
Location shown as Point F on Figure 4.

Newby Bridge is a small village to the south of Windermere Lake, located next to the River Leven. Due
to the prolonged, intense rainfall on the 5 th and 6th of December, water levels increased in the Lake.
This led to increased water levels in the River Leven, the outlet from Windermere Lake, which then led
to flooding at Newby Bridge. Although the floodwater levels were lower than in 2009, significant
damage was sustained in the area, with four properties reportedly affected by flooding.

                                            Newby Bridge Weir
                            Newby Bridge
                            Sluice Gates

                    Newby
                    Bridge river
                    level gauge

   Legend
            Flow route

            Flooded area

                              Figure 12: Flood flow routes - Newby Bridge

Figure 12 shows the flood flow routes in Newby Bridge.

It was observed by local residents that as the water level in the River Leven rose, water swept round
the side of the bridge parapet and onto the road. Photograph 12 shows the water level in the bridge
section. At the same time, water came through a gap between the bridge wall and a property boundary
wall, located on the left bank of the River Leven, causing flooding to the road and to properties on the
left bank.

Flooded properties are shown in Photograph 14 and Photograph 15. The Swan Hotel, shown in
Photograph 16, was flooded to ankle depth on the ground floor. Local residents reported that water
came up through the drains before floodwater inundated properties from the river.

Newby Bridge Weir was built across the River Leven to manage the water levels in Windermere Lake,
and includes the operation of Newby Bridge Sluice Gates. Figure 13 shows the location of Newby
Bridge Weir and Sluice Gates.
Photograph 12: Newby Bridge, looking upstream from the right bank
(Photo courtesy of Zan Fell)
Photograph 13: Looking downstream at Newby Bridge Weir from Newby Bridge
(Photo courtesy of Zan Fell)Photograph 14 and Photograph 15: Flooded properties in Newby Bridge
Photograph 16: The Swan Hotel, Newby BridgeFigure 13: Newby Bridge Weir and Sluice Gates - General Location Plan Newby Bridge Weir and Sluice Gates The 1966 Windermere & Ullswater Water Order allowed Manchester Water Corporation (MWC) to impound and abstract water from Windermere Lake. This was followed by the MWC increasing the height of the weir by 150mm in 1972, and the subsequent construction of the sluice gates in the mid 1970’s to better control lake levels. The sluice gates are owned and operated by the Environment Agency. The amount of water entering the Lake, and the volume of water stored in the Lake, means that the sluice gates have a limited amount of control on Lake levels during periods of prolonged very wet weather. After the flood event in November 2009, the Environment Agency, working in partnership with the Windermere Lake Levels Group, reviewed different options for operating the Newby Bridge sluices. As a result, the Environment Agency’s operational procedures were amended, which has led to the sluice gates being opened sooner during periods of very wet weather, enabling better management of Lake levels. The Environment Agency and the Windermere Lake Levels Group continue to work together to address flood risk issues in Windermere, Newby Bridge and Backbarrow, and are presently carrying out a further modelling review of Windermere Lake levels. This modelling review will inform any future investment plans to manage flood risk from Windermere Lake, and on the River Leven downstream at Newby Bridge and Backbarrow.
Sub-area G: Backbarrow
Location shown as Point G on Figure 4.

The village of Backbarrow straddles the River Leven, and is located downstream of Newby Bridge.
Approximately 29 properties in the village were affected by flooding due to the River Leven exceeding
its channel capacity through the village.

During the 2009 flood event the parapet walls on Backbarrow Bridge were seriously damaged and
washed away by water overtopping the bridge. The bridge parapet walls were subsequently repaired by
Cumbria County Council.

Backbarrow Bridge is a typical traditional stone built Lakeland bridge, and is shown in Photograph 17.
The bridge was built many years ago, and with that comes many challenges in how best to maintain
and adapt the structure to meet the modern day needs of vehicle access, public safety and flood risk.
The capacity of Backbarrow Bridge to convey significant flood flows is widely recognised as being one
of the main flood risk problems affecting the Lakeland Village, the Whitewater Hotel and residential
properties located close to the bridge. Flood flow routes are shown in Figure 14. The bridge is a
restriction to large flood flows, and in combination with the bridge parapet walls, prevents flood water
from overtopping the bridge leading to higher flood levels affecting adjacent properties. The December
2015 flood event replicated the November 2009 flooding, with the bridge causing flood water to back
up, submerging the bridge and overtopping river walls causing flooding to properties, illustrated in
Photographs 18, 19 and 20. The bridge parapet walls remained in place during the December flood,
which was said by the local community to have made the flooding worse. A stone wall to the south east
of Backbarrow Bridge failed over about five metres, leading to the loss of foundations to the electricity
transformer immediately downstream. This resulted in the loss of power locally until the foundations
had been repaired.

The Environment Agency, working in partnership with the Windermere Lake Levels Group (WLLG),
have already identified the need to update the Windermere flood risk model to include Backbarrow
Bridge. The modelling work will be used by both the Environment Agency and Cumbria County Council
(CCC) to investigate what work could be potentially carried out to help reduce flood risk for properties
around Windermere Lake, Newby Bridge and Backbarrow. This will include looking at possible options
to improve flood flow conveyance at Backbarrow Bridge. The modelling information will also be used
by the WLLG to inform what flood risk works they can do to make their properties more flood resilient.
Legend
         Flow route

         Flooded area

                        Figure 14: Flood flow routes - Backbarrow
Photograph 17: Backbarrow Bridge
Photograph 18: Backbarrow Bridge – Water overtopping the bridge parapets
(Photo courtesy of Zan Fell)The Whitewater Hotel, shown in Photographs 18 and 20, as well as a number of timeshare properties
at The Lakeland Village, one of which is shown in Photograph 21, were flooded on the left bank of the
River Leven. The recorded water levels in these properties ranged from between approximately 120mm
to 1000mm.
On the right bank of the River Leven at Backbarrow Bridge, Bridge House and Bridge Cottage were
affected by flooding, shown in Photograph 19.
Photograph 19: Backbarrow – Water affecting Bridge House and Bridge Cottage
(Photo courtesy of Zan Fell)Photograph 20: Backbarrow – Whitewater Hotel
(Photo courtesy of Zan Fell)
Photograph 21: Backbarrow – Lakeland Village timeshare estate with water markEnvironment Agency Flood Incident Response The Environment Agency, Cumbria County Council and South Lakeland District Council are members of the Cumbria Local Resilience Forum. The Cumbria Local Resilience Forum (LRF) is a partnership, made up of all the organisations needed to prepare for and respond to any major emergency in the LRF area. All services and organisations worked together prior to and during the flooding to ensure that the best possible preparations and plans were in place. The Environment Agency issued a Flood Alert for the Rivers Brathay, Rothay and Winster catchments on Friday 4th December at 15:22. A Flood Alert provides advance notice of possible flooding to low lying land and roads, and also acts as an early notification that river and lake levels are expected to rise and that the Environment Agency are monitoring the situation closely. During the December 2015 flood incident the Environment Agency updated the Flood Alert daily with relevant information. The details of the Flood Alert can be found in Appendix 4. Newby Bridge sluices had already been operated between the 9 th and 24th November 2015, and were open again from 30th November 2015 until 8th January 2016. The debris screens in Windermere were routinely cleared in the weeks leading up to the flood event and cleared immediately prior to the flood event. The Environment Agency also inspected watercourses to ensure that there were no blockages which may have caused an increase in flood risk. Throughout the duration of the flood event, Environment Agency staff continued to clear debris screens in and around Windermere. Immediately after the flood event, the Environment Agency undertook inspections of the watercourses in Windermere and worked to clear any blockages to aid conveyance.
Recommended Actions
The following table details recommended actions for various organisations and members of the public
to consider using the Cumbria Floods Partnership’s 5 Themes: Resilience, Upstream Management,
Strengthening Defences, Maintenance, and Water Level Management Boards (WLMB’s). Some of
these recommendations may have already been carried out or are ongoing.

 Cumbria Flood               Action by                           Recommended Action                        Timescale
  Partnership
    Theme

                      Cumbria Local                Review and update plans to enable homes &                  2016
                      Resilience Forum *           business to be better prepared for flooding &
                                                   reduce the impacts of flooding. For example,
                                                   review of evacuation procedures/emergency
                                                   response.

                      Lake District National       Review Local Development Plans and Strategic            2016 - 2017
                      Park Authority, Cumbria      Flood Risk Assessment to reflect current
                      County Council and           understanding of flooding.
                      Environment Agency
                      Environment Agency           Ensure all properties at risk are registered to           2016 -
                      and Residents                receive flood warnings and that all details are up-      Ongoing
Resilience

                                                   to-date.

                      Residents & South            Implement flood resilience measures within              Closing date
                      Lakeland District            flooded properties to reduce the impacts of future        for grant
                      Council                      flooding. South Lakeland District Council is           applications is
                                                   administering the Flood Recovery and Resilience        end of March
                                                   Grants of up to £5000 per property to help people           2017
                                                   better protect their homes. A further £2,000 top
                                                   up grant can also be applied for from the Cumbria
                                                   Flood Recovery Fund.

                      Cumbria County                                                                       2016 - 2017
                      Council, United Utilities,   Review the resilience of critical transport, utility
                      Environment Agency           and power supply infrastructure in relation to
                      and Electricity North        flood risk.
                      West
                      Cumbria Floods               The CFP Action Plan will consider natural flood         Action Plan
                      Partnership (CFP)            management options to reduce flood risk across           published
                                                   the catchment. This may also include land use          Summer 2016
                                                   changes and/or flood storage.
Upstream Management

                      Cumbria Strategic            Explore opportunities for natural flood                Medium term
                      Floods Partnership           management solutions to be used upstream of            (over next 5
                      (CSFP), Farmers,             Windermere in order to ‘slow the flow’ and                years)
                      Landowners,                  manage peak river levels.
                      Community Groups,
                      Trusts.
Environment Agency, Carry out inspections and repairs to assets which 2016 – 2017
United Utilities and may have been damaged during the flood event. (EA
Cumbria County Carry out improvements to replace the debris inspections
Council screen on Mill Beck, Upper Oak Street, completed)
Windermere.
Environment Agency Review the gravel and channel maintenance 2016 - 2017
programme within the catchment in response to
Maintenance
the flooding event of 2015.
Environment Agency 2017
A new Environment Agency system is being
developed to make it easier for communities to
understand what maintenance work is being
carried out in their area. Improvements will show
exactly when, where and what maintenance is
being planned each year. Make sure that
communities understand how they can access
information on planned maintenance at:
https://www.gov.uk/government/publications/river-
andcoastal-maintenance-programme
Environment Agency in Undertake an appraisal to investigate a range of 2016 - 2017
partnership with options to manage flood risk in Windermere,
Cumbria County Newby Bridge and Backbarrow. The appraisal
Council and South will include investigations on Mill Beck in
Lakeland District Windermere to understand if improvements are
Council required to manage flood risk. Reviewing a
range of options to manage flood risk from
Windermere Lake and on the River Leven at
Newby Bridge and Backbarrow will also be
undertaken. This will include reviewing the
operation of Newby Bridge sluices alongside
investigating the potential to improve flood flow
conveyance at Newby Bridge and Backbarrow
Strengthening Defences
Bridge.
The appraisal will develop technically feasible,
economically viable and environmentally
sustainable options to manage flood risk.
Cumbria County Review the performance of the existing drainage 2016 - 2017
Council, South and sewerage systems during the event to better
Lakeland District understand where improvements are required.
Council and United
Utilities
Environment Agency Review modelling data to ensure that hydraulic 2016 - 2017
models for Windermere Lake and the River
Leven catchments reflect real conditions as
accurately as possible and replicate the 5th-6th
December 2015 flood event to ensure the
flooding mechanisms identified are reflected in
the modelling output. Update the models where
required and use this information to make any
improvements to the flood forecasting and
warning service.
*The Cumbria Local Resilience Forum includes emergency services, local authorities, Cumbria County Council,
Environment Agency, Maritime Coastguard Agency and health agencies along with voluntary and private
agencies. Under the Civil Contingencies Act (2004) every part of the United Kingdom is required to establish a
resilience forum.Next Steps – Community & Catchment Action Plan
Cumbria County Council

Appendices
Appendix 1: Acronyms and Glossary

Acronym       Definition

EA            Environment Agency
CCC           Cumbria County Council
SLDC          South Lakeland District Council
LLFA          Lead Local Flood Authority
FLAG          Flood Action Group
LFRMT         Local Flood Risk Management Team
FWMA          Flood and Water Management Act 2010
LDA           Land Drainage Act 1991
WRA           Water Resources Act 1991
UU            United Utilities

Term                        Definition

Aquifer                     A source of groundwater comprising water-bearing rock, sand or gravel
                            capable of yielding significant quantities of water.
Attenuation                 In the context of this report - the storing of water to reduce peak discharge
                            of water.
Catchment Flood             A high-level planning strategy through which the EA works with their key
Management Plan             decision makers within a river catchment to identify and agree policies to
                            secure the long-term sustainable management of flood risk.
Culvert                     A channel or pipe that carries water below the level of the ground.

De Facto Flood Defence      A feature or structure that may provide an informal flood defence benefit
                            but is not otherwise designed or maintained by the Environment Agency
Flood Defence               Infrastructure used to protect an area against floods as floodwalls and
                            embankments; they are designed to a specific standard of protection
                            (design standard).
Floodplain                  Area adjacent to river, coast or estuary that is naturally susceptible to
                            flooding.
Flood Resilience            Measures that minimise water ingress and promotes fast drying and easy
                            cleaning, to prevent any permanent damage.
Flood Risk                  The level of flood risk is the product of the frequency or likelihood of the
                            flood events and their consequences (such as loss, damage, harm, distress
                            and disruption)

42                                          Flood Investigation Report: Windermere (5th-6th December 2015)
Cumbria County Council
Term Definition
Transposition of the EU Floods Directive into UK law. The EU Floods
Directive is a piece of European Community (EC) legislation to specifically
Flood Risk Regulations address flood risk by prescribing a common framework for its measurement
and management.
Flood and Water Part of the UK Government's response to Sir Michael Pitt's Report on the
Management Act Summer 2007 floods, the aim of which is to clarify the legislative framework
for managing surface water flood risk in England.
Flood Storage A temporary area that stores excess runoff or river flow often ponds or
reservoirs.
Flood Zone Flood Zones are defined in the NPPF Technical Guidance based on the
probability of river and sea flooding, ignoring the presence of existing
defences.
Flood Zone 1 Low probability of fluvial flooding. Probability of fluvial flooding is < 0.1%
Flood Zone 2 Medium probability of fluvial flooding. Probability of fluvial flooding is 0.1 –
1%. Probability of tidal flooding is 0.1 – 0.5 %
Flood Zone 3a High probability of fluvial flooding. Probability of fluvial flooding is 1% (1 in
100 years) or greater. Probability of tidal flooding is 0.5%(1 in 200 years)
Flood Zone 3b Functional floodplain. High probability of fluvial flooding. Probability of
fluvial flooding is >5%
Fluvial Relating to the actions, processes and behaviour of a water course (river or
stream)
Fluvial flooding Flooding by a river or a watercourse.
Freeboard Height of flood defence crest level (or building level) above designed water
level
Functional Floodplain Land where water has to flow or be stored in times of flood.
Groundwater Water that is in the ground, this is usually referring to water in the saturated
zone below the water table.
Inundation Flooding.
Lead Local Flood Authority As defined by the FWMA, in relation to an area in England, this means the
unitary authority or where there is no unitary authority, the county council
for the area, in this case Cumbria County Council.
Main River Watercourse defined on a ‘Main River Map’ designated by DEFRA. The EA
has permissive powers to carry out flood defence works, maintenance and
operational activities for Main Rivers only.
Mitigation measure An element of development design which may be used to manage flood
risk or avoid an increase in flood risk elsewhere.
Overland Flow Flooding caused when intense rainfall exceeds the capacity of the drainage
systems or when, during prolonged periods of wet weather, the soil is so
saturated such that it cannot accept any more water.
Residual Flood Risk The remaining flood risk after risk reduction measures have been taken into
account.
43 Flood Investigation Report: Windermere (5th-6th December 2015)Cumbria County Council
Term Definition
Return Period The average time period between rainfall or flood events with the same
intensity and effect.
River Catchment The areas drained by a river.
Sewer flooding Flooding caused by a blockage or overflowing in a sewer or urban drainage
system.
Sustainability To preserve /maintain a state or process for future generations
Sustainable drainage Methods of management practices and control structures that are designed
system to drain surface water in a more sustainable manner than some
conventional techniques.
Sustainable development Development that meets the needs of the present without compromising
the ability of future generations meeting their own needs.
Sustainable Flood Risk Sustainable Flood Risk Management promotes a catchment wide approach
Management to flooding that uses natural processes and systems (such as floodplains
and wetlands) to slow down and store water.
Topographic survey A survey of ground levels.
Tributary A body of water, flowing into a larger body of water, such as a smaller
stream joining a larger stream.
Watercourse All rivers, streams, drainage ditches (i.e. ditches with outfalls and capacity
to convey flow), drains, cuts, culverts and dykes that carry water.
Wrack Marks An accumulation of debris usually marking the high water line.
1 in 100 year event Event that on average will occur once every 100 years. Also expressed as
an event, which has a 1% probability of occurring in any one year.
1 in 100 year design Flood defence that is designed for an event, which has an annual
standard probability of 1%. In events more severe than this the defence would be
expected to fail or to allow flooding.
44 Flood Investigation Report: Windermere (5th-6th December 2015)Cumbria County Council
Appendix 2: Summary of Relevant Legislation and Flood
Risk Management Authorities
The table below summarises the relevant Risk Management Authority and details the various local
source of flooding that they will take a lead on.
Flood Environment Lead Local District Water Highway
Source Agency Flood Council Company Authority
Authority
RIVERS
Main river
Ordinary
watercourse
SURFACE
RUNOFF
Surface
water
Surface
water on the
highway
OTHER
Sewer
flooding
The sea
Groundwater
Reservoirs
The following information provides a summary of each Risk Management Authority’s roles and
responsibilities in relation to flood reporting and investigation.
Government – DEFRA develop national policies to form the basis of the Environment Agency’s
and the LLFA’s work relating to flood risk.
Environment Agency has a strategic overview of all sources of flooding and coastal erosion as
defined in the Act. As part of its role concerning flood investigations this requires providing
evidence and advice to support other Risk Management Authorities (RMA’s). The EA also
collates and reviews assessments, maps, and plans for local flood risk management (normally
undertaken by LLFA).
Lead Local Flood Authorities (LLFAs) – Cumbria County Council is the LLFA for Cumbria under
the Flood & Water Management Act 2010. Part of their role requires them to investigate
significant local flooding incidents and publish the results of such investigations. LLFAs have a
duty to determine which RMA has relevant powers to investigate flood incidents to help
understand how they happened, and whether those authorities have, or intend to, exercise their
powers. LLFAs work in partnership with communities and flood RMA’s to maximise knowledge
of flood risk to all involved. This function is carried out at CCC by the Development
Management Team.
45 Flood Investigation Report: Windermere (5th-6th December 2015)Cumbria County Council District and Borough Councils – These organisations perform a significant amount of work relating to flood risk management including providing advice to communities and gathering information on flooding. These organisations are classed as RMA’s. Water and Sewerage Companies manage the risk of flooding to water supply and sewerage facilities and the risk to others from the failure of their infrastructure. They make sure their systems have the appropriate level of resilience to flooding and where frequent and severe flooding occurs they are required to address this through their capital investment plans. It should also be noted that following the Transfer of Private Sewers Regulations 2011 water and sewerage companies are responsible for a larger number of sewers than prior to the regulation. These organisations are classed as RMA’s Highway Authorities have the lead responsibility for providing and managing highway drainage and certain roadside ditches that they have created under the Highways Act 1980. The owners of land adjoining a highway also have a common-law duty to maintain ditches to prevent them causing a nuisance to road users. These organisations are classed as RMA’s Flood risk in Cumbria is managed through the Making Space for Water process, which involves the cooperation and regular meeting of the Environment Agency, United Utilities, District/Borough Councils and CCC’s Highway and LFRM Teams to develop processes and schemes to minimise flood risk. The MSfWGs meet approximately 4 times per year to cooperate and work together to improve the flood risk in the vulnerable areas identified in this report by completing the recommended actions. CCC as LLFA has a responsibility to oversee the delivery of these actions. Where minor works or quick win schemes can be identified, these will be prioritised and subject to available funding and resources will be carried out as soon as possible. Any major works requiring capital investment will be considered through the Environment Agency’s Medium Term Plan process or a partners own capital investment process. Flood Action Groups are usually formed by local residents who wish to work together to resolve flooding in their area. The FAGs are often supported by either CCC or the EA and provide a useful mechanism for residents to forward information to the MSfWG. 46 Flood Investigation Report: Windermere (5th-6th December 2015)
You can also read