Viet Nam - Food and Agriculture Organization of the United ...
←
→
Page content transcription
If your browser does not render page correctly, please read the page content below
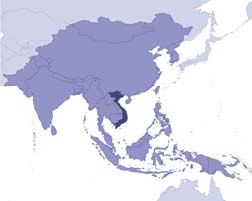
1

Viet Nam

Geography, climate and population
Geography
Viet Nam is located in the eastern part of the Indochina peninsula, bordered by China in the
north, the South China Sea in the east and south, the Gulf of Thailand in the southwest, and
Cambodia and Lao People’s Democratic Republic in the west. The total area of the country is
331 052 km2 (Table 1). The country is divided into 64 provinces including the capital Hanoi.
Based on topographic, climatic and socio-economic conditions, these provinces are grouped
into eight regions from north to south: North West, North East, Red river delta, North Central
Coast, South Central Coast, Central Highland, South East and Mekong river delta.

Mountains and hills cover more than three-quarters of the territory, although over 70 percent
of the country lies below 500 m above sea level. Viet Nam has a dense hydrographic network.
About 25 percent of the total land area is covered by plains, the most important being the Bac
Bo in the north and Nam Bo in the south, corresponding to the courses of the Red river and
Mekong river respectively.

In 2009, the total cultivated area was 9.63 million ha, of which 6.28 million ha was arable land
and 3.35 million ha under permanent crops. Rice is by far the largest crop, followed by amongst
others maize, coffee, rubber, tubers, vegetables and coconut.

Climate
Viet Nam is located in a complicated climatic zone: hot, humid and rainy. It is characterized by
a subtropical climate with four separate seasons – spring, summer, autumn and winter – in the
north and a tropical climate with only two seasons – dry and wet – in the south. Average annual
precipitation is around 1 820 mm (Table 2). It varies from an average 1 600 to 2 200 mm in the
midlands and plains and 2 000 to 2 500 mm in the mountainous areas. A minimum of 650 mm
can be found in Phan Rang in the South Central region and a maximum of 4 760 mm in Bac
Quang in the North East region. The rainy season lasts from April-May to October-November.

The driest periods are either from December to February or from January to March depending
on specific location. Central Viet Nam is often affected by hurricanes and storms and very large
waves from the South China Sea. Annual average evaporation is 953 mm. Average temperature
varies from 15 °C in winter to 25 °C in summer. Temperature during the hottest days is
38-40 °C and, during the coldest days, 11-14 °C in the north.

Population
The total population in 2009 was around 86.9 million, of which 70 percent lived in rural
areas (Table 1). The estimated average annual population growth rate for 1999-2009 was an
estimated 1. 1 percent. Population density in 2009 was about 263 inhabitants/km2.

In 2008, the rate of urban population with access to improved water supply was 99 percent
whereas that of the rural population was 92 percent.
2 Irrigation in Southern and Eastern Asia in figures – AQUASTAT Survey – 2011
CHINA
Lake Ky
C
NORTHBa Be B ung
an
NORTH R EAST GiK
a
g
ed yngC
WESTD T
a Thac Ba Ye
n
i Bac
Tien
Cam
Son
ES La Hanoi Giang
MYANMAR Thac
Lake Ho-Tay Thai Binh
Hoa Binh ng PhongC
Hai Hai
Ti
LAO PEOPLE'S Duong hai Binh
Gulf of
M RED
Ho
DEMOCRATIC REPUBLIC ha ai Ph
RIVER Tonkin
Chu DELTA
RED
Gulf of
Ban Ve Ca CHINA
NORTH
M
CENTRAL
ek
ng H
COAST
o
g
THAILAND Hue
Huon
Danang South
g
H
on
u BD outh
China
Th
huc i
Sea
K
r KTra
SOUTH
Yaly CENTRAL
UT
Ba
COAST
NTR L
CAMBODIA
Srepo CENTRAL
k
HIGHLAND
Cai
Thac Mo Do ng N ai Da Nhim
Me
n on
SOUTH n Phan Rang
Gulf of Dau
T c Mo Do Nhim
ko ko
S Saig
Tieng EAST
SOUTH
ng
Da
u Tri
ST An
Thailand
Ho Chi
r AnMinh City
MEKONG
RIVER
MEKONG
DELTA
RIVER
Legend
International Boundary River
Administrative Boundary Canal
Capital Regional Capital, Town Lake
l
Dam
Zone
Z of Irrigation
I g t Development
D l p t
00 500
001,000
000 22000
000 3,000 km
000 km
Albers EEqual
Albers u l Area
r PProjection WGS 984
jection WGS 1984
VIET NAM FAO - AQUASTAT, 2011
Disclaimer
The designations employed and the presentation of material in this publication do not imply the expression of any opinion whatsoever on the part of the
Food and Agriculture Organization of the United Nations concerning the legal status of any country, territory, city or area or of its authorities,
or concerning the delimitation of its frontiers or boundaries.Viet Nam 3
TABLE 1
Basic statistics and population
Physical areas
Area of the country 2009 33 105 200 ha
Cultivated area (arable land and area under permanent crops) 2009 9 630 000 ha
• as % of the total area of the country 2009 29 %
• arable land (annual crops + temp fallow + temp meadows) 2009 6 280 000 ha
• area under permanent crops 2009 3 350 000 ha
Population
Total population 2009 86 901 000 inhabitants
• of which rural 2009 70 %
Population density 2009 263 inhabitants/km2
Economically active population 2009 46 076 000 inhabitants
• as % of total population 2009 53 %
• female 2009 49 %
• male 2009 51 %
Population economically active in agriculture 2009 29 301 000 inhabitants
• as % of total economically active population 2009 64 %
• female 2009 49 %
• male 2009 51 %
Economy and development
Gross Domestic Product (GDP) (current US$) 2009 90 091 million US$/yr
• value added in agriculture (% of GDP) 2009 21 %
• GDP per capita 2009 1 037 US$/yr
Human Development Index (highest = 1) 2010 0.572
Access to improved drinking water sources
Total population 2008 94 %
Urban population 2008 99 %
Rural population 2008 92 %
Economy, agriculture and food security
In 2009, gross domestic product (GDP) of Viet Nam was US$90 091 million, with a value
added in agriculture reaching the 21 percent of the GDP. The total economically active
population was about 46.1 million inhabitants (49 percent female) of which 29.3 million are
active in agriculture (49 percent female) (Table 1). The average annual unemployment rate was
5.8 percent during the period 2001–2005.
Agriculture plays a very important role in socio-economic development, in poverty alleviation
and in food security. Recently, the country has become one of the three top countries in the
world for rice exports, together with Thailand and the United States.
The production of cereals, sugar, roots, tubers and meat is large enough to ensure both domestic
consumption and provide a surplus for export. However, the country’s production capacity for
vegetable oils and milk does not meet domestic demand.
About one-fifth of all rural households are headed by women. Gender inequality between male
and female headed households in the agricultural sector, identified on the basis of the 2006 rural,
agriculture and fishery census, includes inequalities related to access to land, land size, irrigated
land cultivated land. National level results show that access to agricultural land in rural areas by
households headed by women is 13 percent lower than that for households headed by men.4 Irrigation in Southern and Eastern Asia in figures – AQUASTAT Survey – 2011
TABLE 2
Water: sources and use
Renewable freshwater resources
Precipitation (long-term average) - 1 821 mm/yr
- 603 000 million m3/yr
Internal renewable water resources (long-term average) - 359 400 million m3/yr
Total actual renewable water resources - 884 100 million m3/yr
Dependency ratio - 59.4 %
Total actual renewable water resources per inhabitant 2009 10 174 m3/yr
Total dam capacity 2009 28 038 million m3
Water withdrawal
Total water withdrawal 2005 82 031 million m3/yr
- irrigation + livestock 2005 77 751 million m3/yr
- municipalities 2005 1 206 million m3/yr
- industry 2005 3 074 million m3/yr
• per inhabitant 2005 986 m3/yr
Surface water and groundwater withdrawal 2005 82 031 million m3/yr
• as % of total actual renewable water resources 2005 9.3 %
Non-conventional sources of water
Produced wastewater 2003 1 100 million m3/yr
Treated wastewater 2003 250 million m3/yr
Reused treated wastewater 2003 175 million m3/yr
Desalinated water produced - million m3/yr
Reused agricultural drainage water - million m3/yr
The average area of land accessed by households headed by women a is 27 percent smaller
than that of male headed households. Further, the size of irrigated land among female headed
households is 41 percent less compared to that of male headed households. Less than 10 percent
of all commercial farms in Viet Nam are owned by households headed by women. Other gender
inequalities include access to information and communication, access to loans and livestock
production (FAO, 2010).
Water resources and use
Water resources
The distribution of water resources is highly variable during the year owing to unevenly
distributed monsoon rainfall. High variations, combined with limited storage and flood control
infrastructure, result in devastating floods in the wet season and extreme low flows in the dry
season. About 70-75 percent of the annual runoff is generated in three to four months.
Viet Nam has a dense network of 2 360 rivers with a length of more than 10 km each. There
are 16 river basins that are larger than 2 000 km2, eight of which have a catchment area larger
than 10 000 km2 (Table 3). Other basins are either have a small area, such as Tien Yen and Muc,
or have several small coastal rivers grouped together, such as Giang/Huong, Tra Khuc and Cai-
Luy. The eight major basins represent 77 percent of the country’s area. The largest basins are the
Mekong and the Red river/Thai Binh, covering 45 percent of the territory.
Almost 60 percent of the total water resources are generated outside the country, making the
country susceptible to decisions made about water resources in upstream countries. The total
area of all international basins in and outside Viet Nam is to 1.2 million km2.Viet Nam 5
TABLE 3
Eight large river basins in Viet Nam
Total area of Area of basin in % of basin in % of Viet Nam
River basin
basin (km2) Viet Nam (km2) Viet Nam in basin
Mekong 795 000 63 600 8 19
Red River-Thai Binh (includes Da River basin) 155 000 85 250 55 26
Dong Nai 44 100 37 485 85 12
Ma-Chu 28 400 17 608 62 5
Ca 27 200 17 680 65 5
Ba 13 900 13 900 100 4
Ky Cung-Bang Giang 11 220 10 547 94 3
Thu Bon 10 350 10 350 100 3
Total 1 086 170 256 420 77
Viet Nam has abundant surface water resources in terms of total runoff, which accounts for
848 km3/year on average, but the shortage of water is aggravated during the 6-7 months dry
season when the runoff is only 15-30 percent of this total. About 323 km3/year (38 percent) of
the total runoff are generated within the country.
More than 90 percent of the Mekong river basin and 45 percent of the Red river basin lie
outside Viet Nam. The Ma and Ca rivers both have about 40 percent of their basin area outside
the country and the Dong Nai 15 percent. The average annual contribution from neighbouring
countries to the runoff in Viet Nam is around 524.71 km3, including 470.1 km3 (Mekong) and
1.41 km3 (Dong Nai) from Cambodia, 44.1 km3 (Red) from China, and 9.1 km3 (Ca and Ma)
from Lao People’s Democratic Republic.
Internal renewable groundwater resources are abundant, an estimated 71.418 km3/year.
Over 50 percent of these resources are in the central part, about 40 percent in the north and
10 percent in the south. A large amount of water is stored in unconsolidated alluvial sand and
gravel geological formations found in plains and valleys. An estimated 35 km3/year returns
to the rivers as base flow and can be considered to be the overlap between surface water and
groundwater. Therefore total Internal Renewable Water Resources (IRWR) are an estimated
359.418 km3/year (=323+71.418-35). By adding together the internal and external water
resources, the total renewable water resources are an estimated 884.128 km3/year.
The exploitable groundwater resources are about 6-7 km3/year. In some areas, over-exploitation
has caused water tables to fall, which has contributed to further land subsidence and salinity
intrusion, especially in the Mekong river delta.
Viet Nam is rich in freshwater and marine wetlands, which are mainly distributed in the
Red river and the Mekong river deltas and along the 3 260 km coastline. The Directory of
Asian Wetlands lists over 25 wetland sites in Viet Nam that meet the criteria for ‘Wetlands of
International Importance’. Despite this the only designated site under the Ramsar Convention
is the Xuan Thuy National Park, a 12 000 ha mangrove in the Red river delta region. However,
there are plans for additional Ramsar sites, including the Tram Chim National Park in Dong
Thap province in the Mekong river delta.
In 2000, Can Gio mangrove forest was designated as ‘Man and Biosphere Reserve’ by the
United Nations Educational, Scientific and Cultural Organization (UNESCO), Viet Nam’s
first protected area. More wetland sites are being proposed for inclusion in a list of protected
areas. Also, to fulfil the government commitments to the Ramsar Convention, the Ministry of
Natural Resources and Environment (MONRE) has submitted a government decree on wetland6 Irrigation in Southern and Eastern Asia in figures – AQUASTAT Survey – 2011
conservation and sustainable utilization to the Prime Minister. A national strategy on wetland
management and conservation was approved in 2003.
There are two natural lakes in Viet Nam: Lake Ho-Tay with a surface area of 4.13 km2 and
a volume of 8 million m3, and Lake Ba Be with a surface area of 4.5 km2 and a volume of
90 million m3.
Viet Nam has 800 medium and larg dams and reservoirs, and 1 967 reservoirs with a storage
capacity of at least 0.2 km3. In 2009, total dam capacity was about 28 km3. Seven dams have a
capacity of more than 1 km3: Hoa Binh (9.5 km3), Thac Ba (2.9 km3), Tri An (2.8 km3), Tuyen
Quang (2.2 km3), Dau Tieng (1.6 km3), Thac Mo (1.4 km3) and Yaly (1.0 km3). Another four
dams of over 1 km3 are under construction: Son La (9.3 km3), Phuoc Hoa (2.5 km3), Ban Ve
(1.8 km3) and Cua Dat (1.4 km3). Most reservoirs are multipurpose: hydropower, flood control,
navigation, irrigation and fisheries.
Viet Nam has an estimated hydropower potential of about 14 000 to 17 000 MW of which
nearly 3 600 MW have been developed, and about 800 MW are under construction. The
National Hydropower Plan Study plans a possible installation of an additional 5 045 MW.
Hydropower is a non-consumptive use of water, but the need to maintain a certain water
level may negatively affect availability downstream. This may cause local drought and water
use conflicts between hydropower and agriculture downstream, and sudden releases may
cause flooding and river erosion. Therefore, the operation of hydropower plants needs to be
coordinated with other water using sectors, mainly agriculture.
In 2003, out of a total of 1 100 million m3 of wastewater produced, about 250 million m3 were
treated, of which 70 percent (175 million m3) were reused (Table 2).
International water issues
Viet Nam is a downstream riparian state for most of its transboundary rivers, of which the
six major ones are: the Bang-Ky Cung and Red rivers, coming from China; the Ma and Ca,
coming from Lao People’s Democratic Republic; and the Dong Nai and Mekong, coming from
Cambodia. Most of the rivers flow to the Gulf of Tonkin and the South China Sea. The Bang-
Ky Cung flows to China, and the Srepok to the Mekong in Cambodia.
The government has obtained many agreements with the neighbouring countries related to the
exploitation and management of these rivers, such as water allocation, pollution management,
flood control and others. The agreement established in 1995 by the four lower Mekong riparian
countries offers new opportunities for regional collaboration in developing the basin’s water
and related ecological resources. Some examples of promising collaboration are related to flood
control in the Mekong delta with Cambodia, and the possible importation of hydropower from
upper riparians.
Water use
In 2005, the total annual water withdrawal for agriculture, industries and municipal purposes
was an estimated 82.03 km3. Irrigated agriculture uses the most water, accounting for
77.75 km3 or 94.8 percent of total water withdrawals (Table 2 and Figure 1). Industrial and
municipal sectors account for 3.07 km3 (3.7 percent) and 1.21 km3 (1.5 percent) respectively.
In 1990, total annual water withdrawal was around 54.3 km3, of which agriculture accounted
for 86 percent, industrial use for 10 percent and municipal use for 4 percent.
In 2005, primary surface water withdrawal was around80.45 km3 (98.1 percent of total water
withdrawal), while primary groundwater withdrawal accounted for only 1.40 km3 (1.7 percent)
(Figure 2). Groundwater is mainly used for municipal water supply in urban areas. In 2003, reusedViet Nam 7
treated wastewater was about 175 million m3,
FIGURE 1
which represents 0.2 percent of total water
Water withdrawal by sector
withdrawal. In 1990, it was estimated that less Total 82.031 km3 in 2005
than 1.5 percent of the water withdrawal was
met by groundwater. Municipalities Industry
1% 4%
Irrigation and drainage
development
Evolution of irrigation
development
Small indigenous irrigation systems have long
been employed in Viet Nam. Modern irrigation
Irrigation + livestock
development stagnated until reunification of
95%
the country in 1975.
Early post-1975 growth was in small and
FIGURE 2
medium irrigation schemes, while during the Water withdrawal by source
period 1985-1990 growth was concentrated Total 82.031 km3 in 2005
in large irrigation and multipurpose schemes.
The total irrigated area expanded at a rate groundwater Direct use of
1.7% treated wastewater
of 2.9 percent/year in the period 1980-
0.2%
1987, while between 1988 and 1994 it was
4.58 percent/year. In 1994, there were about
3 million ha of irrigated land in Viet Nam.
The irrigation potential has been evaluated
as 9 400 000 ha (Table 4). In 2005, the total
equipped area for irrigation accounted for
Surface water
4 585 500 ha or 48.8 percent of the potential. 98.1%
The actually irrigated area was 100 percent of
the area equipped for irrigation. Although
the potential for irrigation development is large, upgrading the existing and constructing new
irrigation systems requires a huge amount of capital. This, indeed, is a considerable challenge
for the country because of limited national budget and external assistance.
In 2005, surface irrigation accounted for 99.98 percent of the total area equipped for irrigation,
while sprinkler irrigation accounted for 0.02 percent (Figure 3). In 2005, 99 percent of the
area equipped for irrigation was irrigated by surface water, while groundwater accounted for
1 percent (Figure 4).
The average yearly increase during the period 1994-2005 was around 3.9 percent. During this
period Viet Nam invested in the water sector, which included construction of new infrastructure
and rehabilitation of existing works especially irrigation and drainage systems.
There are 1 638 297 ha of small irrigation systems (< 5 000 ha), 1 202 390 ha of medium irrigation
schemes (5 000 – 50 000 ha) and 1 744 813 ha of large irrigation schemes (> 50 000 ha) (Figure
5). About 2 148 140 ha were power irrigated. In 1994, two-thirds of the total irrigation area was
in the two large deltas (37 percent in the Red delta, and 27 percent in the Mekong delta).
In 1994, of the total irrigated area, formal government schemes covered about 54.4 percent,
equipped with pumped or gravity irrigation. The remaining area was private land, which8 Irrigation in Southern and Eastern Asia in figures – AQUASTAT Survey – 2011
TABLE 4
Irrigation and drainage
Irrigation potential 9 400 000 ha
Irrigation
1. Full control irrigation: equipped area 2005 4 585 500 ha
- surface irrigation 2005 4 584 400 ha
- sprinkler irrigation 2005 1 100 ha
- localized irrigation - ha
• % of area irrigated from surface water 2005 99 %
• % of area irrigated from groundwater 2005 1 %
• % of area irrigated from mixed surface water and groundwater %
• % of area irrigated from mixed non-conventional sources of water %
• area equipped for full control irrigation actually irrigated 2005 4 585 500 ha
- as % of full control area equipped 2005 100 %
2. Equipped lowlands (wetland, ivb, flood plains, mangroves) - ha
3. Spate irrigation - ha
Total area equipped for irrigation (1+2+3) 2005 4 585 500 ha
• as % of cultivated area 2005 49 %
• % of total area equipped for irrigation actually irrigated 2005 100 %
• average increase per year over the last 11 years 1994-2005 3.9 %
• power irrigated area as % of total area equipped 2006 47 %
4. Non-equipped cultivated wetlands and inland valley bottoms - ha
5. Non-equipped flood recession cropping area - ha
Total water-managed area (1+2+3+4+5) 2005 4 585 500 ha
• as % of cultivated area 2005 49 %
Full control irrigation schemes Criteria
Small-scale schemes < 5 000 ha 2005 1 638 297 ha
Medium-scale schemes > 5 000 ha and < 50 000 ha 2005 1 202 390 ha
Large-scale schemes > 50 000 ha 2005 1 744 813 ha
Total number of households in irrigation -
Irrigated crops in full control irrigation schemes
Total irrigated grain production (wheat and barley) - metric tons
• as % of total grain production - %
Harvested crops
Total harvested irrigated cropped area 2005 8 728 192 ha
• Annual crops: total 2005 7 743 297 ha
- Rice 2005 6 842 127 ha
- Maize 2005 265 540 ha
- Sweet potatoes 2005 99 532 ha
- Cassava 2005 167 920 ha
- Groundnuts 2005 139 304 ha
- Soyabeans 2005 97 119 ha
- Sugarcane 2005 105 800 ha
- Cotton 2005 14 790 ha
- Tobacco 2005 8 600 ha
- Other annual crops 2005 2 565 ha
• Permanent crops: total 2005 984 895 ha
- Bananas 2005 54 626 ha
- Citrus 2005 46 068 ha
- Coffee 2005 259 607 ha
- Tea 2005 62 551 ha
- Rubber 2005 253 690 ha
- Coconuts 2005 25 041 ha
- Other permanent crops 2005 283 312 ha
Irrigated cropping intensity (on full control area actually irrigated) 2005 190 %
Drainage - Environment
Total drained area 2006 2 538 844 ha
- part of the area equipped for irrigation drained - ha
- other drained area (non-irrigated) - ha
• drained area as % of cultivated area 2006 27 %
Flood-protected areas - ha
Area salinized by irrigation 1999 300 000 ha
Population affected by water-related diseases - inhabitantsViet Nam 9
was irrigated by swing baskets, buckets,
FIGURE 3
small private pumps and small gravity Irrigation techniques on area equipped
diversion systems. This type of irrigation is for full control irrigation - Total 4 585 500 ha in 2005
concentrated in the Mekong delta and, to a
Sprinkler irrigation
much lesser extent, in the Red delta. Some 0.02%
59 percent of the pump irrigation capacity is
electrically driven, the remainder relies on oil
powered engines.
Currently, Viet Nam has 75 large hydraulic
works, 5 000 irrigation culverts and drainage
sewers (large), and over 10 000 pumping
stations (large and medium) with the total Surface irrigation
capacity of 24.8 million m3/h. 99.98%
Role of irrigation in agricultural
production, economy and society
Irrigated agriculture plays a very important role in the socio-economic development of the
country for poverty reduction, food security, gender equity improvement in rural areas, and
the improvement of cropping patterns and the environment. Areas relying on full irrigation
attained an average paddy yield of 4.89 tonnes/ha for the entire country. The highest paddy
yield of 5.44 tonnes/ha was in the Red River Delta and the lowest paddy yield of 3.58 tonnes/
ha was in the North West.
In 2005, the value of cereals produced was about US$7 000 million. As reported in 2005, the total
harvested irrigated cropped area was around 8 728 192 ha. The main crops are cereals, such as rice
(6 842 000 ha) and maize (265 540 ha), and industrial trees such as coffee (259 600 ha) and rubber
(253 700 ha) (Table 4 and Figure 6). In 1994, the harvested irrigated rice area was 5 460 000 ha
on a physical area of 2 100 000 ha, giving an irrigated rice cropping intensity of 2.6.
In 2004, the average cost of irrigation development on public schemes was aboutUS$3 875/ha,
while in 2006, on-farm installation of sprinkler irrigation was almost US$4 700/ha. The cost of
operation and maintenance (O&M) on public schemes was US$7/ha.
Status and evolution of drainage development
In 2006, the drainage systems covered
2 538 000 ha, mostly in the northern and
central parts of the country, particularly FIGURE 4
the Red river delta (Table 4). Interestingly, Source of irrigation water on area equipped
for full control irrigation
almost all pumping irrigation stations in Viet Total 4 585 500 ha in 2005
Nam, particularly in the Red river delta, are
responsible for drainage. In 2004, the average Groundwater
cost of drainage development on public 1%
schemes was US$620/ha.
Water management, policies
and legislation related to
water use in agriculture
Institutions
Surface water
According to the Water Law, the government is 99%
responsible for the state management of water10 Irrigation in Southern and Eastern Asia in figures – AQUASTAT Survey – 2011
resources through the Ministry of Natural
FIGURE 5
Resources and Environment (MONRE),
Type of full control irrigation schemes
Total 4 585 500 ha in 2005
which was transferred from the Ministry of
Agriculture and Rural Development (MARD),
while the service function of irrigation and rural
> 50 000 ha
water supply remains with MARD. However,
< 5 000 ha the National Water Resources Council
38%
36% (NWRC), which manages water resources,
is above the ministries and below the Prime
Minister’s Office. At province and district level,
the Provincial Peoples Committees, which is
directly controlled by the central government,
are responsible for implementation in their
own jurisdiction. Specific functions of water
5 000 - 50 000 ha resources management and water use are
26%
allocated to ministries and non-line agencies
are as follows:
¾¾ Ministry of Natural Resources and Environment is responsible for water resources
management.
¾¾ Ministry of Agriculture and Rural Development is responsible for the management of
flood and typhoon protection systems, hydraulic structures, wetland management, and
rural water supply and sanitation.
¾¾ Ministry of Industry is responsible for the construction, O&M of hydropower facilities.
¾¾ Ministry of Construction is responsible for the spatial planning and construction of
urban water supply, sanitation and drainage facilities.
¾¾ Ministry of Transport is responsible for the planning, construction and management of
waterway transport systems.
FIGURE 6
Harvested crops on area equipped for full control irrigation
Total harvested area 8 728 192 ha in 2005 (cropping intensity on actually irrigated area: 190% in 2005)
Other permanent crops
Coconuts
Citrus
Bananas
Tea
Rubber
Coffee
Other annual crops
Tobacco
Cotton
Soyabeans
Sweet potatoes
Sugarcane Rice total:
6 842
Groundnuts thousand ha
Cassava
Maize
Rice
0 50 100 150 200 250 300
Thousand hectaresViet Nam 11
¾¾ Ministry of Fisheries is responsible for the protection and exploitation of aquatic
resources.
¾¾ Ministry of Health is responsible for the management of drinking water quality.
¾¾ Ministry of Planning is responsible for the planning and investment in the water and
investment resources sector.
¾¾ Ministry of Finance is responsible for the development of policies on taxes and fees for
water resources.
Water management
In Viet Nam the water sector has no overall integrated strategy and action plan at national or
regional basin level. However, strategies and action plans exist for a number of the subsectors.
In 2000 the NWRC and in 2001 three Boards for River Basin Planning and Management were
established to work under the government as advisory, coordination and planning units. With
the creation of MONRE in 2002, the responsibilities of the state management of water resources
were assigned to the Agency of Water Resources Management within MONRE. This important
change shows a separation of state management and service functions for water resources.
Previously, both water resources management and service functions were the responsibility of
the Agency of Water Resources and Hydraulic Works Management under MARD.
A national strategy of participatory irrigation management (PIM), together with an action plan
approved in 2004 is being implemented. Many water user organizations have been established
to take over management of irrigation at the local level (tertiary system of canals and intakes)
for the entire country, besides the conventional model of irrigation management, which is by
agricultural cooperatives responsible for irrigation and drainage. Management of O&M for
secondary and main systems and headworks falls under irrigation management companies/
enterprises (IMCs/IMEs), defined as public units providing public goods.
The existing environmental information and reporting system iis comprised of a national network
of environmental monitoring stations, as well as environmental monitoring at the provincial level.
The Environmental Monitoring Network is managed by the National Environmental Agency
(NEA) of the Ministry of Science, Technology and Environment (MOSTE). By 2002, the
network had expanded to 21 stations, which conduct monitoring at 250 locations in 45 provinces.
Since the establishment of MONRE, the responsibility of producing the state of environment
(SOE) reports lies with the Department of Environment and data collection is a mandate of the
Office of Data and Information under Viet Nam Environmental Protection Agency (VEPA).
The objective of the 1999 to 2007 Mekong Delta’s Water Resources Project, was to increase
agricultural production, reduce rural poverty, improve living conditions in the project area, and
facilitate sustainable water resources development and management in the Mekong Delta.
Finance
The proportion of government expenditures on water-related activities, as part of the total
national budget expenditure has declined. Public expenditure for the water sector has increased
at an annual average of 8.9 percent during the period 1996-2001. Although spending on water
resource management is far too little compared to investment (less than 1 percent) and accounts
for less than 10 percent of the current budget expenditure, public investment in the water sector
comprised a considerable proportion of the national budget investment from 1996 to 1998
(about 33 percent). This has declined since 1999 owing to a shift in the focus of the national
budget ’towards banking systems and improviement of state-owned enterprises. The main
investments are made in irrigation, clean water supply and drainage. In 2001, Viet Nam spent
about US$560 million in the water sector, which was 6.8 percent of total budget expenditure.12 Irrigation in Southern and Eastern Asia in figures – AQUASTAT Survey – 2011
Irrigation fees were first established in 1984 in some provinces, such as Vinh Long in the
Mekong River Delta Region. Funds are received as payments from farmers who are water
user for irrigation fees and the government budget subsidy. The method of cost recovery for
irrigation is stipulated in Decree No. 43/2003/NĐ-CP.
According to this decree, the basic fees decided for the specific regions are based on the levels
of irrigation services provision and fully irrigated area, and other fees of the various levels of
partly irrigated areas are decided based on the basic fees that depend on the natural features and
socio-economic development of the regions. In the Red river delta, for example, the irrigation
and drainage fee for pumping irrigation services is from US$33/ha to US$50/ha in the spring,
and from US$30/ha to US$ 47/ha in the summer.
Policies and legislation
Viet Nam has a relatively comprehensive framework of institutions and polices for managing
water, irrigation and drainage, such as Water Law (1998, effective from 1/1/1999), Ordnance
No. 32/2001/PL-UBTVQH10 on the exploitation and protection of hydraulic works (2001),
Decree No. 31/2005/NĐ-CP on the production and supply of public services, Circular No.
90/2004/ TTLT/BTC-BNN on guidelines or financial management of the State Enterprises in
the exploitation of hydraulic works, and Decree No. 43/2003/NĐ-CP on the specific regulation
of enforcing some articles of the Ordinance No. 32/2001/PL-UBTVQH10.
The Water Law is a major step towards integrated water resources management. Currently,
only partial progress has been made in implementing the reforms it embodies. The secondary
legislation necessary for implementing many of the law’s objectives have not yet been developed.
The law is basically formulated as a flexible legal framework and a number of decrees were
subsequently added. These decrees define the roles, functions, and responsibilities of the
institutional bodies for carrying out the water law. The legislative framework is described in
circulars on guidance, proceedings of licensing exploitation and utilization of surface water, and
licensing of discharging wastewater into water sources.
The ‘Socio-Economic Development Strategy for 2001-2010’ proposed a number of water-related
strategies/objectives. With the approval in 2005 of a National Water Resources Development
to 2020, the water sector has an overall integrated strategy and action plan at the national and
regional basin level. In addition, strategies and action plans exist for a number of subsectors:
¾¾ Strategy for Rural Agriculture Development in the Industrialization and Modernization
Period to2010 (MARD, July 2000);
¾¾ Agriculture and Rural Development Plan (2001- 2005) (MARD, August 2000);
¾¾ National Strategy for Rural Water Supply and Sanitation (NRWSS);
¾¾ Second National Strategy and Action Plan for Disaster Mitigation and Management in
Viet Nam from 2001 to 2020 (MARD and Central Committee for Flood and Storm
Control, December 2001.
Environment and health
Although data on water quality are poor, recorded evidence shows the pollution level is increasing
for surface water, groundwater and coastal waters. Although the quality of the upstream river
water is generally good, downstream sections of major rivers reveal low water quality. Most of
the lakes and canals in urban areas are fast becoming sewage sinks. Groundwater shows pockets
of contamination and intrusion of salinity. Rapid urbanization and industrialization in coastal
areas, port and marine transport development, expansion in coastal tourism, and an increase in
the number of oil spills contribute to the deterioration of coastal water quality.Viet Nam 13 The National Monitoring Network (NMN) covers four rivers running through the main urban areas the: Red (Hanoi), Cam (Haiphong), Huong (Hue) and Saigon (Ho Chi Minh City). Other rivers are being monitored in the various regions. Trends indicate that the levels of two primary pollution indicators, Ammonia-nitrogen (NH4-N) and biochemical oxygen demand (BOD), vary considerably and exceed national water quality class A standards. The problems are worse during the dry season, when river flows are reduced. Industrial and other pollution adds to the human waste from the households areas. Around 70 industrial parks have been developed, with more than 1 000 hospitals nationwide some million m3 of untreated wastewater is discharged from these sources per day. According to MONRE, about 4 000 enterprises discharge wastewater, of which 439 enterprises are the most serious and have been reallocated or closed or will have to adapt cleaner technologies and treatment of their wastewater. Rivers in urban areas, especially major cities, are seriously polluted by untreated industrial wastewater. Surveys conducted by the Institute of Tropical Techniques and Environmental Protection show that the content of contaminants in rivers in Hanoi, Ho Chi Minh City, Hai Phong, Hai Duong, Bac Giang, Hue, Da Nang, Quang Nam and Dong Nai, are much higher than permissible levels. Untreated industrial wastewater discharging into rivers is the main source of pollution. According to the institute, industrial parks (IPs) and export processing zones (EPZs) in the Southern Key Economic Zone discharge over 137 000 m3 of wastewater containing nearly 93 tonnes of waste into the Dong Nai, Thi Vai and Saigon rivers each day. Meanwhile, 2 out of 12 IPs and EPZs in Ho Chi Minh City, 3 out of 17 in Dong Nai, 2 out of 13 in Binh Duong, and none of the IPs and EPZs in Ba Ria-Vung Tau province (South East Region) have wastewater treatment facilities. According to environmentalists, the Southern Key Economic Zone needed US$380 million in 2005 and US$867 million in 2010 to deal with environmental pollution. Within cities, lakes, streams, and canals increasingly serve as sinks for municipal and industrial wastes. Most of the lakes in Hanoi are seriously polluted with high BOD levels. Similarly, four small rivers in Hanoi and five canals in Ho Chi Minh City have levels of dissolved oxygen (DO) as low as 0-2 mg/litre, and BOD levels as high as 50-200 mg/litre. Groundwater is emerging as an important source of water for municipal, industrial, and agricultural use. While the quality of groundwater remains good, there are some pockets of contamination. There is evidence of pollution from poorly maintained septic tanks, garbage dumping, and industrial effluents and overexploitation in parts of Hanoi, Ho Chi Minh City and the Mekong river delta. Although there have been improvements in the provision of safe water to urban and rural populations, water-borne diseases are still a major problem. Dysentery and diarrhoea are widespread. In four years, recently, there were 6 million cases requiring treatment for water- borne diseases, which incurred a cost of US$27 million for treatment of cholera, typhoid, dysentery and malaria. The cost of treating polluted water varies considerably depending on the quality of the raw water, which either comes from rivers, reservoirs or groundwater. However, typical treatment costs vary from US$1/m3 to US$1.5/m3. The tariffs consumers pay depend on the use of the water. Typically, municipal tariffs vary from US$1.2/m3 to US$1.7/m3. Factories and other business users may pay up to US$5.6/m3. In early September 2001, a major oil spill occurred off the coast of Ba Ria-Vung Tau province (South East Region) after a collision between a Vietnamese tanker and a Taiwanese ship. As a result, some 900 m3 of DO oil poured into the Ba Ria-Vung Tau coastal area, causing extensive
14                                Irrigation in Southern and Eastern Asia in figures – AQUASTAT Survey – 2011

     environmental damage at nearby tourist beaches, shrimp farms and mangrove forests. Total
     financial losses caused by the disaster were an estimated US$17 million and costs for cleaning
     up polluted waters and beaches reached US$4 million.

     Flooding is an annual event in northern Viet Nam and the cause of enormous losses. With as
     much as 80 percent of the population living on the coastal plains and deltas, costs incurred
     from floods and typhoons are colossal. For the seven years from 1995 to 2002 the costs were
     US$1 250 million. Also the loss of lives, homesteads and general suffering of the people are
     immense. During 1995-2002 the human losses from typhoons and floods totalled 3 342 persons.
     In a study undertaken by United Nations Development Programme (UNDP), it was estimated
     that the average annual losses in the Red river delta and along the central coast could be
     substantially more than US$130 million. In a study undertaken by the Asian Development
     Bank, it was found that the average annual damage from flooding for the area protected by the
     dyke around Hanoi alone amounted to well over US$50 million per year.

     The number of adults with HIV/AIDS was 0.5 percent of the total population. In 2005 the
     estimated number of people needing antiretroviral therapy (0-49 years) was 25 000 people
     (WHO/UNAIDS, 2005).

     Prospects for agricultural water management
     According to the national strategy of water resources development, as a result of climate change
     total annual runoff could decrease by 2025 to 807 km3 (89 km3 in the dry season); by 2070 to
     765 km3 (76 km3 in the dry season) and by 2100 to 722 km3 (72 km3 in the dry season).

     The government has enacted laws, created institutions, expanded investments and decentralized
     authority to manage the country’s vast water resources efficiently and sustainably. However,
     rapid economic development, high population growth, worsening environmental conditions
     and frequent natural disasters are overwhelming the capacity of the existing policy and
     institutional framework and in turn are undermining the effectiveness of numerous government
     interventions. Given this history and context, the management of water resources is one of the
     most critical issues in Viet Nam.

     To achieve the objective of sustainable management of the country’s vast water resources, these
     key challenges need to be addressed:

        ¾¾ strengthening of institutions and policies for integrated water resources management;
        ¾¾ expanding and diversifying investment in infrastructure for the water sector, while
           paying more attention to financing for the management side;
        ¾¾ improving compliance and enforcement; and
        ¾¾ deepening community (users) participation.

     The core issues in tackling the challenges are adopting an integrated river basin approach,
     greater and more sufficient adaptation to the water-related vulnerability and susceptibility,
     expanded and more efficient services for irrigation and municipal water supply, and curbing
     water pollution and its health impacts on the poor. More proactive engagement in regional
     riparian cooperation, improving information management, complete separation of the water
     management and service functions, further decentralization of management authorities, and
     strengthening of institutional capacity would provide Viet Nam with the required management
     tools that will address equity, efficiency and environmental sustainability of its water resources.
Viet Nam 15 Main sources of information Bui Ba Bong. 2003. Investment cost for capital construction in water sector. Ministry of Agriculture and Rural Development. FAO. 1999. Irrigation in Asia in figures. FAO Water Report No. 18. Rome. FAO. 2010. National gender profile of agricultrual households: Lao PDR. Government of Viet Nam. 2005. Report on Vietnam land use for five years 2006-2010. Le Van Chinh, Nguyen Hong Khanh, Ngo Tri Quang, Le Van Duong & others. 2006. Water sector capacity assessment: basic data survey project 2004-2006: Final report. Le Van Duong, Le Van Chinh & Ngo Tri Quang. 2006. Statistical data on irrigated crops in Vietnam. Department of Water Resources, MARD. MARD (Ministry of Agriculture and Rural Development). 2006. The national strategy of water development to 2020. MARD. 2004. The report on 20 years of water resources development in Viet Nam. Nguyen Tan Dung. 2007. Decision on approval of land inventory results for 2005. To Trung Nghia. 2005. Strategy on Water Resources Development. Tran Sy Vinh. 2003. Program on Dam safety. Revised in 2005. Van Thanh, C. 2005. Statistical Year Book 2005. General Statistics Office World Bank. 2008. Innovations in rural water supply and irrigation: Vietnam’s Mekong Delta Water Resources Project. Washington, DC.
You can also read